. 2025 Feb;15(2):892-908.
doi: 10.1016/j.apsb.2024.11.022. Epub 2024 Dec 2.

Intestinal stearoyl-coenzyme A desaturase-inhibition improves obesity-associated metabolic disorders

Affiliations

Intestinal stearoyl-coenzyme A desaturase-inhibition improves obesity-associated metabolic disorders

Yangliu Xia et al. Acta Pharm Sin B. 2025 Feb.

Abstract

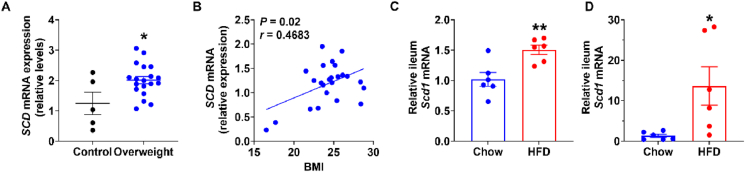
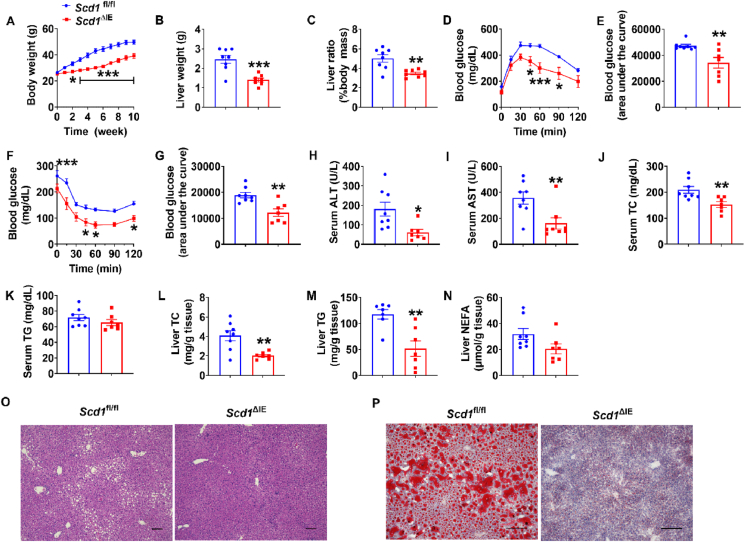
Stearoyl-coenzyme A desaturase 1 (SCD1) catalyzes the rate-limiting step of de novo lipogenesis and modulates lipid homeostasis. Although numerous SCD1 inhibitors were tested for treating metabolic disorders both in preclinical and clinic studies, the tissue-specific roles of SCD1 in modulating obesity-associated metabolic disorders and determining the pharmacological effect of chemical SCD1 inhibition remain unclear. Here a novel role for intestinal SCD1 in obesity-associated metabolic disorders was uncovered. Intestinal SCD1 was found to be induced during obesity progression both in humans and mice. Intestine-specific, but not liver-specific, SCD1 deficiency reduced obesity and hepatic steatosis. A939572, an SCD1-specific inhibitor, ameliorated obesity and hepatic steatosis dependent on intestinal, but not hepatic, SCD1. Mechanistically, intestinal SCD1 deficiency impeded obesity-induced oxidative stress through its novel function of inducing metallothionein 1 in intestinal epithelial cells. These results suggest that intestinal SCD1 could be a viable target that underlies the pharmacological effect of chemical SCD1 inhibition in the treatment of obesity-associated metabolic disorders.

Keywords: High-fat diet; Intestinal epithelium; MT1; Metabolic disorders; Obesity; Oxidative stress; SCD1; Steatosis.


Conflict of interest statement

The authors declare that no conflict of interest exists.

Figures

Image 1
Graphical abstract
Figure 1
Figure 1
SCD1 was induced in the small intestines of humans and mice with obesity. (A) mRNA levels of SCD in the ileum biopsies from individuals with obesity (n = 19) or without obesity (n = 5). (B) Correlation of SCD mRNA levels with body mass index (BMI); n = 24. (C, D) Scd1 mRNA levels in the ileum of C57BL/6N mice fed a chow diet or high-fat diet (HFD) for 3 weeks (C) or 10 weeks (D); n = 6. All data are presented as the mean ± SEM of biologically independent samples, analyzed by a two-tailed student's t-test (A, C and D) or a non-parametric Spearman's test (B). ∗P < 0.05, ∗∗P < 0.01, overweight versus control or HFD versus chow.
Figure 2
Figure 2
Scd1ΔIE mice displayed less obesity and hepatic steatosis under high-fat diet challenge. Scd1fl/fl and Scd1ΔIE mice were fed a chow diet or high-fat diet for 10 weeks; n = 8 for Scd1fl/fl group and n = 7 for Scd1ΔIE group. (A) Body weight curves. (B) Liver weights. (C) Liver index. (D, E) Glucose tolerance test (GTT) (D) and quantitation of area under the curve (E). (F, G) Insulin tolerance test (ITT) (F) and quantitation of area under the curve (G). (H) Serum alanine aminotransferase (ALT). (I) Serum aspartate aminotransferase (AST). (J) Serum total cholesterol (TC). (K) Serum triglyceride (TG). (L) Liver TC. (M) Liver TG. (N) Liver non-esterified fatty acid (NEFA). (O, P) Representative hematoxylin and eosin staining (O) and oil red O staining (P) of liver sections (n = 3 mice per group, three images per mouse per staining). Scale bar, 100 μm. All data are presented as the mean ± SEM of biologically independent samples, analyzed by a two-tailed student's t-test (B, C, E, G, H–N) or two-way ANOVA followed by Tukey's multiple comparisons test (A, D, F). ∗P < 0.05, ∗∗P < 0.01, ∗∗∗P < 0.001, Scd1ΔIEversus Scd1fl/fl.
Figure 3
Figure 3
Intestinal Scd1 disruption increased Mt1 expression. (A, B) RNA-seq analysis of Scd1fl/fl and Scd1ΔIE mice fed a high-fat diet (HFD) for 4 or 10 weeks. The volcano plot (A), and Venn plot (B) of the RNA-seq data from the intestines of Scd1fl/fl and Scd1ΔIE mice fed a HFD for 4 weeks or 10 weeks. (C–E) mRNA levels of Mt1 (C, D) and MT1 protein levels (E) in the jejunum of Scd1fl/fl and Scd1ΔIE mice fed a HFD for 4 weeks or 10 weeks; (F) mRNA levels of Mt1 in the jejunum of Scd1fl/fl and Scd1ΔIE mice fed with chow diet for 18 months; n = 8 for 4-week and 10-week HFD fed Scd1fl/fl group, n = 7 for 4-week and 10-week HFD fed Scd1ΔIE group, n = 5 for 18-month chow fed Scd1fl/fl and Scd1ΔIE groups. (G) mRNA levels of Mt1 in the primary intestinal epithelial cells isolated from Scd1fl/fl and Scd1ΔIE mice fed a HFD for 2 weeks; n = 3. (H, I) Malondialdehyde (MDA) levels (H) and glutathione (GSH) levels (I) in the ileum of Scd1fl/fl and Scd1ΔIE mice fed a HFD for 4 weeks. (J, K) MDA levels (J) and GSH levels (K) in the serum of Scd1fl/fl and Scd1ΔIE mice fed a HFD for 4 weeks. (L, M) MDA levels (L) and GSH levels (M) in the ileum of Scd1fl/fl and Scd1ΔIE mice fed a HFD for 10 weeks. (N, O) MDA levels (N) and GSH levels (O) in the serum of Scd1fl/fl and Scd1ΔIE mice fed a HFD for 10 weeks. All data are presented as the mean ± SEM of biologically independent samples, analyzed by a two-tailed student's t-test (C, D, F–O). ∗P < 0.05, ∗∗P < 0.01, ∗∗∗P < 0.001, Scd1ΔIEversusScd1fl/fl. TBARS, thiobarbituric acid reactive substances.
Figure 4
Figure 4
Intestinal Scd1 disruption decreased obesity and fatty liver through reducing oxidative stress. Scd1fl/fl and Scd1ΔIE mice were fed a high-fat diet and treated with vehicle or N-acetylcysteine (NAC) water (2 g/L) for 15 weeks, n = 6. (A) Body weight curve. (B) Liver weight. (C) Liver index. (D, E) Glucose tolerance test (GTT) (D) and quantitation of area under the curve (E). (F, G) Insulin tolerance test (ITT) (F) and quantitation of area under the curve (G). (H) Serum alanine aminotransferase (ALT). (I) Serum aspartate aminotransferase (AST). (J) Serum total cholesterol (TC). (K) Serum triglyceride (TG). (L) Serum non-esterified fatty acid (NEFA). (M) Liver TC. (N) Liver TG. (O) Liver NEFA. (P, Q) Representative hematoxylin and eosin staining (P) and oil red O staining (Q) of liver sections (n = 3 mice per group, three images per mouse per staining). Scale bar, 100 μm. (R–U) Malondialdehyde (MDA) and glutathione (GSH) levels in the ileum (R, S) and the serum (T, U) of Scd1fl/fl and Scd1ΔIE mice fed a high-fat diet and treated with vehicle or NAC water. All data are presented as the mean ± SEM of biologically independent samples, analyzed using one-way ANOVA followed by Tukey's multiple comparisons test (B, C, E, G, O, R–U) or two-way ANOVA followed by Tukey's multiple comparisons test (A, D, F). (A, D, F) ∗P < 0.05, ∗∗P < 0.01, ∗∗∗P < 0.001, Scd1fl/fl + NAC versusScd1fl/fl + vehicle; #P < 0.05, ##P < 0.01, ###P < 0.001, Scd1ΔIE + vehicle versusScd1fl/fl + vehicle. (B, C, E, G, O, R–U) ∗P < 0.05, ∗∗P < 0.01, ∗∗∗P < 0.001 versus the Control. TBARS, thiobarbituric acid reactive substances.
Figure 5
Figure 5
Intestinal SCD1 loss-induced Mt1 upregulation contributed to the reduction of intestinal oxidative stress. (A–D) Mt1 mRNA (A), reactive oxygen species (ROS) level (B), malondialdehyde (MDA) level (C) and glutathione (GSH) level (D) in MC38 cells treated with BSA control vehicle (V), BSA-conjugated 0.2 mmol/L palmitic acid (PA), scramble shRNA (shCtrl) or Mt1-shRNA (shMt1) as indicated. Cells were pretreated with scramble shRNA or Mt1-shRNA for 24 h and then treated with V or PA for another 24 h; n = 3. (E–H) Mt1 mRNA (E), ROS levels (F), MDA levels (G) and GSH levels (H) in primary intestinal epithelial cells from Scd1fl/fl and Scd1ΔIE mice treated with shCtrl or shMt1 for 48h; n = 3. (I–L) Mt1 mRNA (I), ROS level (J), MDA level (K) and GSH level (L) in primary intestinal epithelial cells from Scd1fl/fl and Scd1ΔIE mice treated with BSA control vehicle (V), BSA-conjugated 0.2 mmol/L PA, control plasmid (Ctrl) or Mt1-overexpression plasmid (MT1) as indicated. Cells were pretreated with control plasmid or Mt1-overexpression plasmid for 48 h and then treated with V or PA for another 24 h; n = 3. All data are presented as the mean ± SEM of biologically independent samples, analyzed using one-way ANOVA followed by Tukey's multiple comparisons test. ∗P < 0.05, ∗∗P < 0.01, ∗∗∗P < 0.001 versus the Control. TBARS, thiobarbituric acid reactive substances. TBARS, thiobarbituric acid reactive substances.
Figure 6
Figure 6
Chemical SCD1 inhibition improved high-fat diet-induced obesity and hepatic steatosis depending on the presence of intestinal SCD1. (A) Body weight curve. (B) Liver weight. (C) Liver index. (D, E) Glucose tolerance test (GTT) (D) and quantitation of area under the curve (E). (F, G) Insulin tolerance test (ITT) (F) and quantitation of area under the curve (G). (H) Serum alanine aminotransferase (ALT). (I) Serum aspartate aminotransferase (AST). (J) Serum total cholesterol (TC). (K) Serum triglyceride (TG). (L) Serum non-esterified fatty acid (NEFA). (M) Liver TC. (N) Liver TG. (O) Liver NEFA. (P, Q) Representative hematoxylin and eosin staining (P) and oil red O staining (Q) of liver sections (n = 3 mice per group, three images per mouse per staining). Scale bar, 100 μm. (R–V) Mt1 mRNA (R), malondialdehyde (MDA) and glutathione (GSH) levels in the ileum (S, T) and the serum (U, V) of Scd1fl/fl and Scd1ΔIE mice fed a high-fat diet for 12 weeks. n = 5 for Scd1fl/fl with vehicle group, n = 8 for Scd1fl/fl with A939572 group, n = 6 for Scd1ΔIE with vehicle group, and n = 5 for Scd1ΔIE with A939572 group. All data are presented as the mean ± SEM of biologically independent samples, analyzed using one-way ANOVA followed by Tukey's multiple comparisons test (B, C, E, G–O, R–V) or two-way ANOVA followed by Tukey's multiple comparisons test (A, D, F). (A, D, F) ∗P < 0.05, ∗∗P < 0.01, Scd1fl/fl + A939572 versusScd1fl/fl + vehicle; #P < 0.05, ##P < 0.01, ###P < 0.001, Scd1ΔIE + vehicle versusScd1fl/fl + vehicle. (B, C, E, G–O, R–V) ∗P < 0.05, ∗∗P < 0.01, ∗∗∗P < 0.001 versus the Control. TBARS, thiobarbituric acid reactive substances.
Figure 7
Figure 7
Improvement of hepatic steatosis induced by high-fat diet was independent of hepatic SCD1 inhibition. Scd1fl/fl and Scd1ΔHep mice were administered vehicle or A939572 while maintained on high-fat diet for 12 weeks. (A) Body weight curves. (B) Liver weights. (C) Liver index. (D) Glucose tolerance test (GTT). (E) GTT area under the curve. (F) Insulin tolerance test (ITT). (G) ITT area under the curve. (H) Serum alanine aminotransferase (ALT). (I) Serum aspartate aminotransferase (AST). (J) Serum total cholesterol (TC). (K) Serum triglyceride (TG). (L) Serum non-esterified fatty acid (NEFA). (M) Hepatic TC. (N) Hepatic TG. (O) Hepatic NEFA. (P, Q) Representative hematoxylin and eosin staining (P) and oil red O staining (Q) of liver sections (n = 3 mice per group, three images per mouse per staining). Scale bar, 100 μm. n = 5 for Scd1fl/fl with vehicle group and Scd1fl/fl with A939572 group, respectively, n = 10 for Scd1ΔHep with vehicle group, and n = 8 for Scd1ΔHep with A939572 group. All data are presented as the mean ± SEM of biologically independent samples, analyzed using one-way ANOVA followed by Tukey's multiple comparisons test (B, C, E, G, O) or two-way ANOVA followed by Tukey's multiple comparisons test (A, D, F). (A, D, F) ∗/∗∗/∗∗∗P < 0.05/0.01/0.001, Scd1fl/fl + A939572 versusScd1fl/fl + vehicle; #/##P < 0.05/0.01, Scd1ΔHep + vehicle versus Scd1fl/fl + vehicle. (B, C, E, G, O) ∗P < 0.05, ∗∗P < 0.01, ∗∗∗P < 0.001 versus the Control.
Figure 8
Figure 8
Intestine-specific inducible Scd1 disruption ameliorated high-fat diet (HFD)-induced obesity and hepatic steatosis. Scd1fl/fl and Scd1ΔIE,ERT2 mice were first fed a high-fat diet (HFD) for 12 weeks and then injected weekly with tamoxifen while maintained on a HFD for another 12 weeks. (A) Experimental scheme. (B) final body weights. (C) Liver weights. (D) Liver index. (E) Glucose tolerance test (GTT). (F) GTT area under the curve. (G) Insulin tolerance test (ITT). (H) ITT area under the curve. (I) Serum alanine aminotransferase (ALT). (J) Serum aspartate aminotransferase (AST). (K) Serum total cholesterol (TC). (L) Serum triglyceride (TG). (M) Serum non-esterified fatty acid (NEFA). (N) Hepatic TC. (O) Hepatic TG. (P) Hepatic NEFA. n = 6. (Q, R) Representative hematoxylin and eosin staining (Q) and oil red O staining (R) of liver sections (n = 3 mice per group, three images per mouse per staining). Scale bar, 100 μm. (S, T) Scd1(S) and Mt1 (T) mRNA in the ileum of Scd1fl/fl and Scd1ΔIE, ERT2 mice (n = 6). All data are presented as the mean ± SEM of biologically independent samples, analyzed using one-way ANOVA followed by Tukey's multiple comparisons test, except that for E and G, two-way ANOVA followed by Tukey's multiple comparisons test was used. ∗P < 0.05, ∗∗P < 0.01, ∗∗∗P < 0.001, Scd1ΔIE,ERT2versus Scd1fl/fl.

References

    1. Bray G.A., Kim K.K., Wilding J.P.H. Obesity: a chronic relapsing progressive disease process. A position statement of the World Obesity Federation. Obes Rev. 2017;18:715–723. - PubMed
    1. Papamargaritis D., le Roux C.W., Holst J.J., Davies M.J. New therapies for obesity. Cardiovasc Res. 2024;119:2825–2842. - PMC - PubMed
    1. Haslam D.W., James W.P. Obesity. Lancet. 2005;366:1197–1209. - PubMed
    1. Friedman J.M. The discovery and development of GLP-1 based drugs that have revolutionized the treatment of obesity. Proc Natl Acad Sci U S A. 2024;121 - PMC - PubMed
    1. Nogueiras R., Nauck M.A., Tschop M.H. Gut hormone co-agonists for the treatment of obesity: from bench to bedside. Nat Metab. 2023;5:933–944. - PubMed

LinkOut - more resources