. 2025 Feb;15(2):1039-1055.
doi: 10.1016/j.apsb.2024.12.012. Epub 2024 Dec 16.

Deubiquitinase JOSD2 alleviates colitis by inhibiting inflammation via deubiquitination of IMPDH2 in macrophages

Affiliations

Deubiquitinase JOSD2 alleviates colitis by inhibiting inflammation via deubiquitination of IMPDH2 in macrophages

Xin Liu et al. Acta Pharm Sin B. 2025 Feb.

Abstract

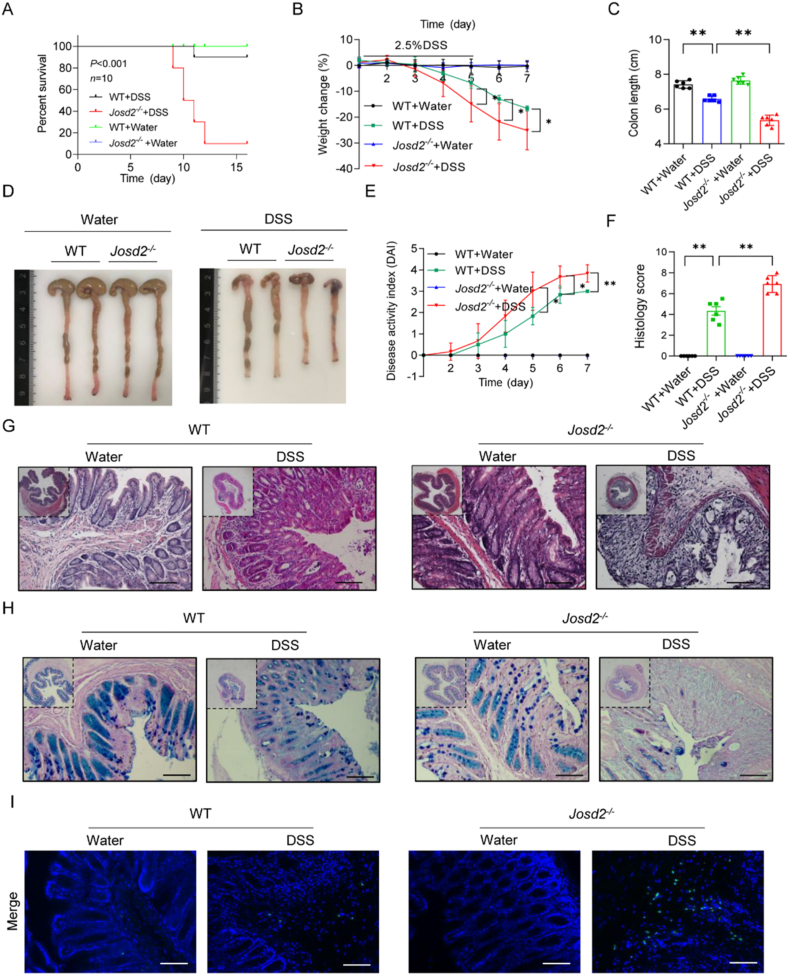
Inflammatory bowel disease (IBD) is a chronic inflammatory disorder of the gastrointestinal tract, which increases the incidence of colorectal cancer (CRC). In the pathophysiology of IBD, ubiquitination/deubiquitination plays a critical regulatory function. Josephin domain containing 2 (JOSD2), a deubiquitinating enzyme, controls cell proliferation and carcinogenesis. However, its role in IBD remains unknown. Colitis mice model developed by dextran sodium sulfate (DSS) or colon tissues from individuals with ulcerative colitis and Crohn's disease showed a significant upregulation of JOSD2 expression in the macrophages. JOSD2 deficiency exacerbated the phenotypes of DSS-induced colitis by enhancing colon inflammation. DSS-challenged mice with myeloid-specific JOSD2 deletion developed severe colitis after bone marrow transplantation. Mechanistically, JOSD2 binds to the C-terminal of inosine-5'-monophosphate dehydrogenase 2 (IMPDH2) and preferentially cleaves K63-linked polyubiquitin chains at the K134 site, suppressing IMPDH2 activity and preventing activation of nuclear factor kappa B (NF-κB) and inflammation in macrophages. It was also shown that JOSD2 knockout significantly exacerbated increased azoxymethane (AOM)/DSS-induced CRC, and AAV6-mediated JOSD2 overexpression in macrophages prevented the development of colitis in mice. These outcomes reveal a novel role for JOSD2 in colitis through deubiquitinating IMPDH2, suggesting that targeting JOSD2 is a potential strategy for treating IBD.

Keywords: Colitis; Deubiquitinase; IMPDH2; Inflammation; Inflammatory bowel disease; JOSD2; Macrophage; Nuclear factor kappa B.


Conflict of interest statement

The authors have declared that no conflict of interest exists.

Figures

Image 1
Graphical abstract
Figure 1
Figure 1
Increased JOSD2 expression in inflamed intestinal tissues from UC patients and mice with colitis. (A) mRNA levels of Josd2 in colon mucosal tissues of healthy controls and patients with active IBD (GSE179128). mRNA levels of Josd2 in colonic macrophage of normal controls and ulcerative colitis (UC) patients (GSE132141). (B) Representative images of H&E staining and immunohistochemical (IHC) staining of JOSD2 and CD68 in colon biopsy samples obtained from patients with UC, Crohn's disease (CD) and normal adjacent colon tissues obtained from colon cancer patients admitted for CRC surgery. Scale bar = 100 μm. (C) JOSD2 IHC score between the three groups is shown. (D) mRNA levels of Josd2, Josd1, ATXN3 in colon mucosal tissues of the control and DSS-induced colitis. (E) Representative images of H&E staining and IHC staining for JOSD2 and CD68 in the colonic samples from control and mice with DSS-induced colitis. Scale bar = 100 μm. (F) Immunoblot analysis of JOSD2 in the distal colons of the control and DSS-induced colitis. β-Actin was used as the loading control (n = 5). (G) Immunoblot analysis of JOSD2 in IEC and LPMC isolated from the control mice. β-Actin was used as the loading control. (H) Immunoblot analysis of JOSD2 in IECs and LPMCs isolated from the DSS-induced mice. β-Actin was used as the loading control (n = 3). (I) Immunoblot analysis of JOSD2 in LPMCs isolated from the controls and the DSS-induced mice. β-Actin was used as the loading control (n = 3). Statistical data are shown as mean ± SD; ∗∗∗P < 0.001.
Figure 2
Figure 2
JOSD2 deficiency exacerbates colonic injury induced by DSS-induced colitis. (A) Survival (Kaplan–Meier) curves (n = 10) of WT and Josd2−/− mice with 2.5% DSS-induced colitis. (B) Body weight change (n = 6) of WT and Josd2−/− mice with 2.5% DSS-induced colitis. Colon length (C) and representative images of colon tissues (D) from the indicated treatment groups on Day 7 after DSS treatment (n = 6). Disease activity index (E) and semi-quantitative scoring of histopathology on Day 7 after DSS administration (F) are shown (n = 6). Representative images of H&E (G) PAS/AB (H) and TUNEL (I) staining in cross-sections of distal colon tissues from WT and Josd2−/− mice on Day 7 after DSS administration. Scale bar = 100 μm. Statistical data are presented as mean ± SD. ∗P < 0.05, ∗∗P < 0.01.
Figure 3
Figure 3
JOSD2 deficiency increases the inflammatory infiltration and production of proinflammatory cytokines. (A) Representative images of F4/80 staining in cross-sections of distal colon from WT and Josd2−/− mice on Day 7 after DSS administration. Scale bar = 100 μm. (B) mRNA levels of the proinflammatory genes in colon sections from WT and Josd2−/− mice after DSS treatment (n = 5). (C) IL-6 and IL-1β levels in colon tissues from WT and Josd2−/− mice treated with 2.5% DSS were measured via ELISA (n = 6). (D) Representative Western blot analysis of total and phosphorylated p65 and IκBα in the colons of mice from the indicated groups. Glyceraldehyde-3-phosphate dehydrogenase (GAPDH) served as the loading control. Data are presented as mean ± SD. ∗P < 0.05, ∗∗P < 0.01, and ∗∗∗P < 0.001.
Figure 4
Figure 4
Deficiency of JOSD2 in myeloid cells exacerbates DSS-induced colitis. (A) Bone marrow derived macrophages (BMDMs) and colon tissues were obtained from chimeric mice 8 weeks after the transplantation of bone marrow cells. Levels of JOSD2 protein were probed through immunoblotting. β-Actin was used as the loading control. (B) Two groups of chimeric mice (WT→WT and KO→WT) generated by bone marrow transplantations were exposed to 2.5% DSS for 5 days and followed by 2 days regular drinking water, and body weight changes were daily monitored (n = 6). (C, D) Representative images of colons and colon length from the two groups on Day 7 after DSS treatment (n = 6). (E–H) Representative images of H&E (E) and PAS/AB staining (G) in distal colon cross-sections and semi-quantitative scoring of histopathology (F) and quantification of PAS/AB staining area (H) (n = 5–6), scale bar = 100 μm. (I, J) Representative images of TUNEL (I) and F4/80 staining (J) in distal colon cross-sections of chimeric mice described in D. (K) mRNA levels of the proinflammatory genes in colon sections from WT→WT and KO→WT mice after DSS treatment (n = 5). Data are presented as mean ± SD. ∗∗P < 0.01, and ∗∗∗P < 0.001.
Figure 5
Figure 5
JOSD2 directly interacts with IMPDH2. (A) Schematic of the experimental procedure used to identify the JOSD2 substrate screening. (B) Mass spectrum showing the structural diagram of the IMPDH2 protein. (C) Co-IP assays showed that JOSD2 interacted with IMPDH2 in HEK293T cells. Immunoprecipitations were performed using anti-FLAG magnetic beads. (D) Colocalization between JOSD2 and IMPDH2 was examined by fluorescence microscopy in HEK293T cells. (E) Immunoprecipitation analysis of the interaction of JOSD2 with IMPDH2 by anti-Flag magnetic beads or anti-HA magnetic beads, using GFP-IMPDH2-HA and JOSD2-Flag co-transfected into HEK293T cells. (F) Schematic diagram of IMPDH2 and its truncated mutants. (G) HA-tagged IMPDH2 or its truncated mutants transfected into HEK293T cells with Flag-tagged JOSD2. The cell lysates were immunoprecipitated with anti-HA magnetic beads and then immunoblotted with the indicated antibodies. (H) IP analysis of endogenous interaction of JOSD2 and IMPDH2 in LPS-stimulated BMDMs. For all immunoblot data, similar results were obtained from three independent experiments.
Figure 6
Figure 6
JOSD2 mediates K63-linked deubiquitination of IMPDH2 at K134. (A) Immunoblot analysis of the ubiquitination of IMPDH2 in HEK293T cells co-transfected with Ub-Myc, GFP-IMPDH2-HA together with JOSD2-Flag or JOSD2-C24A-Flag, followed by IP with anti-HA magnetic beads. Cells were pretreated with 10 μmol/L of MG132 for 6 h before harvesting. (B) Immunoblot analysis of the ubiquitination of IMPDH2 in HEK293T cells co-transfected with Ub-Myc, GFP-IMPDH2-HA and increasing concentrations of vectors for the JOSD2-Flag. Cells were pretreated with 10 μmol/L of MG132 for 6 h before harvesting. (C) Immunoblot analysis of the ubiquitination of IMPDH2 in HEK293T cells co-transfected with GFP-IMPDH2-HA, JOSD2-Flag, and various types of Ub-Myc including WT, K48-, and K63-linked ubiquitin chains for 24 h and then followed by IP with anti-HA magnetic beads. Cells were pretreated with 10 μmol/L of MG132 for 6 h before harvesting. (D) Immunoblot analysis of the ubiquitination of IMPDH2 in HEK293T cells co-transfected with GFP-IMPDH2-HA, JOSD2-Flag, Ub-K48-Myc or Ub-K48R-Myc, followed by IP with anti-HA magnetic beads. Cells were pretreated with 10 μmol/L of MG132 for 6 h before harvesting. (E) Immunoblot analysis of the ubiquitination of IMPDH2 in HEK293T cells co-transfected with Ub-Myc, JOSD2-HA and GFP-IMPDH2-HA WT, or the indicated mutants. For all immunoblot data, similar results were obtained from three independent experiments.
Figure 7
Figure 7
JOSD2 inhibits the activity of IMPDH2 and NF-B activity. (A) Immunoblot analysis of IMPDH2 in the distal colons of the control and DSS-treated mice. β-Actin was used as the loading control (n = 5). (B) Enzyme activity analysis and Western blot of IMPDH2 in HEK293T cells co-transfected with Ub-Myc, GFP-IMPDH2-HA and increasing concentrations of vectors for the JOSD2-Flag. Cells were pretreated with 10 μmol/L of MG132 for 6 h before harvesting. (C) BMDMs (1 × 106) from WT and Josd2−/− mice were treated with LPS (100 ng/mL) for 4 h. Messenger RNA levels of Il6, Il1b, and Ccl2 were measured (n = 3). (D) IL-6 and IL-1β levels in supernatants from WT and Josd2−/− BMDMs (1 × 106) treated with LPS (100 ng/mL) for 8 h (n = 4). (E) BMDMs were prepared from WT and Josd2−/− mice. Cells were treated with LPS (100 ng/mL) for 30 min. Lysates then were probed for activation of downstream NF-κB pathway proteins. Total proteins and GAPDH were used as control. (F) BMDMs were prepared from Josd2−/− mice. Cells were pretreated with 10 μmol/L IMPDH2 inhibitor mycophenolic acid (MPA) or DMSO for 4 h followed by treatment with LPS (100 ng/mL) for 30 min. Lysates then were probed for activation of downstream NF-κB pathway proteins. Total proteins and GAPDH were used as control. (G) Enzyme activity analysis of IMPDH2 in HEK293T cells co-transfected with Ub-Myc, GFP-IMPDH2-HA, GFP-IMPDH2-K134R-HA and JOSD2-Flag. Cells were pretreated with 10 μmol/L of MG132 for 6 h before harvesting (n = 4). (H) BMDMs (1 × 106) from WT mice were transfected with GFP-IMPDH2-HA or GFP-IMPDH2-K134R-HA expressing plasmid. Cells then were treated with LPS (100 ng/mL) for 4 h mRNA levels of Il6, Il1b, and Ccl2 were measured (n = 3). (I) IL-6 and IL-1β levels in supernatants from WT BMDMs (1 × 106) transfected with GFP-IMPDH2-HA or GFP-IMPDH2-K134R-HA expressing plasmid. Cells then were treated with LPS (100 ng/mL) for 8 h (n = 4). (J) BMDMs were prepared from WT mice. Cells were transfected with GFP-IMPDH2-HA or GFP-IMPDH2-K134R-HA expressing plasmid. Then were treated with LPS (100 ng/mL) for 30 min. Lysates then were probed for activation of downstream NF-κB pathway proteins. Total proteins and GAPDH were used as control. Data are presented as mean ± SD. ∗P < 0.05, ∗∗P < 0.01, and ∗∗∗P < 0.001.
Figure 8
Figure 8
Increased expression of JOSD2 in macrophages relieves experimental colitis in mice. (A, B) Weight change (A) and DAI (B) for AAV6-NC and AAV6-JOSD2 mice with DSS-induced colitis were assessed daily (n = 7). (C, D) Representative images of colons (C) and colon length (D) from the two groups on Day 7 after DSS treatment (n = 7). (E, F) Representative images of H&E (E) in distal colon cross-sections from AAV6-NC and AAV6-JOSD2 mice with DSS-induced colitis and semi-quantitative scoring of histopathology (F) (n = 5), scale bars = 100 μm. (G) Relative mRNA levels of inflammation-related genes (Il6, Il1b, Ccl2, Ccl3, and Ccl4) in the colons of mice from the AAV6-NC or AAV6-JOSD2-treated groups (n = 5). (H) Representative Western blots analysis of phosphorylated and total p65, and IκBα expression in the colons of AAV6-NC- or AAV6-JOSD2-injected DSS-induced mice. GAPDH served as the loading control (n = 3). Data are presented as the mean ± SD. ∗P < 0.05, ∗∗P < 0.01, and ∗∗∗P < 0.001.

References

    1. Sung H., Ferlay J., Siegel R.L., Laversanne M., Soerjomataram I., Jemal A., et al. Global cancer statistics 2020: GLOBOCAN estimates of incidence and mortality worldwide for 36 cancers in 185 countries. CA Cancer J Clin. 2021;71:209–249. - PubMed
    1. Siegel R.L., Miller K.D., Sauer A.G., Fedewa S.A., Butterly L.F., Anderson J.C., et al. Colorectal cancer statistics, 2020. CA Cancer J Clin. 2020;70:145–164. - PubMed
    1. Faye A.S., Holmer A.K., Axelrad J.E. Cancer in inflammatory bowel disease. Gastroenterol Clin North Am. 2022;51:649–666. - PubMed
    1. Parikh K., Antanaviciute A., Fawkner-Corbett D., Jagielowicz M., Aulicino A., Lagerholm C., et al. Colonic epithelial cell diversity in health and inflammatory bowel disease. Nature. 2019;567:49–55. - PubMed
    1. Wallace K.L., Zheng L.B., Kanazawa Y., Shih D.Q. Immunopathology of inflammatory bowel disease. World J Gastroenterol. 2014;20:6–21. - PMC - PubMed

LinkOut - more resources