. 2025 Jul 3;15(7):1484-1504.
doi: 10.1158/2159-8290.CD-24-1378.

Requirement for Cyclin D1 Underlies Cell-Autonomous HIF2 Dependence in Kidney Cancer

Affiliations

Requirement for Cyclin D1 Underlies Cell-Autonomous HIF2 Dependence in Kidney Cancer

Nitin H Shirole et al. Cancer Discov. .

Abstract

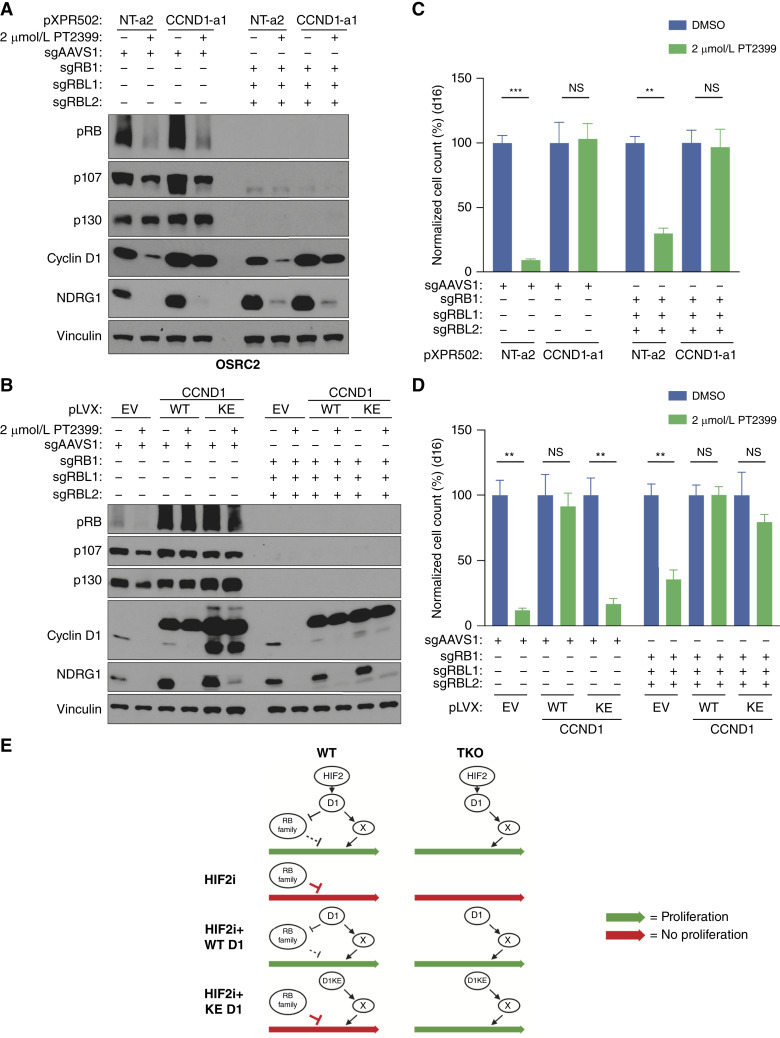
Inactivation of the VHL gene stabilizes HIF2α, which drives clear-cell renal cell carcinoma (ccRCC). The HIF2α inhibitor belzutifan is approved for ccRCC treatment, but de novo and acquired resistance are common. HIF2α, bound to ARNT, transcriptionally activates many genes. We performed CRISPR-mediated gene activation screens in HIF2α-dependent ccRCC lines treated with a belzutifan analog to identify HIF2α-responsive genes that confer cell-autonomous belzutifan resistance when not downregulated. Sustaining the expression of the HIF2α target gene CCND1, encoding cyclin D1, promoted HIF2α independence/belzutifan resistance. This activity requires CDK4/6 activation by cyclin D1 but is not solely due to phosphorylation of the canonical cyclin D1 target, pRB. Indeed, ccRCC lines lacking all three pRB family members remained at least partially HIF2α-dependent. In this context, however, a kinase-defective cyclin D1 variant partially overrode belzutifan's antiproliferative effects, suggesting that ccRCC promotion by cyclin D1 requires the phosphorylation of pRB paralogs and one or more kinase-independent cyclin D1 activities.

Significance: We discovered that cyclin D1 is the key target of HIF2 driving the cell-autonomous proliferation of VHL-mutant kidney cancers and that cyclin D1 has targets beyond pRB in this setting. These findings have implications for treating kidney cancer with HIF2 inhibitors, alone or in combination with CDK4/6 inhibitors.


Conflict of interest statement

J.G. Doench reports personal fees from Pfizer, Microsoft Research, BioNTech, and from Tango Therapeutics outside the submitted work. W.R. Sellers reports personal fees from Peleton Therapeutics and grants from Merck Pharmaceuticals during the conduct of the study, as well as grants from Pfizer Pharmaceuticals, Bristol Myers Squibb, Takeda Pharmaceuticals, Boehringer-Ingelheim, Calico Biosciences, and Ridgeline Discovery and personal fees from Redridge Bio and Delphia Therapeutics outside the submitted work. W.G. Kaelin reports grants from the NIH and grants and other support from Howard Hughes Medical Institute during the conduct of the study, as well as nonfinancial support and other support from Merck (including Belzutifan milestone payments), personal fees and other support from Nextech Invest, Lilly Pharmaceuticals, LifeMine Therapeutics, Circle Pharmaceuticals, and Tango Therapeutics, and personal fees from Casdin Capital, Arcus Biosciences, Red Tree Ventures, Fibrogen, and Regeneron Ventures outside the submitted work. No disclosures were reported by the other authors.

Figures

Figure 1.
Figure 1.
CRISPRa screens for modulators of ccRCC sensitivity to HIF2α inhibition. A, Immunoblot analysis of OSRC2 cells expressing dCas9-VP64 that were infected with indicated CRISPRa sgRNAs and treated with 2 μmol/L of the HIF2α inhibitor PT2399 or DMSO for 4 days. B, Schematic of CRISPRa screens performed in HIF2α-dependent ccRCC cells that were either infected with whole-genome or HIF2α subpool (see text) CRISPRa sgRNA libraries in the presence or absence of the 2 μmol/L PT2399. C, Volcano plots showing genes whose sgRNAs were enriched or depleted in DMSO d20 vs. d0 (left), PT2399 (PT) d20 vs. d0 (middle), and PT d20 vs. DMSO d20 (right) in OSRC2 cells expressing dCas9-VP64 that were infected with the whole-genome CRISPRa library. The top 15 genes based on the average FC (log 2) whose sgRNAs were enriched (blue) or depleted (red) are labeled. Arrowheads indicate the location of CCND1 on the volcano plots. n = 2 biological replicates. D, Scatterplots of genes whose sgRNAs were enriched in the PT2399 vs. DMSO arm of CRISPRa screens (x-axis) in OSRC2 cells compared with genes whose expression was downregulated by treatment with PT2399 for 24 hours (y-axis). Genes with CRISPRa average log2 FC > 0.5 and P value < 0.05 and RNA-seq average log2 FC < 0.5 and P value < 0.05 were labeled and colored purple. E, Scatterplots of genes whose sgRNAs were enriched in PT2399 vs. DMSO arm of CRISPRa screens (x-axis) in TUHR4TKB cells compared with genes whose expression was downregulated by treatment with PT2399 for 24 hours (y-axis). Genes with CRISPRa average log2 FC > 0.5 and P value < 0.05 and RNA-seq average log2 FC < 0.5 and P value < 0.05 were labeled and colored purple. F, Venn diagram of showing overlap between the genes from OSRC2 (D) and TUHR4TKB (E) cells. G, Volcano plots showing genes whose sgRNAs were enriched or depleted in DMSO d20 vs. d0 (left), PT2399 (PT) d20 vs. d0 (middle), and PT d20 vs. DMSO d20 (right) in OSRC2 cells expressing dCas9-VP64 that were infected with the HIF2α subpool CRISPRa library. The top 15 genes based on the average FC (log 2) whose sgRNAs were enriched (blue) or depleted (red) are labeled. Arrowheads indicate the location of CCND1 on the volcano plots. n = 2 biological replicates.
Figure 2.
Figure 2.
Failure to downregulate CCND1 confers resistance to HIF2α inhibition. A, Immunoblot analysis of OSRC2 cells expressing dCas9-VP64 that were infected with indicated CRISPRa sgRNAs and treated with 2 μmol/L PT2399 or DMSO for 4 days. B, Cellular proliferation assays of cells as in (A) that were treated with 2 μmol/L PT2399 or DMSO for 16 days. Data are the means ± SD of n = 3 biological replicates and are normalized to the DMSO-treated cells for each respective sgRNA. ***, P < 0.001, and NS (not significant), Unpaired t test. C, Immunoblot analysis of OSRC2 cells expressing dCas9-VP64 that were infected with indicated CRISPRa sgRNAs and subsequently nucleofected with RNPs containing Cas9 and either sgAAVS1 or sgHIF2α. D, Cellular proliferation assays of cells as in C. Data are the means ± SD of n = 3 biological replicates and are normalized to the sgAAVS1 cells for each of the respective CRISPRa sgRNAs. **, P < 0.01, and NS, unpaired t test. E, Immunoblot analysis of TUHR4TKB cells expressing dCas9-VP64 that were infected with indicated CRISPRa sgRNAs and treated with 2 μmol/L PT2399 or DMSO for 4 days. F, Cellular proliferation assays of cells as in (E) that were treated with 2 μmol/L PT2399 or DMSO for 16 days. Data are the means ± SD of n = 3 biological replicates and are normalized to the DMSO-treated cells for each respective sgRNA. **, P < 0.01, and NS, unpaired t test. G, Immunoblot analysis of TUHR4TKB cells expressing dCas9-VP64 that were infected with indicated CRISPRa sgRNAs and subsequently nucleofected with RNPs containing Cas9 and either sgAAVS1 or sgHIF2α. H, Cellular proliferation assays of cells as in G. Data are the means ± SD of n = 3 biological replicates and are normalized to the sgAAVS1 cells for each of the respective CRISPRa sgRNAs. ***, P < 0.001, and NS, unpaired t test.
Figure 3.
Figure 3.
Cyclin D1 kinase activity is required for cyclin D1 to confer HIF2α independence A, Immunoblot analysis of OSRC2 cells stably expressing cyclin D1 (WT or K112E) or the EV and treated with 2 μmol/L PT2399 or DMSO for 4 days. B, Cellular proliferation assays of cells as in (A) that were treated with 2 μmol/L PT2399 or DMSO for 16 days. Data are the means ± SD of n = 3 biological replicates and were normalized to the DMSO-treated cells for the respective cell lines (EV, WT, or KE). **, P < 0.01; ***, P < 0.001, and NS (not significant), unpaired t test. C, Immunoblot analysis of OSRC2 cells stably expressing cyclin D1 (WT or K112E) or the EV and subsequently nucleofected with RNPs containing Cas9 and either sgAAVS1 or sgHIF2α. D, Cellular proliferation assays of cells as in C. Data are the means ± SD of n = 3 biological replicates and were normalized to the sgAAVS1 cells for the respective cell lines (EV, WT, or KE). ***, P < 0.001, and NS, unpaired t test. E, Immunoblot analysis of TUHR4TKB cells stably expressing cyclin D1 (WT or K112E) or the EV and treated with 2 μmol/L PT2399 or DMSO for 4 days. F, Cellular proliferation assays of cells as in (E) that were treated with 2 μmol/L PT2399 or DMSO for 16 days. Data are the means ± SD of n = 3 biological replicates and were normalized to the DMSO-treated cells for the respective cell lines (EV, WT, or KE). **, P < 0.01, and NS, unpaired t test. G, Immunoblot analysis of TUHR4TKB cells stably expressing cyclin D1 (WT or K112E) or the EV and subsequently nucleofected with RNPs containing Cas9 and either sgAAVS1 or sgHIF2α. H, Cellular proliferation assays of cells as in G. Data are the means ± SD of n = 3 biological replicates and were normalized to the sgAAVS1 cells for the respective cell lines (EV, WT, or KE). ***, P < 0.001, and NS, unpaired t test.
Figure 4.
Figure 4.
Inactivation of pRB is not sufficient to confer HIF2α independence: potential roles of pRB paralogs as cyclin D1 targets. A, Immunoblot analysis of OSRC2 cells expressing dCas9-VP64 that were infected with indicated CRISPRa sgRNAs, nucleofected with RNPs containing Cas9 and either sgAAVS1 or sgRB1, and then treated with 2 μmol/L PT2399 or DMSO for 4 days. B, Cellular proliferation assays of cells as in (A) that were treated 2 μmol/L PT2399 or DMSO for 16 days. Data are the means ± SD of n = 3 biological replicates and were normalized to the DMSO-treated cells for the respective CRISPRa sgRNAs. *, P < 0.05; **, P < 0.01; and NS, unpaired t test. C, Immunoblot analysis of OSRC2 cells stably expressing cyclin D1 (WT or K112E) or the EV that were nucleofected with RNPs as in (A) and then treated with 2 μmol/L PT2399 or DMSO for 4 days. D, Cellular proliferation assays of cells as in (C) that were treated with 2 μmol/L PT2399 or DMSO for 16 days. Data are the means ± SD of n = 3 biological replicates and were normalized to the DMSO-treated cells for the respective cell lines (EV, WT, or KE). **, P < 0.01; ***, P < 0.001; and NS, unpaired t test. E, Immunoblot analysis of input (left) and anti-FLAG immunoprecipitates (right) from OSRC2 stably expressing cyclin D1 (WT or K112E) or the EV that were nucleofected with RNPs containing Cas9 and either sgAAVS1 or sgRB1. The cells were then treated with 2 μmol/L palbociclib or DMSO, where indicated, for 16 hours to promote substrate-trapping. NS, not significant; phospho = phosphorylated.
Figure 5.
Figure 5.
Cyclin D1 kinase activity is dispensable for cyclin D1 to confer HIF2α independence in the cells lacking all three pRB paralogs. A, Immunoblot analysis of OSRC2 cells expressing dCas9-VP64 that were infected with indicated CRISPRa sgRNAs, nucleofected with RNPs containing Cas9 and the indicated sgRNAs, and then treated with 2 μmol/L PT2399 or DMSO for 4 days. B, Immunoblot analysis of OSRC2 cells stably expressing cyclin D1 (WT or K112E) or the EV that were nucleofected with RNPs containing Cas9 and the indicated sgRNAs and then treated with 2 μmol/L PT2399 or DMSO for 4 days. C, Cellular proliferation assays of cells as in (A) that were treated with 2 μmol/L PT2399 or DMSO for 16 days. Data are the means ± SD of n = 3 biological replicates and were normalized to the DMSO-treated cells for the respective CRISPRa sgRNAs. **, P < 0.01; ***, P < 0.001; and NS, unpaired t test. D, Cellular proliferation assays of cells as in (B) that were treated with 2 μmol/L PT2399 or DMSO for 16 days. Data are the means ± SD of n = 3 biological replicates and were normalized to the DMSO-treated cells for the respective cell lines (EV, WT, or KE). **, P < 0.01, and NS, unpaired t test. E, Model for unmasking of kinase-independent cyclin D1 activities in cells lacking all three RB family members. NS, not significant.
Figure 6.
Figure 6.
Failure to downregulate VEGFA and CCND1 confers resistance to PT2399 in vivo. A, VEGFA levels from conditioned media of 786-O cells that stably express firefly luciferase, dCas9-VP64, and the indicated CRISPRa sgRNAs after treatment with 2 μmol/L PT2399 or DMSO for 48 hours. The VEGF levels were normalized to the NT-a2 expressing cells treated with DMSO. Data are the means ± SD of n = 3 biological replicates. **, P < 0.01, and NS, unpaired t test. B, Cellular proliferation assays of 786-O cells that stably express firefly luciferase, dCas9-VP64, CRISPRa sgRNA VEGFA-a1, and either cyclin D1 (WT) or the EV. The cells were treated with 2 μmol/L PT2399 or DMSO for 16 days. Data are the means ± SD of n = 3 biological replicates and were normalized to the DMSO-treated cells for the respective cell lines (EV or WT). *, P < 0.05; ***, P < 0.001; unpaired t test. C, Immunoblot analysis of orthotopic xenografts formed by cells from (B) that were treated with PT2399 (30 mg/kg) or vehicle daily for 5 days by oral gavage. D, Average relative BLI intensity over time of orthotopic xenografts formed by cells from (B) that were treated with PT2399 (30 mg/kg) or vehicle daily for 28 days by oral gavage. For each mouse, BLI readings were normalized to the BLI value from the day the treatment was started. Data are the mean ± SEM from three independent experiments. ***, P < 0.001, and NS, two-way ANOVA. E and F, Kaplan–Meier survival curves for mice in D. Rx bar indicates length of treatment. Log-rank (Mantel–Cox) test, with indicated P values. NS, not significant.
Figure 7.
Figure 7.
High cyclin D2 expression as a potential cause of in vitro HIF2 independence. A, Immunoblot analysis of indicated ccRCC cell lines that were treated with 2 μmol/L PT2399 or DMSO for 4 days. B, Immunoblot analysis of OSRC2 cells stably expressing cyclin D2 (WT or K111E) or the EV and treated with 2 μmol/L PT2399 or DMSO for 4 days. C, Cellular proliferation assays of cells as in (B) that were treated with 2 μmol/L PT2399 or DMSO for 16 days. Data are the means ± SD of n = 3 biological replicates and were normalized to the DMSO-treated cells for the respective cell lines (EV, WT, or KE). **, P < 0.01; ***, P < 0.001; NS, unpaired t test. D, Immunoblot analysis of A704 cells that underwent CRISPR editing with the indicated CRISPRko sgRNAs and were then treated with 2 μmol/L PT2399 or DMSO for 4 days. E, Cellular proliferation assays of cells as in (D) that were treated with 2 μmol/L PT2399 or DMSO for 16 days. Data are the means ± SD of n = 3 biological replicates and were normalized to the DMSO-treated cells for each respective sgRNA. *, P < 0.05, and NS, unpaired t test. NS, not significant; phospho = phosphorylated.

References

    1. Maher ER, Kaelin WG Jr. von Hippel-Lindau disease. Medicine (Baltimore) 1997;76:381–91. - PubMed
    1. Kim WY, Kaelin WG. Role of VHL gene mutation in human cancer. J Clin Oncol 2004;22:4991–5004. - PubMed
    1. Kaelin WG Jr. Von Hippel-Lindau disease: insights into oxygen sensing, protein degradation, and cancer. J Clin Invest 2022;132:e162480. - PMC - PubMed
    1. Sato Y, Yoshizato T, Shiraishi Y, Maekawa S, Okuno Y, Kamura T, et al. Integrated molecular analysis of clear-cell renal cell carcinoma. Nat Genet 2013;45:860–7. - PubMed
    1. Choueiri TK, Kaelin WG Jr. Targeting the HIF2-VEGF axis in renal cell carcinoma. Nat Med 2020;26:1519–30. - PubMed

MeSH terms

Substances