Comparative Study
. 2025 Apr;93(2):278-291.
doi: 10.1007/s00239-025-10245-9. Epub 2025 Apr 3.

Comparative Analysis of Drosophila Bam and Bgcn Sequences and Predicted Protein Structural Evolution

Affiliations
Comparative Study

Comparative Analysis of Drosophila Bam and Bgcn Sequences and Predicted Protein Structural Evolution

Luke R Arnce et al. J Mol Evol. 2025 Apr.

Abstract

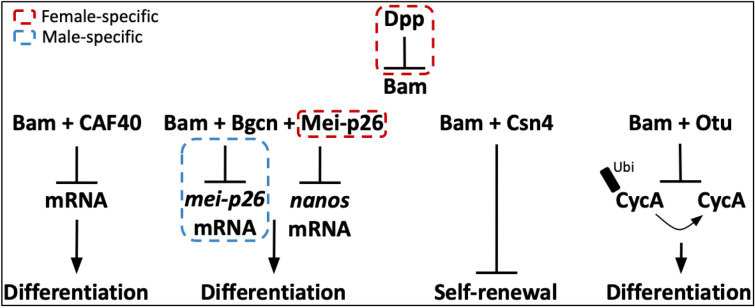
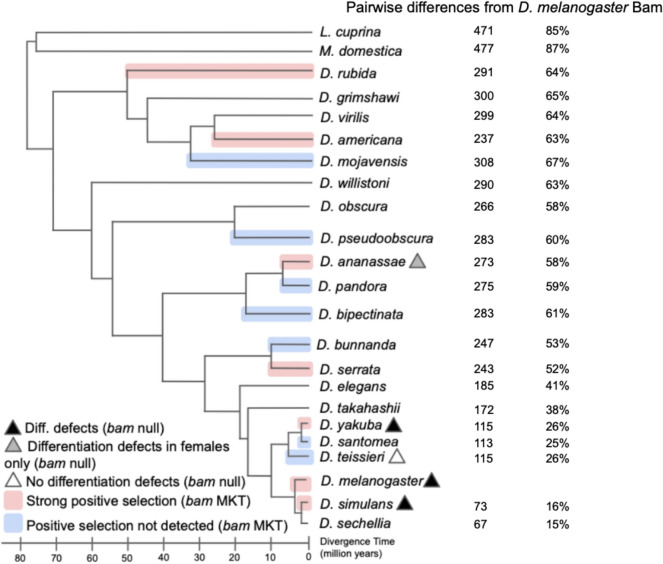
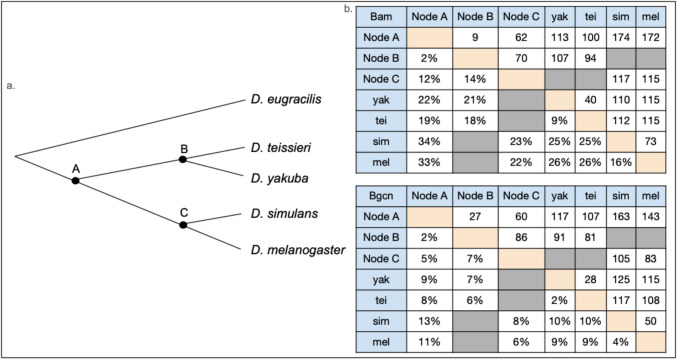
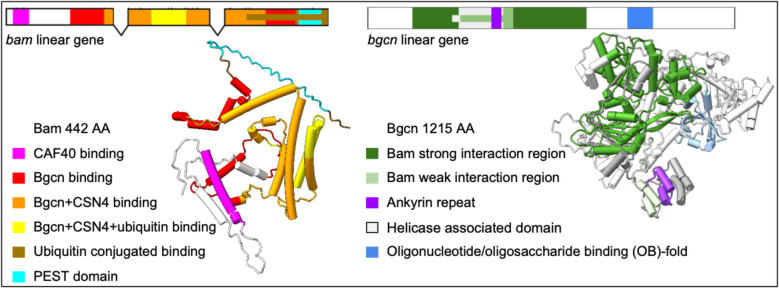
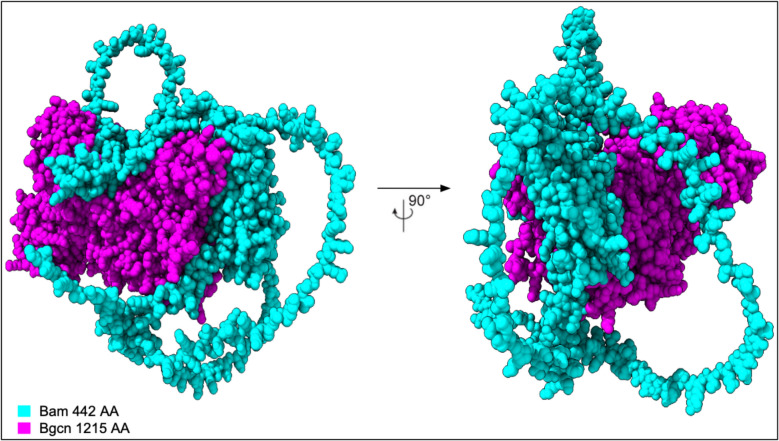
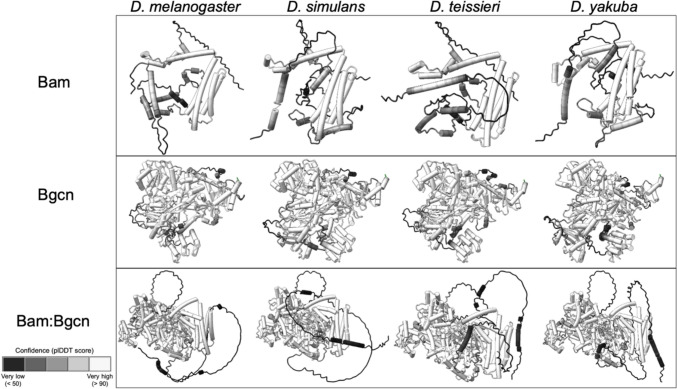
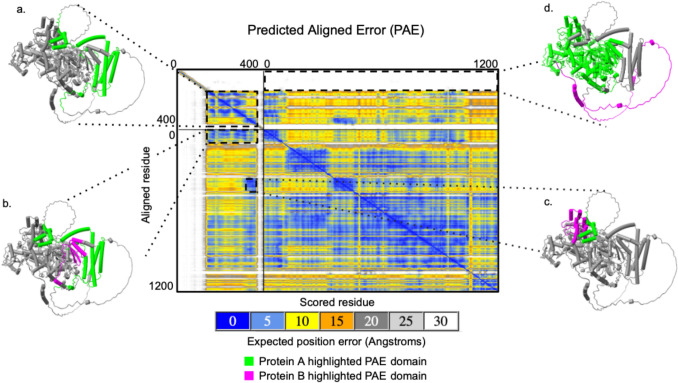
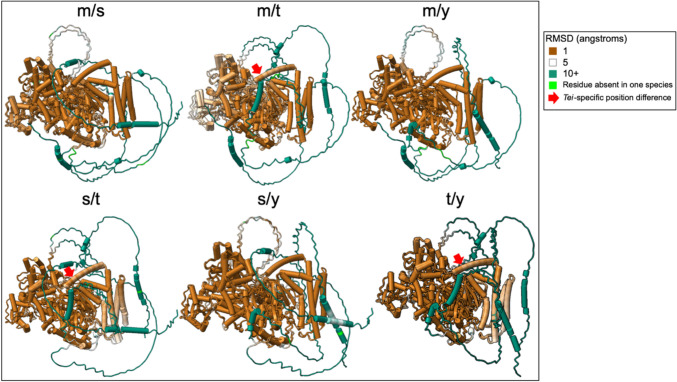
The protein encoded by the Drosophila melanogaster gene bag of marbles (bam) plays an essential role in early gametogenesis by complexing with the gene product of benign gonial cell neoplasm (bgcn) to promote germline stem cell daughter differentiation in males and females. Here, we compared the AlphaFold2 and AlphaFold Multimer predicted structures of Bam protein and the Bam:Bgcn protein complex between D. melanogaster, D. simulans, and D. yakuba, where bam is necessary in gametogenesis to that in D. teissieri, where it is not. Despite significant sequence divergence, we find very little evidence of significant structural differences in high confidence regions of the structures across the four species. This suggests that Bam structure is unlikely to be a direct cause of its functional differences between species and that Bam may simply not be integrated in an essential manner for GSC differentiation in D. teissieri. Patterns of positive selection and significant amino acid diversification across species is consistent with the Selection, Pleiotropy, and Compensation (SPC) model, where detected selection at bam is consistent with adaptive change in one major trait followed by positively selected compensatory changes for pleiotropic effects (in this case perhaps preserving structure). In the case of bam, we suggest that the major trait could be genetic interaction with the endosymbiotic bacteria Wolbachia pipientis. Following up on detected signals of positive selection and comparative structural analysis could provide insight into the distribution of a primary adaptive change versus compensatory changes following a primary change.

Keywords: Bam; Bgcn; AlphaFold; Orthologs; Protein structure; Reproduction.


Figures

Fig. 1
Fig. 1
Key interactions for bam’s essential GSC differentiation function in D. melanogaster. Male and female-specific components or interactions are bordered in blue and red, respectively. The arrows indicate promotion and the flat lines indicate inhibition. The black rectangle labeled Ubi denotes ubiquitinated CycA
Fig. 2
Fig. 2
Heterogeneous signals of positive selection and function in germline differentiation at bam inferred by the McDonald-Kreitman Test (MKT) and phenotypic assessment of bam null alleles across the Drosophila genus (Bubnell et al. 2022). Functional analysis of bam null mutants shows a range of differentiation defects with defects in D. simulans, D. melanogaster, and D. yakuba, differentiation defects in females only in D. ananassae, and no differentiation defects in both males and females in D. teissieri, demonstrating functional differences for bam across species. Pairwise amino acid differences from D. melanogaster Bam to other Drosophila and outgroup species show divergence ranging from 15% in the closely related D. sechellia, to 87% in the outgroup species M. domestica. Note that in pairwise alignments to outgroup species, pairwise differences are able to exceed 442 residues because the Bam protein in these species is comparatively larger than in D. melanogaster
Fig. 3
Fig. 3
a Cladogram of Drosophila species evaluated and outgroup (D. eugracilis) in this study and nodes with estimated ancestral amino acid sequences indicated as A, B, and C. b Table of pairwise Bam and Bgcn amino acid sequence differences as raw numbers and percentages for D. yakuba, D. teissieri, D. simulans, D. melanogaster, and ancestral sequences A, B, and C
Fig. 4
Fig. 4
Predicted structures for D. melanogaster Bam and Bgcn with color-coded labels for their functional and binding regions
Fig. 5
Fig. 5
Space-filling predicted structure of the D. melanogaster Bam:Bgcn protein complex
Fig. 6
Fig. 6
plDDT confidence scores for Bam, Bgcn, and Bam:Bgcn complex predicted structures for D. melanogaster, D. simulans, D. teissieri, and D. yakuba
Fig. 7
Fig. 7
Predicted aligned error (PAE) plot for Bam:Bgcn complex residues in D. melanogaster. Lime green and magenta colors on the predicted structures are used to indicate whether the highlighted residues and PAE values are from one protein (Bam or Bgcn in lime green) or residues and PAE values across two proteins (Bam and Bgcn in lime green and magenta). a. Region with relatively low predicted error scores that highlight residues within Bam in which AlphaFold is confident in their relative positions. b and c. Regions with low predicted error scores that highlight residues from Bam and Bgcn in which AlphaFold is confident in their relative positions across proteins. d Region with high predicted error scores that highlight residues from Bam and Bgcn in which AlphaFold is not confident in their relative positions across proteins (Color figure online)
Fig. 8
Fig. 8
Paired structural alignments for Bam:Bgcn complex with D. melanogaster, D. simulans, D. teissieri, and D. yakuba indicated as m, s, t, and y, respectively. The root mean square difference (RMSD) highlights the distance in angstroms between aligned species-specific residues. D. teissieri-specific residues with positional differences are highlighted with arrows
Fig. 9
Fig. 9
Bam and Bgcn linear amino acid sequence identity for D. yakuba, D. teissieri, D. simulans, and D. melanogaster aligned to the node A ancestral sequences with colored Bam and Bgcn binding regions. Level of per-residue conservation to the node A ancestral sequences is represented from no conservation as a light gray to total conservation in all included species as a thick black bar. Gaps are represented by a thin, gray line. The percent amino acid identity across species is represented below from red as the lowest % identity to green as 100% amino acid identity across included sequences with yellow bars of varying heights as intermediate values. Gaps are represented by a thin black line. Bam and Bgcn binding regions as determined in D. melanogaster are highlighted below linear alignments in colors specified in the key (Color figure online)

Update of

Similar articles

Cited by

References

    1. Baatz M, Wagner G (1997) Adaptive inertia caused by hidden pleiotropic effects. Theor Popul Biol 51:49–66. 10.1006/tpbi.1997.1294
    1. Bauer DuMont VL, Flores HA, Wright MH, Aquadro CF (2007) Recurrent positive selection at Bgcn, a key determinant of germ line differentiation, does not appear to be driven by simple coevolution with its partner protein bam. Mol Biol Evol 24(1):182–191. 10.1093/molbev/msl141 - PubMed
    1. Bubnell JE, Ulbing C, Begne PF, Aquadro CF (2022) Functional divergence of the bag-of-marbles gene in the Drosophila melanogaster species group. Mol Biol Evol. 39(7):msac137. 10.1093/molbev/msac137 - PMC - PubMed
    1. Camacho C, Coulouris G, Avagyan V, Ma N, Papadopoulos J, Bealer K, Madden TL (2009) BLAST+: architecture and applications. BMC Bioinf 10:421. 10.1186/1471-2105-10-421 - PMC - PubMed
    1. Carugo O (2023) pLDDT values in AlphaFold2 protein models are unrelated to globular protein; ocal flexibility. Crystals 13(11):1560. 10.3390/cryst13111560

Publication types

Substances

LinkOut - more resources