. 2025 Apr 3;145(14):1536-1552.
doi: 10.1182/blood.2023022197.

Dissection of single-cell landscapes for the development of chimeric antigen receptor T cells in Hodgkin lymphoma

Affiliations

Dissection of single-cell landscapes for the development of chimeric antigen receptor T cells in Hodgkin lymphoma

Adrian Gottschlich et al. Blood. .

Abstract

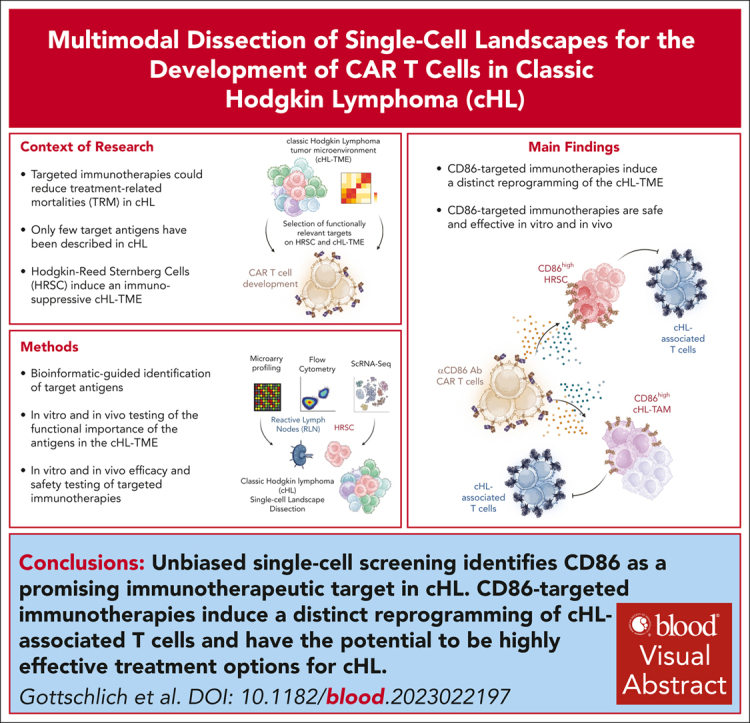
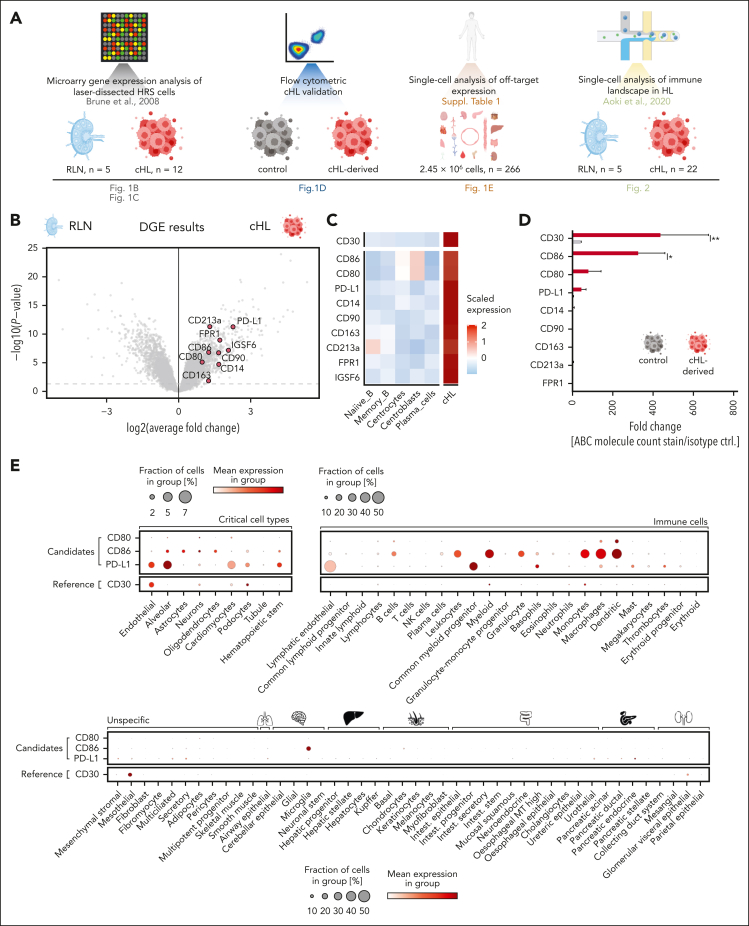
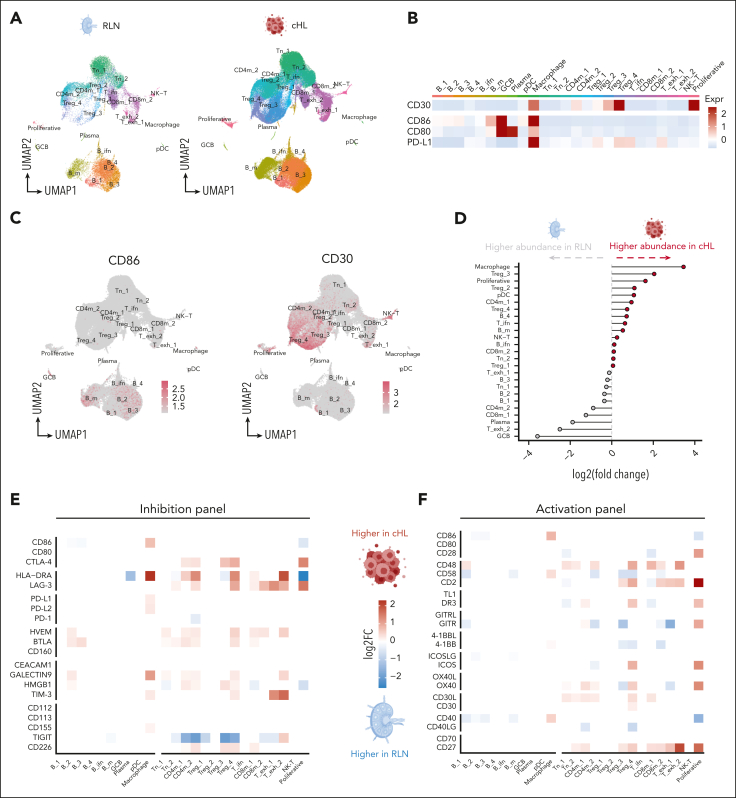
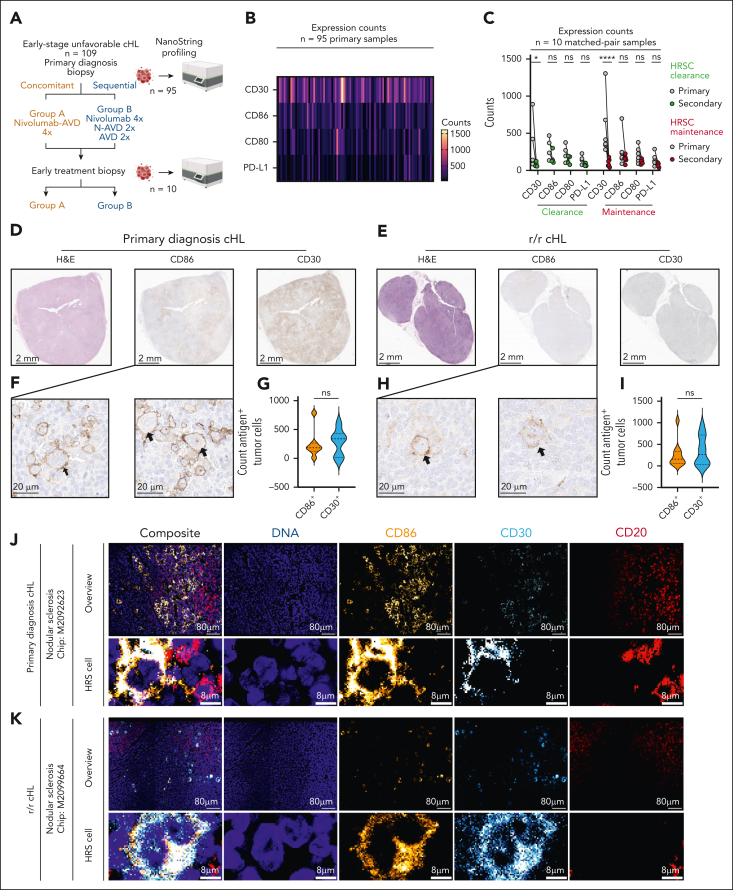
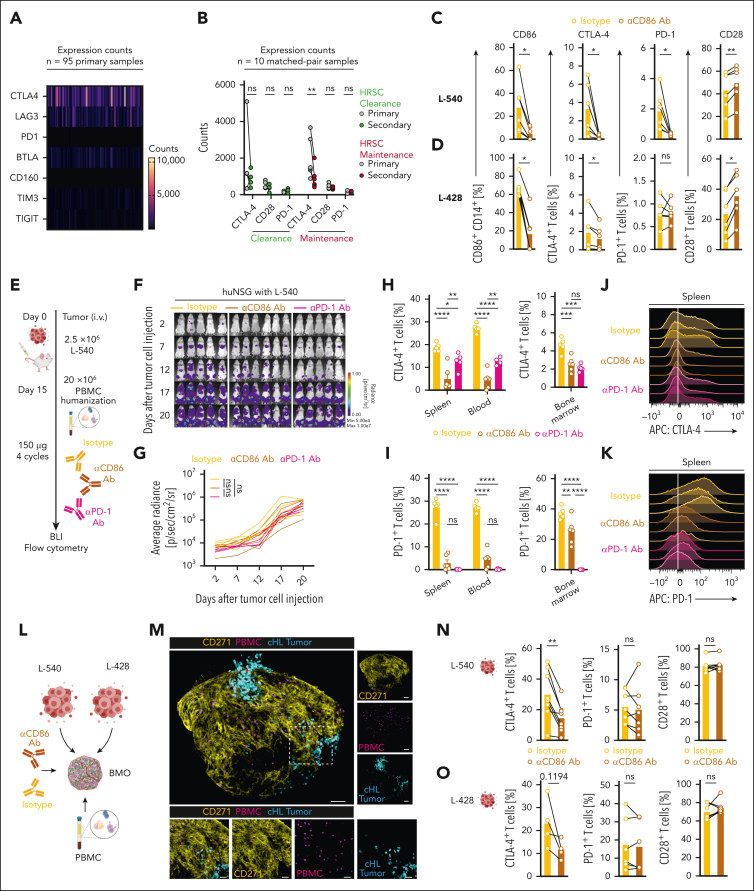
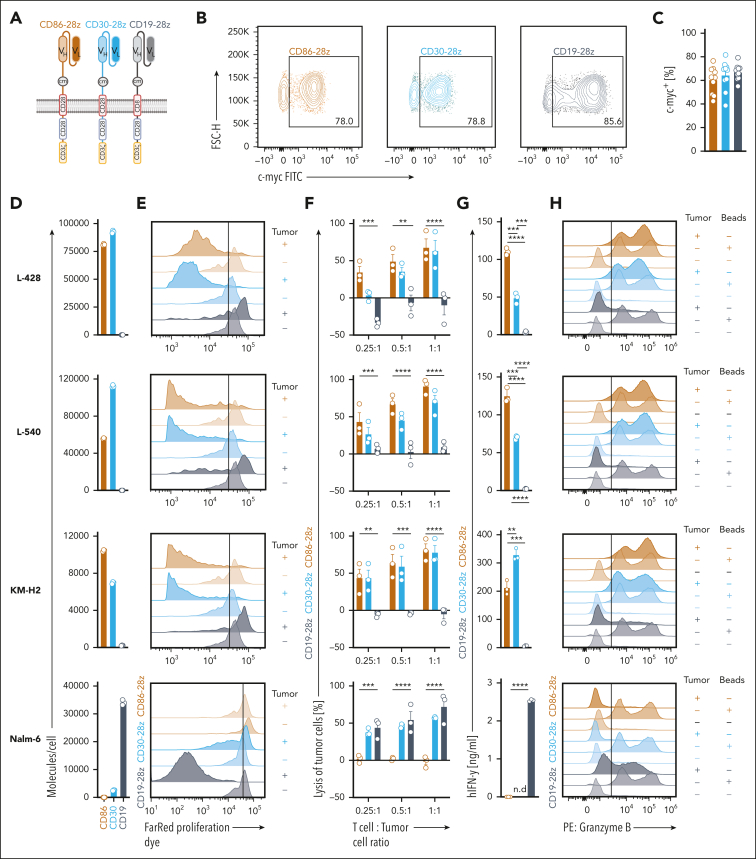
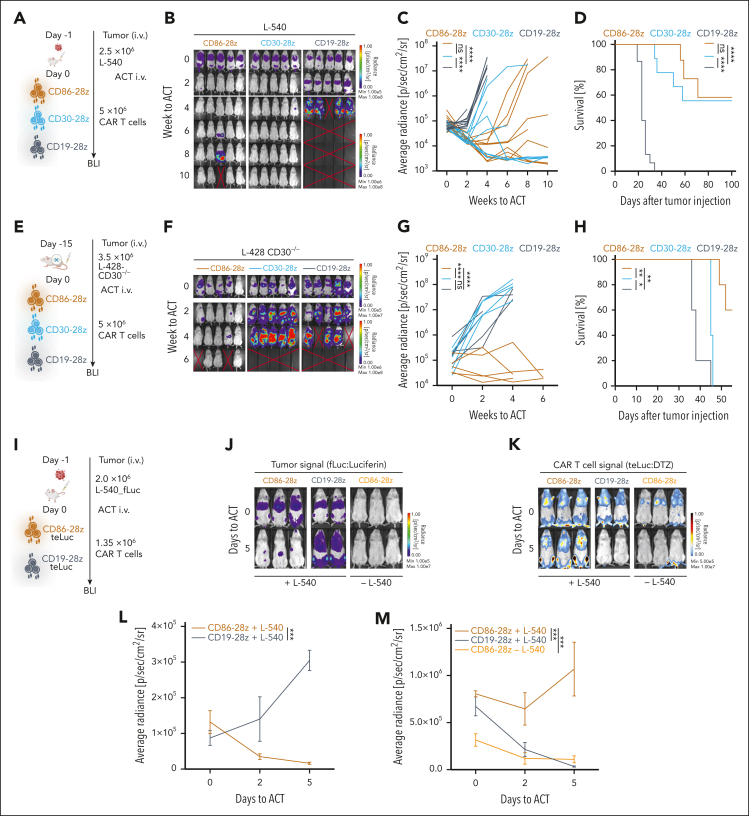
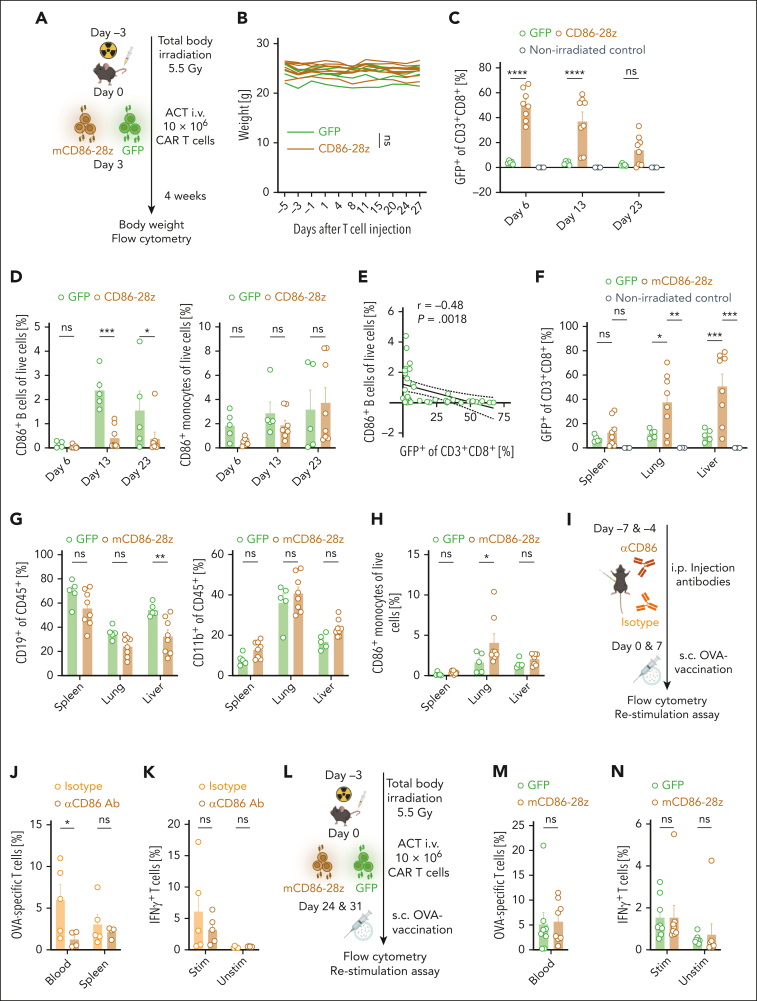
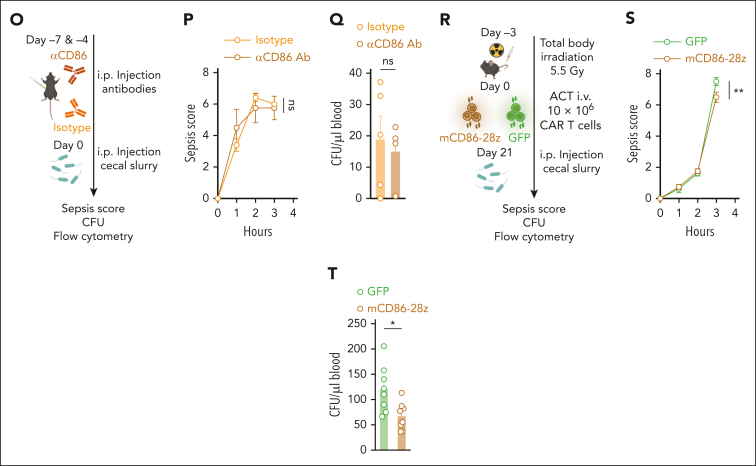
The success of targeted therapies for hematological malignancies has heralded their potential as both salvage treatment and early treatment lines, reducing the need for high-dose, intensive, and often toxic chemotherapeutic regimens. For young patients with classic Hodgkin lymphoma (cHL), immunotherapies provide the possibility to lessen long-term, treatment-related toxicities. However, suitable therapeutic targets are lacking. By integrating single-cell dissection of the tumor landscape and an in-depth, single-cell-based off-tumor antigen prediction, we identify CD86 as a promising therapeutic target in cHL. CD86 is highly expressed on Hodgkin and Reed-Sternberg cancer cells and cHL-specific tumor-associated macrophages. We reveal CD86-CTLA-4 as a key suppressive pathway in cHL, driving T-cell exhaustion. Cellular therapies targeting CD86 had extraordinary efficacy in vitro and in vivo and were safe in immunocompetent mouse models without compromising bacterial host defense in sepsis models. Our results prove the potential value of anti-CD86 immunotherapies for treating cHL.


Conflict of interest statement

Conflict-of-interest disclosure: A.G., M. Thomas, R.G., S.E., C.M., and S.K. submitted patent applications related to this work filed by Ludwig Maximilians Universität München, the University Hospital of LMU Munich, or the Helmholtz Centre Munich. S.K. has received honoraria from Cymab, Plectonic, TCR2 Inc, Novartis, Bristol Myers Squibb, Miltenyi, and GlaxoSmithKline. S.K. and S.E. are inventors of several patents in the field of immunooncology. S.K. and S.E. received license fees from TCR2 Inc and Carina Biotech. A.G. received research support from Tabby Therapeutics and Plectonic for work unrelated to the manuscript. P.J.B. reports advisory roles for Hexal, Merck Sharp & Dohme, Need Inc, Stemline, and Takeda; holds stock options in Need Inc; has received honoraria from AstraZeneca, BeiGene, Bristol Myers Squibb/Celgene, Lilly, Merck Sharp & Dohme, Need Inc, Stemline, and Takeda; and has received research funding from BeiGene (Institution), Bristol Myers Squibb (Institution), Merck Sharp & Dohme (Institution), and Takeda (Institution); all unrelated to the manuscript. S.K. and S.E. received research support from TCR2 Inc, Plectonic GmBH, CatalYm GmBH, and Arcus Bioscience for work unrelated to the manuscript. S.F.-W. and C.K. are inventors on a patent application covering bone marrow organoids (WO2023/194370A1). The remaining authors declare no competing financial interests.

Figures

None
Graphical abstract
Figure 1.
Figure 1.
Identification of CD80, CD86, and PD-L1 as potential therapeutic targets in cHL. (A) Schematic overview of components of the used multimodal target screening approach in cHL. (B) Volcano plot illustrating the log2 average fold change and P values of surface antigens absent on T cells and differentially overexpressed on HRSCs compared with GCB. Microarray data (GSE12453) were obtained from the gene expression omnibus (cHL, n = 12; RLN, n = 5). Labeled genes in red passed all filters (surface expression, absent on T cells), whereas non-highlighted gray dots indicate overexpressed genes that did not pass the filter thresholds. (C) Heat map visualizing the expression of the identified target antigens on microdissected control cells (left) or HRSCs (right). (D) Comparison of absolute densities of indicated antigens measured using flow cytometry on a panel of cHL cell lines (L-428, L-540, KM-H2) with that of the control cell line Nalm-6. Plotted is the pooled fold change ± standard error of the mean (SEM) of absolute molecule count in comparison to an isotype control stain of 3 different cHL cell lines. Statistical significance was calculated using 2-way analysis of variance (ANOVA) with Sidak multiple comparison correction. ∗P < .05; ∗∗P < .01; ∗∗∗P < .001; ∗∗∗∗P < .0001. ns, P > .05. (E) Single-cell cross-organ off-target transcriptomic atlas screening for CD80, CD86, PD-L1, and CD30. The transcriptomic atlas consists of a total of 2.5 million sequenced cells comprising 11 different organs. A detailed summary of all used data sets is provided in the supplementary Material.
Figure 2.
Figure 2.
scRNA-seq reveals dysregulated immunomodulatory pathways in cHL. (A) Uniform manifold approximation and projection (UMAP) visualization of the obtained cell clusters in RLN (left) or cHL (right). The data set was generated by Aoki et al and downloaded from the European genome-phenome archive (cHL, n = 22; RLN, n = 5; 127 686 sequenced cells). (B) Heat map visualization of the scaled averaged gene expression of CD30 vs CD86, CD80, and PD-L1 measured by scRNA-seq. (C) UMAP plots visualizing the expression of CD86 (left) or CD30 (right) on the respective cell clusters. (D) Fold changes based on the differential abundance of the respective cell cluster between RLN (left) and cHL (right). (E-F) Heat map illustrating significantly upregulated genes of hallmark immune inhibitory pathways (E) and activating pathways (F) in cHL (red) or RLN (blue) as the result of DGE analysis within each cell subset. Markers were adapted from Chen and Flies with permission.
Figure 3.
Figure 3.
CD86 is highly expressed in primary diagnosis and R/R cHL. (A) Summary of treatment schedules and cohort distribution of the NIVHAL trial. (B) Heat map illustrating expression of reference control gene CD30 or candidate antigens CD86, CD80, and PD-L1 in the NIVHAL cohort (n = 95 primary diagnosis samples). Each line represents 1 patient. (C) Change of target antigen expression between primary (gray) and secondary (light green, red) biopsies after NIVHAL trial first-line therapy. Treatment response was evaluated by a board-certified pathologist and classified into HRSC clearance (light green, n = 4 primary patient samples) or HRSC maintenance (red, n = 6 primary patient samples). Statistical significance was calculated using 2-way ANOVA with Sidak multiple comparison correction. (D-E) H&E (left) or immunohistochemical staining of CD86 (middle) in comparison to CD30 (right) in primary cHL tissue. (D,F,G) Primary diagnosis cHL samples. n = 7 different patients. (E,H-I) R/R cHL samples. n = 10 different patients. (F,H) Representative images of CD86+ HRSCs. Arrowheads indicate HRSCs. (G,I) Count of CD86+ or CD30+ HRSCs in primary diagnosis cHL samples (G) or R/R cHL (I) quantified by machine learning classifier. Statistical significance was calculated using unpaired t test. (J-K) Expression of CD86 on HRSCs measured by multiplex immunofluorescence microscopy on chip-loaded primary diagnosis cHL samples (J) or R/R cHL (K). Chips were sequentially stained with antibodies against CD86 (yellow), CD30 (blue), and CD20 (red) and with a DNA Hoechst stain (blue). Between each staining step, images were acquired with a fluorescence microscope followed by a 30-second photobleaching procedure. For all panels: ∗P < .05; ∗∗P < .01; ∗∗∗P < .001; ∗∗∗∗P < .0001. ns, P > .05.
Figure 4.
Figure 4.
CD86 blockade reduces expression of inhibitory cell surface markers PD-1 and CTLA-4 on cHL-associated T cells. (A) Heat map illustrating expression of inhibitory signaling molecules of the NIVHAL cohort (n = 95 primary diagnosis samples). Each line represents 1 patient. (B) Change of inhibitory signaling molecules between primary (gray) and secondary (red) biopsies. Treatment response was evaluated by a board-certified pathologist and classified into HRSC clearance (light green, n = 4) or HRSC maintenance (red, n = 6). Statistical significance was calculated using 2-way ANOVA with Sidak multiple comparison correction. (C-D) Expression of indicated antigens on either CD14+ monocytes (left, CD86) or CD3+ T cells (middle left, CTLA-4; middle right, PD-1; right, CD28) measured by flow cytometry. cHL cell lines (L-540, C; L-428, D) and PBMCs were cocultured with either αCD86 antibody (mustard) or isotype control antibody (yellow). Data are mean ± SEM from 6 independent donors. Statistical significance was calculated using Wilcoxon signed rank test. (E) Summary of the treatment schedule used for humanized L-540 xenograft in vivo experiments. (F-G) BLI images (F) and fLuc-BLI–based quantification of tumor burden (G) of L-540 tumor-bearing mice injected with human PBMCs and treated with αCD86 antibody (mustard), isotype control antibody (yellow), or αPD-1 antibody (magenta). (H-I) Flow cytometric quantification of CTLA-4 (H) or PD-1 expression (I) in different organs on CD3+ T cells in different organs. There were 5 to 6 mice per group. Statistical significance was calculated using 2-way ANOVA with Tukey multiple comparison correction. (J-K) Representative histograms illustrating expression of CTLA-4 (J) or PD-1 (K) on CD3+ T cells in the spleen. (L) Overview of experimental scheme used to induce CD86 blockade in complex BMO. (M) Representative confocal images of cHL-PBMC-BMO cocultures. Yellow: mesenchymal tissue (CD271); violet: PBMC; turquoise: cHL tumor cells. Magnified images of the rectangle area are depicted at the bottom. (N-O) Expression of indicated antigens on CD3+ T cells (left, CTLA-4; middle PD-1; right CD28) in coculture with L-540 (N) or L-428 (O) cHL tumor cell lines measured by flow cytometry. cHL cell lines and BMO were cocultured either with αCD86 antibody or isotype control antibody. Data are mean ± SEM from n = 4-8 independent donors and BMO. Scale bar in panel M 100 µm (top), 30 µm (bottom). Statistical significance was calculated using Wilcoxon signed rank test. For all panels: ∗P < .05; ∗∗P < .01; ∗∗∗P < .001; ∗∗∗∗P < .0001. ns, P > .05.
Figure 5.
Figure 5.
CD86-28z CAR T cells exhibit high potency toward cHL cell lines in vitro. (A) Summary of the composition of anti-CD86 (CD86-28z), anti-CD30 (CD30-28z), and anti-CD19 CAR (CD19-28z) constructs. (B-C) Representative flow cytometric images (B) and quantification (C; individual results and mean ± SEM of 10 different donors) of transduction efficiencies. Transduction efficiency was determined by staining for the extracellular c-Myc tag. (D) Absolute quantification of the molecule count per cell measured with quantitative flow cytometry. Molecule counts/cell of the indicated cell lines were calculated for CD86, CD30, and CD19, respectively. Molecule counts/cell of the isotype control were subtracted from total molecule counts. Depicted are 3 biological replicates. Data are representative of 2 independent experiments. (E-H) CD86-28z (mocha), CD30-28z (light blue), or CD19-28z (gray) CAR T cells were cocultured with the indicated cell lines (from top to bottom: L-428, L-540, KM-H2, Nalm-6, all transduced with fLuc-GFP). (E) Before cocultures, CAR T cells were stained with a Far Red proliferation dye, and antigen-specific proliferation was determined by trace dilution. Cocultures were analyzed by flow cytometry after 7 days. Top row of each color: CAR cocultured with tumor cells. Bottom row of each color: CAR only. Illustrated are representative histograms of in total 3 different donors. (F) Bioluminescence measurement of CAR-mediated lysis of tumor cells. Cell numbers were plated according to the indicated T-cell:tumor cell ratio. Tumor cell killing was determined after 72 hours. Specific lysis was calculated by normalizing to tumor cell-only controls. (G) IFN-γ release into coculture supernatant measured by ELISA. (F-G) Data are mean ± SEM from 3 independent donors. Statistical significance was calculated using 2-way ANOVA with Sidak multiple comparison correction. (H) Representative histograms depicting granzyme B-positive cells after 48 hours of coculture. Granzyme B was measured by intracellular staining after 12 hours of incubation with GolgiStop and GolgiPlug. Illustrated are representative histograms of in total 3 different donors. For all panels: ∗P < .05; ∗∗P < .01; ∗∗∗P < .001; ∗∗∗∗P < .0001. ns, P > .05.
Figure 6.
Figure 6.
CD86-28z CAR T cells elicit a strong antitumor response toward cHL cell lines in vivo. (A) Summary of the treatment schedule used for L-540 xenograft in vivo experiments. (B-D) BLI images (B), fLuc-BLI–based quantification of tumor burden (C), and Kaplan-Meier estimation of overall survival (D) of L-540 tumor-bearing mice treated with CD86-28z, CD30-28z, or CD19-28z CAR T cells, respectively. (B) Representative fLuc-BLI images of 5 mice per group of 1 of 2 independent experiments. (C-D) Pooled data from 2 independent experiments of total 10 mice per group are depicted. (E) Summary of the in vivo treatment schedule used for L-428–CD30−/− cells xenografted into NSG mice. (F-H) BLI images (F), fLuc-BLI–based quantification of tumor burden (G), or Kaplan-Meier estimation of overall survival (H) of L-428–CD30−/− tumor-bearing mice, treated with CD86-28z, CD30-28z, or CD19-28z CAR T cells, respectively. There were 5 mice per group. (I) Treatment scheme used to determine antigen-specific proliferation of CD86-28z CAR in cHL xenograft models in vivo. (J-M) Representative BLI images of tumor cell proliferation (fLuc-BLI images; J) or T-cell proliferation (teLuc-BLI images; K). Quantification of fLuc (L) or teLuc signal (M), respectively. There were 2 to 3 mice per group. Error bars indicate SEM. For all panels, statistical significance was calculated using 2-way ANOVA with Sidak multiple comparison correction. For Kaplan-Meier curves, statistical significance was calculated with a log-rank test. ∗P < .05; ∗∗P < .01; ∗∗∗P < .001; ∗∗∗∗P < .0001. ns, P > .05.
Figure 7.
Figure 7.
mCD86-28z CAR T cells are safe and do not interfere with bacterial host defense in polymicrobial sepsis models. (A) Summary of the treatment schedule used for toxicity assessment in C57Bl/6 mice. (B) Weight curves of mice treated with CD86-28z (mocha) or GFP control T cells (forest). There were 5 to 8 mice per group. As control mCD86-28z CAR T cells were injected in non-lymphodepleted mice (gray, n = 3). (C) Percentage of transferred T cells in the blood of C57Bl/6 mice at indicated time points after adoptive T-cell transfer (ACT) measured by flow cytometry. (D) Percentage of CD86+ B cells (left) or CD86+ monocytes (right) in the blood of C57Bl/6 mice at indicated time points after ACT. (E) Simple linear regression of CD3+CD8+ GFP+ T cells (x-axis) and CD86+ B cells (y-axis) in the blood of the mice over the different time points after ACT (days 6, 13, 23). r = Pearson correlation coefficient. (F-H) Mice were sacrificed 28 days after ACT, and organs were analyzed by flow cytometry. (F) Percentage of transferred T cells in the different organs of C57Bl/6 mice. (G) Immune cell composition in organs. (H) Percentage of CD86+ CD11b+ cells in different organs. (A-H) Data are mean ± SEM of 3 to 8 mice per group. Statistical significance was calculated using 2-way ANOVA with Tukey multiple comparison correction. (I,L) Summary of the treatment schedule used to assess formation of antigen-specific T cells in C57Bl/6 mice. (J,M) Percentage of OVA-specific T cells in the blood or spleen of antibody (J; n = 4-5 mice per group) or CAR T cell-treated mice (M; n = 7-8 mice per group). SINFEKL pentamer staining was used to measure antigen-specific T cells by flow cytometry. (K,N) IFN-γ–positive T cells measured by intracellular flow cytometry after restimulating harvested splenocytes with a SINFEKL peptide. (K,N) Mice were injected with aCD86 antibody or isotype control antibody on the indicated days (K) or treated with depicted amounts of mCD86-28z CAR T cells or GFP control T cells (N). (O,R) Summary of the treatment schedule used to assess bacterial host defense in C57Bl/6 mice. (O) 4 to 5 mice per group. (R) 8 mice per group. (P,S) Sepsis severity score after injection of cecal slurry. (Q,T) Bacterial colony counts in the blood (colony formation units per microliter) of mice IP injected with cecal slurry. For all panels, data are mean ± SEM of the indicated n number. Statistical significance was calculated using 2-way ANOVA with Sidak or Tukey multiple comparison correction or unpaired t test. ∗P < .05; ∗∗P < .01; ∗∗∗P < .001; ∗∗∗∗P < .0001. ns, P > .05. i.p., intraperitoneal.
Figure 7.
Figure 7.
mCD86-28z CAR T cells are safe and do not interfere with bacterial host defense in polymicrobial sepsis models. (A) Summary of the treatment schedule used for toxicity assessment in C57Bl/6 mice. (B) Weight curves of mice treated with CD86-28z (mocha) or GFP control T cells (forest). There were 5 to 8 mice per group. As control mCD86-28z CAR T cells were injected in non-lymphodepleted mice (gray, n = 3). (C) Percentage of transferred T cells in the blood of C57Bl/6 mice at indicated time points after adoptive T-cell transfer (ACT) measured by flow cytometry. (D) Percentage of CD86+ B cells (left) or CD86+ monocytes (right) in the blood of C57Bl/6 mice at indicated time points after ACT. (E) Simple linear regression of CD3+CD8+ GFP+ T cells (x-axis) and CD86+ B cells (y-axis) in the blood of the mice over the different time points after ACT (days 6, 13, 23). r = Pearson correlation coefficient. (F-H) Mice were sacrificed 28 days after ACT, and organs were analyzed by flow cytometry. (F) Percentage of transferred T cells in the different organs of C57Bl/6 mice. (G) Immune cell composition in organs. (H) Percentage of CD86+ CD11b+ cells in different organs. (A-H) Data are mean ± SEM of 3 to 8 mice per group. Statistical significance was calculated using 2-way ANOVA with Tukey multiple comparison correction. (I,L) Summary of the treatment schedule used to assess formation of antigen-specific T cells in C57Bl/6 mice. (J,M) Percentage of OVA-specific T cells in the blood or spleen of antibody (J; n = 4-5 mice per group) or CAR T cell-treated mice (M; n = 7-8 mice per group). SINFEKL pentamer staining was used to measure antigen-specific T cells by flow cytometry. (K,N) IFN-γ–positive T cells measured by intracellular flow cytometry after restimulating harvested splenocytes with a SINFEKL peptide. (K,N) Mice were injected with aCD86 antibody or isotype control antibody on the indicated days (K) or treated with depicted amounts of mCD86-28z CAR T cells or GFP control T cells (N). (O,R) Summary of the treatment schedule used to assess bacterial host defense in C57Bl/6 mice. (O) 4 to 5 mice per group. (R) 8 mice per group. (P,S) Sepsis severity score after injection of cecal slurry. (Q,T) Bacterial colony counts in the blood (colony formation units per microliter) of mice IP injected with cecal slurry. For all panels, data are mean ± SEM of the indicated n number. Statistical significance was calculated using 2-way ANOVA with Sidak or Tukey multiple comparison correction or unpaired t test. ∗P < .05; ∗∗P < .01; ∗∗∗P < .001; ∗∗∗∗P < .0001. ns, P > .05. i.p., intraperitoneal.

Similar articles

Cited by

References

    1. Majzner RG, Mackall CL. Clinical lessons learned from the first leg of the CAR T cell journey. Nat Med. 2019;25(9):1341–1355. - PubMed
    1. Labrijn AF, Janmaat ML, Reichert JM, Parren P. Bispecific antibodies: a mechanistic review of the pipeline. Nat Rev Drug Discov. 2019;18(8):585–608. - PubMed
    1. Bishop MR, Dickinson M, Purtill D, et al. Tisagenlecleucel vs standard of care as second-line therapy of primary refractory or relapsed aggressive B-cell non-Hodgkin lymphoma: analysis of the phase III Belinda study [abstract] Blood. 2021;138(suppl 2):LBA-6.
    1. Locke FL, Miklos DB, Jacobson CA, et al. Axicabtagene ciloleucel as second-line therapy for large B-cell lymphoma. N Engl J Med. 2022;386(7):640–654. - PubMed
    1. Smith CM, Friedman DL. Advances in Hodgkin lymphoma: including the patient's voice. Front Oncol. 2022;12 - PMC - PubMed