. 2025 Apr 8;122(14):e2422709122.
doi: 10.1073/pnas.2422709122. Epub 2025 Apr 3.

An unusual potassium conductance protects Caenorhabditis elegans pharyngeal muscle rhythms against environmental noise

Affiliations

An unusual potassium conductance protects Caenorhabditis elegans pharyngeal muscle rhythms against environmental noise

Max Kenngott et al. Proc Natl Acad Sci U S A. .

Abstract

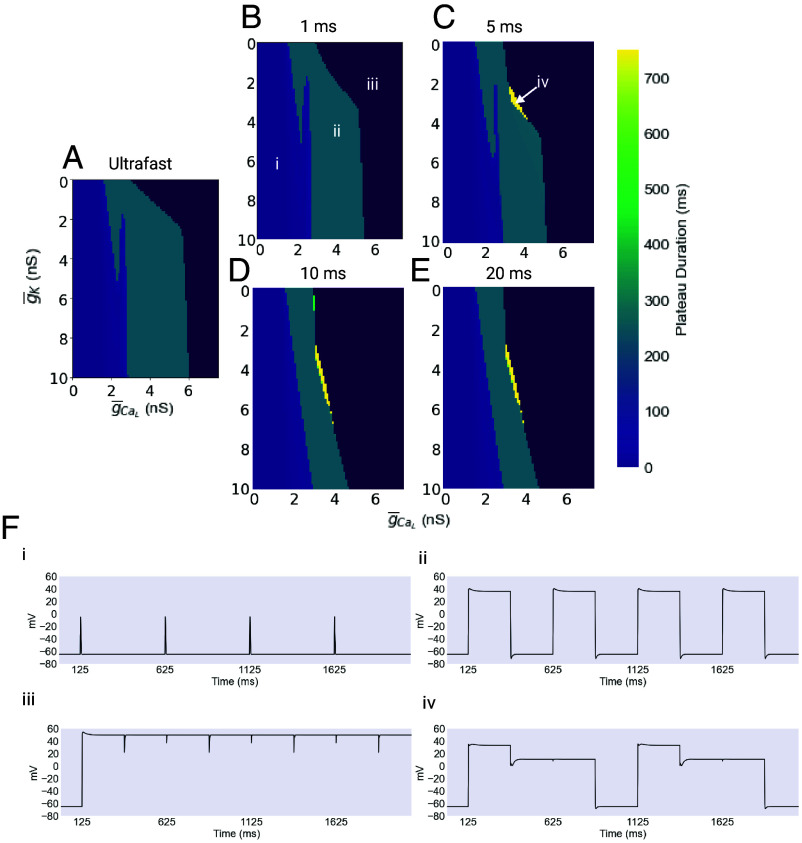
The nematode Caenorhabditis elegans feeds by rhythmic contraction and relaxation of a neuromuscular organ called the pharynx, which draws in and filters water and bacterial food. This behavior is driven by myogenic plateau potentials, long-lasting depolarizations of the pharyngeal muscle, which are timed by neuronal input from a dedicated pharyngeal nervous system. While the timing of these plateaus' initiation has received significant attention, their mechanisms of termination remain incompletely understood. In particular, it is unclear how plateaus resist early termination by hyperpolarizing current noise. Here, we present a computational model of pharyngeal plateaus against a noisy background. We propose that an unusual, rapidly inactivating potassium conductance confers exceptional noise robustness on the system. We further investigate the possibility that a similar mechanism in other systems permits switching between plateau and spiking behavior under noisy conditions.

Keywords: plateau properties; rapid K channel inactivation; synaptic noise.


Conflict of interest statement

Competing interests statement:The authors declare no competing interest.

Figures

Fig. 1.
Fig. 1.
Pharyngeal pumping is driven by plateau potentials. The pharynx is a neuromuscular feeding organ composed of three principal segments: the corpus, the isthmus, and the terminal bulb. The pumping action of the pharynx is driven by myogenic plateau potentials. Plateaus correspond to a muscle contraction and an open corpus, as seen in the Bottom panel, while a resting membrane potential corresponds to a relaxed, closed corpus, depicted in the Top panel. Created with BioRender.com.
Fig. 2.
Fig. 2.
Model of the C. elegans pharynx. The model includes the motor neurons MC and M3 as respectively excitatory and inhibitory inputs to an electrically uniform pharyngeal muscle compartment. The noisy character of presynaptic signaling included in the model is understood to stem in part from the small size and high input resistance of these neurons. Created with BioRender.com.
Fig. 3.
Fig. 3.
The ionic basis of plateaus in the model. The Right and Left panels are blow-ups of the indicated sections of the Central panel. In the Leftmost panel, the initiation of the plateau begins with an EPSP resulting from MC cell input. This drives the activation of a T-type calcium channel, which in turn drives the activation of an L-type calcium channel which is the basis of the long-lasting plateau itself. In the Rightmost panel, an IPSP resulting from input from the M3 cell hyperpolarizes the muscle enough to remove inactivation from the EXP-2 K+ channel, which subsequently causes the repolarization of the cell. Created with BioRender.com.
Fig. 4.
Fig. 4.
The g¯K/g¯CaL parameter space. (A) The mean plateau duration is plotted for a range of values of the maximal conductances of IK and ICaL. The leftmost portion of the plot, shown in light purple, corresponds to a continuum of behaviors ranging from low-amplitude spikes to low-amplitude, short-duration plateaus. The rightmost portion, shown in dark purple, represents combinations of conductances that result in a complete failure of rhythmicity, producing unending plateaus. For scaling reasons, this region is colored without reference to the colorbar. Finally, the turquoise central region represents the region of physiological function. (B) Four exemplar traces of the behavior found in the regions described above are shown. Created with BioRender.com.
Fig. 5.
Fig. 5.
Example outputs of the ultrafast model. Output of the model in clean and noisy conditions for varying values of the V1/2 of inactivation for the EXP-2 K+ conductance. The model pharyngeal muscle was timed by EPSPs and IPSPs from the modeled MC and M3 cells respectively to produce 250 ms plateaus, close to the plateau length observed during feeding. The model produces identical output for all values of V1/2 under noiseless conditions, represented in the Top panel. When noise is applied to the model, the versions with more hyperpolarized value of V1/2 are more robust, while plateaus in models with relatively depolarized values are terminated early. This divergence between versions of the model becomes more pronounced under more intense noise. Created with BioRender.com.
Fig. 6.
Fig. 6.
Summary of model outputs. Models with V1/2 = 10, 15, 20 mV were run for 1,000 s of model time, and the length of the resulting plateaus averaged for low (λ=0.01) and high (λ=0.05) noise intensities. (A) Mean plateau duration for each model under low noise conditions. The “No Noise” Value was identical for all models. (B) Mean plateau duration for each model under high noise conditions. Again, the No Noise Value was identical for all models. (C) Effect size for each of the three models under low noise conditions. These values were calculated using the z-score of a two-tailed Mann–Whitney U test comparing the low noise and no noise results for each model. The effect size was calculated as Effect=|z|N. (D) Effect size for each of the three models under high noise conditions. These values were calculated using the z-score of a two-tailed Mann–Whitney U test comparing the high noise and no noise results for each model. The effect size was calculated as Effect=|z|N. Created with BioRender.com.
Fig. 7.
Fig. 7.
The mechanism of noise robustness. The activation (w) and inactivation (h) curves for EXP-2. The size of the EXP-2 conductance scales with the product of w and h, meaning that the bigger the nonzero overlap of the two curves, the larger the hyperpolarizing current being passed. Consequently, moving the h curve horizontally influences the excitability of the EXP-2 conductance. (A) If the plateau is holding at 40 mV, and h is given by the turquoise curve, then a larger initial hyperpolarization is required to drive the cell to a potential where h is nonzero, allowing EXP-2 to conduct and hyperpolarize the cell. (B) If the plateau is holding at 40 mV, and h is given by the yellow curve, then a smaller initial hyperpolarization is required to drive the cell to a potential where h is nonzero, allowing EXP-2 to conduct and hyperpolarize the cell. In case A, a larger noise event would be required to activate EXP-2, and in case B a smaller one. Consequently, the more left shifted curve, with the more hyperpolarized value of V1/2, is more robust to noise. Created with BioRender.com.
Fig. 8.
Fig. 8.
The g¯K/g¯CaL parameter space in longer timescale models. (AE) The mean plateau duration is plotted for a range of values of the maximal conductances of IK and ICaL. The Leftmost portion of the plot, shown in light purple, corresponds to a continuum of behaviors ranging from low-amplitude spikes to low-amplitude, short-duration plateaus. The Rightmost portion, shown in dark purple, represents combinations of conductances that result in a complete failure of rhythmicity, producing unending plateaus. For scaling reasons, this region is colored without reference to the colorbar. The turquoise central regions represent the region of physiological function. Finally, yellow patches represent regions of long duration, two-level plateaus. (F) Four exemplar traces of the behavior found in the regions described above are shown. Created with BioRender.com.
Fig. 9.
Fig. 9.
Example outputs of long timescale models. The ultrafast inactivation model compared to models with constant values of τh. The ultrafast inactivating model produces mostly untruncated plateaus of the desired length of 250 ms, timed by input from the excitatory MC and inhibitory M3 cells. Note that the first plateau in the ultrafast was truncated early while all plateaus in the 5 and 10 ms cases were untruncated. When τh is set to 1 ms, the resulting plateaus are essentially identical to the ultrafast case. However when the value of τh is increased to 5 ms, the plateaus develop a noticeable “wedge” hyperpolarization immediately after their initial depolarization. At τh = 10 ms, the resulting plateaus are mostly truncated very early, and in surviving plateaus, this wedge hyperpolarization is more pronounced. Created with BioRender.com.
Fig. 10.
Fig. 10.
Summary of model outputs. Models with τ = 1, 5, 10, and 20 ms were run for 1,000 s of model time, and the length of the resulting plateaus averaged for low (λ=0.01) and high (λ=0.05) noise intensities. (A) Mean plateau duration for each model under low noise conditions. The No Noise Value was identical for all models. (B) Mean plateau duration for each model under high noise conditions. Again, the No Noise Value was identical for all models. (C) Effect size for each of the three models under low noise conditions. These values were calculated using the z-score of a two-tailed Mann–Whitney U test comparing the low noise and no noise results for each model. The effect size was calculated as Effect=|z|N. (D) Effect size for each of the three models under high noise conditions. These values were calculated using the z-score of a two-tailed Mann–Whitney U test comparing the high noise and no noise results for each model. The effect size was calculated as Effect=|z|N. Created with BioRender.com.
Fig. 11.
Fig. 11.
The structure of plateaus from longer timescale models. A single myogenic plateau as produced by four different models, each with a different value for τh of EXP-2. The shortest value of 1 ms produces plateaus essentially indistinguishable from the ultrafast model presented above, with a long relaxation from an initial peak, driven by EGL-19 inactivation. However as the timescale (τh) is lengthened, a wedge hyperpolarization develops after an initial peak. This not only makes these plateaus more susceptible to noise events early in the course of the plateau. It may also impact the ability of the plateau to drive a consistent and appropriately timed contraction of the pharyngeal muscle. Created with BioRender.com.
Fig. 12.
Fig. 12.
Interactions between synaptic and inactivation timescales. Faster timescale noise events are readily filtered out by cells with slower timescale IK inactivation. Each curve corresponds to the mean plateau duration over 100 seconds of model time for models with time constants of inactivation of IK ranging from 0.5 to 10 ms, for a given value of the synaptic time constant, which controls the timescale of inhibitory noise events. For faster noise events, models with slower values of τIK effectively filter out noise, producing relatively robust plateaus. This effect is counterbalanced by the initial hiccup hyperpolarization produced by slower inactivation timescales, which at larger values of τIK renders plateaus less robust. Created with BioRender.com.

Similar articles

References

    1. Avery L., Shtonda B. B., Food transport in the C. elegans pharynx. J. Exp. Biol. 206, 2441–2457 (2003). - PMC - PubMed
    1. Raizen D. M., Avery L., Electrical activity and behavior in the pharynx of Caenorhabditis elegans. Neuron 12, 483–495 (1994). - PMC - PubMed
    1. Song B., Avery L., The pharynx of the nematode C. elegans: A model system for the study of motor control. Worm 2, e21833 (2013). - PMC - PubMed
    1. Cook S. J., et al. , The connectome of the Caenorhabditis elegans pharynx. J. Comp. Neurol. 528, 2767–2784 (2020). - PMC - PubMed
    1. Albertson D. G., Thompson J., The pharynx of Caenorhabditis elegans. Philos. Trans. R. Soc. Lond. Ser. B, Biol. Sci. 275, 299–325 (1976). - PubMed

LinkOut - more resources