. 2025 Apr 3;135(11):e180570.
doi: 10.1172/JCI180570. eCollection 2025 Jun 2.

Hyaluronan network remodeling by ZEB1 and ITIH2 enhances the motility and invasiveness of cancer cells

Affiliations

Hyaluronan network remodeling by ZEB1 and ITIH2 enhances the motility and invasiveness of cancer cells

Sieun Lee et al. J Clin Invest. .

Abstract

Hyaluronan (HA) in the extracellular matrix promotes epithelial-mesenchymal transition (EMT) and metastasis; however, the mechanism by which the HA network constructed by cancer cells regulates cancer progression and metastasis in the tumor microenvironment (TME) remains largely unknown. In this study, inter-α-trypsin inhibitor heavy chain 2 (ITIH2), an HA-binding protein, was confirmed to be secreted from mesenchymal-like lung cancer cells when cocultured with cancer-associated fibroblasts. ITIH2 expression is transcriptionally upregulated by the EMT-inducing transcription factor ZEB1, along with HA synthase 2 (HAS2), which positively correlates with ZEB1 expression. Depletion of ITIH2 and HAS2 reduced HA matrix formation and the migration and invasion of lung cancer cells. Furthermore, ZEB1 facilitates alternative splicing and isoform expression of CD44, an HA receptor, and CD44 knockdown suppresses the motility and invasiveness of lung cancer cells. Using a deep learning-based drug-target interaction algorithm, we identified an ITIH2 inhibitor (sincalide) that inhibited HA matrix formation and migration of lung cancer cells, preventing metastatic colonization of lung cancer cells in mouse models. These findings suggest that ZEB1 remodels the HA network in the TME through the regulation of ITIH2, HAS2, and CD44, presenting a strategy for targeting this network to suppress lung cancer progression.

Keywords: Cell biology; Extracellular matrix; Lung cancer; Oncology.


Conflict of interest statement

Conflict of interest: SP is employed by Deargen Inc., and KK is a cofounder of and shareholder in Deargen Inc.

Figures

Figure 1
Figure 1. ZEB1 is a transcription factor of ITIH2.
(A) Western blot showing expression of ZEB1 and ITIH2 in murine lung cancer cells. β-Actin served as a loading control. (B) Quantitative reverse transcription PCR (qRT-PCR) analysis of Zeb1 and Itih2 mRNA in epithelial-like (blue) and mesenchymal-like (red) murine lung cancer cells. Rpl32 was used as a reference gene. (C) Scatterplot illustrating the correlation between Zeb1 and Itih2 mRNA levels in qRT-PCR data of murine lung cancer cells (n = 13). (D) qRT-PCR of the ITIH family members (Itih1Itih5). (E) Scatterplot depicting the correlation between ZEB1 and ITIH2 mRNA levels in TCGA-LUAD data (n = 517). (F and G) qRT-PCR analysis of ZEB1 and ITIH2 mRNA in HCC827 and H1299 cells. Expression levels were normalized to ZEB1 in HCC827 (F) or HCC827-vector (G). N.D., not detected. **P < 0.01 by 2-tailed Student’s t test. (H) qRT-PCR showing Itih2 and Zeb1 mRNA levels in 344SQ-ZEB1 knockdown (KD) or control (NTC) cells. **P < 0.01 by 1-way ANOVA followed by Dunnett’s multiple-comparison test. (I) Western blot displaying expression of ZEB1 and ITIH2 in 344SQ-ZEB1-KD or control cells. Densitometric analysis (numbers below the ITIH2 blot) is shown relative to NTC (set at 1.0). (J) Luciferase reporter assay of ITIH2 promoter activity. **P < 0.01 by 1-way ANOVA followed by Dunnett’s multiple-comparison test (compared with pGL3+ZEB1). (K) ChIP assay on the ITIH2 promoter region. Cross-linked chromosomal DNA fragments were immunoprecipitated with an anti-ZEB1 antibody or control IgG. Eluted DNA fragments were used as templates for PCR with primer sets covering putative ZEB1-binding sites (site-1 and -2) or with a negative control primer set (con). Data represent the mean ± SD from a single experiment with biological replicates (n = 3, unless otherwise specified) and are representative of at least 3 independent experiments.
Figure 2
Figure 2. ITIH2 KD inhibits the migration and invasion of lung cancer cells.
(A) qRT-PCR analysis of Itih2 mRNA levels in 344SQ cells transduced with Itih2 shRNAs (shC or shE). P values from 1-way ANOVA followed by Dunnett’s multiple-comparison test. (B) Boyden chamber migration assay in 344SQ-ITIH2-KD cells. After 24 hours, migrated cells were stained with crystal violet. P values determined by 1-way ANOVA followed by Dunnett’s multiple-comparison test. Scale bar: 200 μm. (C) Scratch migration assay in 344SQ-ITIH2-KD cells. Migration activity, (1 – [scratch area ratio of 24 hours to 0 hours]) × 100%, was measured using ImageJ (NIH). Mean ± SD (n = 12). P values determined by 1-way ANOVA followed by Dunnett’s multiple-comparison test. (D) Boyden chamber invasion assay in HCC827 cells overexpressing ITIH2. P value determined by 2-tailed Student’s t test. Scale bar: 200 μm. (E) Mouse subcutaneous injection of 344SQ-ITIH2-KD cells. After 6 weeks of injection, the primary tumor volume and lung metastatic tumor nodules were measured at necropsy (n = 9 or 10). P values determined by 1-way ANOVA followed by Dunnett’s multiple-comparison test. (F) Mouse orthotopic injection of 344SQ-ITIH2-KD cells. After a week of injection, the tumor nodules on mediastinal lymph nodes and lungs were measured at necropsy (n = 7 or 8). H&E staining results of the lung sections are described. P values determined by 1-way ANOVA followed by Dunnett’s multiple-comparison test. Scale bar: 5 mm. (G) Mouse tail-vein injection of 344SQ-ITIH2-KD cells. After 10 days of injection, tumor nodules colonized in the lungs were measured at necropsy under a fluorescent microscope (n = 5). P values determined by 2-tailed Student’s t test. Scale bars: 5 mm (left), 2 mm (right). (H) Kaplan-Meier curve for progression-free survival in patients with LUAD was generated from the Kaplan-Meier plotter (66). Data represent the mean ± SD from a single experiment with biological replicates (n = 3, unless otherwise specified) and are representative of at least 3 independent experiments.
Figure 3
Figure 3. ITIH2 KD inhibits the interaction between cancer cells and CAFs.
(A) Confocal micrographs of multicellular aggregates containing CAF-led invasive structures (arrows). Spheroids were created with both CAFs (labeled with GFP) and 344SQ-NTC or ITIH2-KD cells (shC and shE, labeled with mCherry). The spheroid invasion ratios were calculated by ImageJ software after 24 hours of incubation. Mean ± SD (NTC, n = 8; shC, n = 7; shE, n = 7). P values determined by 1-way ANOVA followed by Dunnett’s multiple-comparison test. Scale bar: 200 μm. (B) Confocal micrographs of spheroid overlay cultures where 344SQ cancer cell spheroids (NTC or shC–E, mCherry) were placed on top of a confluent monolayer of CAFs (GFP), which were cultured for 24 hours before the spheroid seeding. Multicellular aggregates were further incubated for another 24 hours to allow migration and invasion. Arrows indicate the lateral surface of cancer cell aggregates interacting with surrounding CAFs. Scale bars: 200 μm (top), 100 μm (bottom left). (C) Spheroid invasion assay in 344SQ-ITIH2-shC (green), NTC (red), and mixed NTC and shC (NTC+shC) cells. The cancer spheroids were composed of NTC only, shC only, and a mix of both NTC and shC. To differentiate between the cell types, NTC cells were labeled with red fluorescence and shC cells with green fluorescence. After 48 hours, spheroids were embedded in collagen gels. The spheroids were imaged using a fluorescence microscope (middle panel), and the spheroid invasion ratio was calculated using ImageJ software (right) after 24 hours of incubation. Mean ± SD (NTC, n = 12; shC, n = 10; NTC+shC, n = 12). P values determined by 1-way ANOVA followed by Dunnett’s multiple-comparison test. Scale bar: 200 μm. Data represent the mean ± SD from a single experiment with biological replicates and are representative of at least 3 independent experiments.
Figure 4
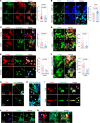
Figure 4. ZEB1 and ITIH2 facilitate the formation of the HA matrix and cables.
(A) Confocal microscopy of 344SQ cells with or without 4-MU treatment (1 mg/mL for 24 hours) stained with HABP, phalloidin, and DAPI. Mean ± SD (control [CON], n = 40; 4-MU, n = 12). (B) Confocal microscopy of 393P-vec and 393P-ZEB1 cells. Mean ± SD (393P-vec, n = 14; 393P-ZEB1, n = 17). (C) Confocal microscopy of 344SQ and 393P cells. Mean ± SD (344SQ, n = 11; 393P, n = 10). (D) Confocal Z-stack images of 344SQ and 393P cells. The arrows indicate HA cables. Mean ± SD (393P, n = 17; 344SQ, n = 10). (E) Confocal microscopy of 344SQ-ITIH2-KD cells. Mean ± SD (344SQ-NTC, n = 8; ITIH2-KD, n = 6). (F) Confocal Z-stack images of 344SQ-ITIH2-KD cells. Arrows indicate HA cables. Mean ± SD (344SQ-NTC, n = 12; ITIH2-KD, n = 10). Scale bars in AF: 50 μm. (G) Confocal Z-stack images of 344SQ cells. The arrows indicate ITIH2 on the HA cable. Scale bars: 25 μm (top), 10 μm (bottom). (H) Confocal Z-stack images of 344SQ cells. The arrows indicate that HA cables are not colocalized with cytoskeletons. Scale bar: 50 μm. (I) Confocal Z-stack images of 344SQ cells. The arrows indicate an HA cable forming a bridge between 2 cells. Scale bar: 20 μm. (J) Confocal Z-stack images of 344SQ cells. RFP-labeled EVs were treated to control 344SQ cells for 24 hours. The arrows indicate the captured EVs on HA cables. Scale bar: 10 μm. (K) Confocal Z-stack images of the same 344SQ cells as in J. The arrows indicate a cell with less HA matrix, and the asterisks indicate a cell with abundant HA matrix. Scale bar: 20 μm. Data represent the mean ± SD from a single experiment with biological replicates and are representative of at least 3 independent experiments. P values determined by 2-tailed Student’s t test.
Figure 5
Figure 5. Mesenchymal-like cells are more sensitive to the HA matrix than epithelial-like cells.
(A) Scratch migration assay in 393P and 344SQ cells treated with HA (2 mg/mL). Mean ± SD (n = 12). (B) Boyden chamber migration assay in 393P and 344SQ cells treated with HA. (C) Spheroid invasion assay of 393P and 344SQ cells treated with HA. The spheroid invasion ratios were calculated by ImageJ after 24 hours of incubation. Mean ± SD (393P control, n = 21; 393P with HA, n = 25; 344SQ control, n = 30; 344SQ with HA, n = 21). (D) Boyden chamber migration assay in HCC827 and H1299 cells treated with HA. (E) Boyden chamber migration (left) and invasion (right) assays in HCC827-vec and HCC827-ZEB1 cells treated with HA. (F) Western blot of ZEB1, N-cadherin, E-cadherin, and vimentin in 393P and 344SQ cells treated with HA. (G) Scratch migration assay of 344SQ-ITIH2-KD and NTC cells with mean ± SD (n = 12). (H) Spheroid invasion assay of 393P and 344SQ cells treated with 4-MU (1 mg/mL). Mean ± SD (393P control, n = 13; 393P with 4-MU, n = 15; 344SQ control, n = 9; 344SQ with 4-MU, n = 9). (I) Boyden chamber migration assay in 393P and 344SQ cells with hyaluronidase (HYAL). (J) Western blot of p-ERK and ERK2 in 393P and 344SQ cells with HA treatment. (K) Boyden chamber migration assay of 344SQ cells treated with HA and FR180204 (10 μM). Scale bar: 200 μm. (L) Spheroid invasion assay of 344SQ cells treated with FR180204. Mean ± SD (DMSO, n = 44; FR180204, n = 44). Scale bar: 200 μm. Data represent the mean ± SD from a single experiment with biological replicates (n = 3, unless otherwise specified) and are representative of at least 3 independent experiments. P values determined by 2-tailed Student’s t test.
Figure 6
Figure 6. ZEB1 upregulates HAS2 expression.
(A) qRT-PCR of Has2 mRNA levels in epithelial-like (blue) and mesenchymal-like (red) murine lung cancer cells. A scatterplot of Zeb1 and Has2 mRNA levels is presented (right). (B) Scatterplot of ZEB1 and HAS2 mRNA levels in TCGA-LUAD data (n = 517). (C) qRT-PCR of mRNA levels of HAS family members (Has1Has3) in 393P, 344SQ, 393P-vec, and 393P-ZEB1 cells. **P < 0.01 by 2-tailed Student’s t test. (D) qRT-PCR of HAS2 mRNA levels in HCC827 and H1299 cells. P value determined by 2-tailed Student’s t test. (E) Luciferase reporter assay of Has2 promoter activity. Murine Has2 promoter region (2,077 bp; –1,182 to 895 from the transcription start site) was inserted into a luciferase reporter vector (pGL3-Basic). Luciferase reporter was cotransfected with the ZEB1 expression vector. P value determined by 2-tailed Student’s t test. (F) qRT-PCR of Has2 mRNA levels in 344SQ cells transfected with Has2 siRNAs (siRNA nos. 1, 4, and 5). **P < 0.01 by 1-way ANOVA followed by Dunnett’s multiple-comparison test. (G) Boyden chamber migration assay of 344SQ cells transfected with Has2 siRNAs. Cells were seeded in upper inserts, and after 24 hours, migrated cells were stained with crystal violet. **P < 0.01 by 1-way ANOVA followed by Dunnett’s multiple-comparison test. Scale bar: 200 μm. (H) qRT-PCR of Has2 mRNA levels in 344SQ cells transduced with Has2 shRNA. P value from 2-tailed Student’s t test. (I) Mouse orthotopic injection of 344SQ-HAS2-KD cells. Cells labeled with mCherry were injected into the left lung (n = 10). After 1 week, lung tumors were measured at necropsy under a fluorescence microscope. P value determined by 2-tailed Student’s t test. Scale bar: 5 mm. Data represent the mean ± SD from a single experiment with biological replicates (n = 3, unless otherwise specified) and are representative of at least 3 independent experiments.
Figure 7
Figure 7. ZEB1 controls CD44 expression.
(A) Western blot of CD44 in epithelial-like and mesenchymal-like murine lung cancer cells. Standard (s) and variant (v) isoforms of CD44 are indicated. (B) RT-PCR of Cd44 in 393P-vec and 393P-ZEB1 cells. Standard (s) and variant (v) splicing isoforms are indicated. Rpl32 was used as a loading control. (C) Western blot of CD44 in 393P-vec and 393P-ZEB1 cells. (D) Western blot of CD44 in 344SQ cells transduced with Cd44 shRNAs (shA–E). (E) Boyden chamber migration assay of 344SQ-CD44-KD (shC and shD) and NTC cells. Cells were seeded in upper inserts, and after 24 hours, migrated cells were stained with crystal violet. P values determined by 1-way ANOVA followed by Dunnett’s multiple-comparison test. Scale bar: 200 μm. (F) Mouse subcutaneous injection of 344SQ-CD44-KD (shC) and NTC cells. Tumor volume was measured at necropsy. P value from 2-tailed Student’s t test. (G) Boyden chamber migration assay of 344SQ-CD44-KD and NTC cells treated with or without HA. Cells were seeded in upper inserts coated with HA, and after 24 hours, migrated cells were stained with crystal violet. P value determined by 2-tailed Student’s t test. Scale bar: 200 μm. (H) Confocal microscopy of 344SQ-CD44-KD and NTC cells stained with HABP and streptavidin–Alexa Fluor 488 (green) and phalloidin (red). Mean ± SD (NTC, n = 10; shC, n = 10). Scale bar: 50 μm. (I) Scatterplot of ZEB1 and CD44 mRNA levels in TCGA-LUAD data (n = 517). (J) qRT-PCR of Esrp1 mRNA levels in 393P, 344SQ, 393P-vec, and 393P-ZEB1 cells. (H) and (I) P values determined by 2-tailed Student’s t test. (K) Scatterplot of ZEB1 and ESRP1 mRNA levels in TCGA-LUAD data (n = 517). (L) Diagram showing the HA network reconstructed by ZEB1. Data represent the mean ± SD from a single experiment with biological replicates (n = 3, unless otherwise specified) and are representative of at least 3 independent experiments.
Figure 8
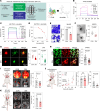
Figure 8. Sincalide, an ITIH2 inhibitor, inhibits the migration and invasion of lung cancer cells.
(A) Prediction of ITIH2 inhibitors using the MT-DTI algorithm. (B) Surface plasmon resonance (SPR) analysis showing binding of sincalide to the ITIH2 protein. (C and D) SPR analysis showing inhibition of binding between HA and the ITIH2 protein by sincalide. (E and F) Boyden chamber migration (E) and spheroid invasion assay (F) of 344SQ cells treated with sincalide (SIN). Scale bar: 200 μm. (G) Spheroid invasion assay of CAFs and 344SQ cells treated with sincalide. Mean ± SD (CON, n = 23; SIN, n = 32). Scale bar: 200 μm. (H) Confocal microscopy of 344SQ cells treated with sincalide. Mean ± SD (CON, n = 20; SIN, n = 24). Scale bar: 50 μm. (I) 344SQ cells were orthotopically injected into the left lung (n = 8 or 9). Sincalide (2.5 mg/kg of body weight) was injected intraperitoneally twice a week until mice were euthanized. After 7 days, the number of lung tumor nodules was measured at necropsy. Scale bar: 5 mm. (J) 344SQ cells were subcutaneously injected (n = 9), and primary tumor volumes (left graph) were measured until mice were euthanized. After 6 weeks, tumor weights (middle graph) and number of lung metastases (right graph) were measured at necropsy. (K) 344SQ cells were injected via tail vein (n = 5 or 6). After 10 days, tumor nodules colonized in lungs were assessed. Scale bar: 5 mm. Data represent the mean ± SD from a single experiment with biological replicates (n = 3, unless otherwise specified) and are representative of at least 3 independent experiments. P values determined by 2-tailed Student’s t test (EI, J [right 2 bar graphs], and K) or 2-way ANOVA test (J [left]).

References

    1. Winkler J, et al. Concepts of extracellular matrix remodelling in tumour progression and metastasis. Nat Commun. 2020;11(1):5120. doi: 10.1038/s41467-020-18794-x. - DOI - PMC - PubMed
    1. Karousou E, et al. Hyaluronan in the cancer cells microenvironment. Cancers (Basel) 2023;15(3):798. doi: 10.3390/cancers15030798. - DOI - PMC - PubMed
    1. Gatti V, et al. ΔNp63 regulates the expression of hyaluronic acid-related genes in breast cancer cells. Oncogenesis. 2018;7(8):65. doi: 10.1038/s41389-018-0073-3. - DOI - PMC - PubMed
    1. Kim PK, et al. Hyaluronic acid fuels pancreatic cancer cell growth. Elife. 2021;10:e62645. doi: 10.7554/eLife.62645. - DOI - PMC - PubMed
    1. Brichkina A, et al. p38MAPK builds a hyaluronan cancer niche to drive lung tumorigenesis. Genes Dev. 2016;30(23):2623–2636. doi: 10.1101/gad.290346.116. - DOI - PMC - PubMed

MeSH terms