. 2025 Apr 3;10(9):e186938.
doi: 10.1172/jci.insight.186938. eCollection 2025 May 8.

Dipeptidase-1-knockout mice develop invasive tumors with features of microsatellite-unstable colorectal cancer

Affiliations

Dipeptidase-1-knockout mice develop invasive tumors with features of microsatellite-unstable colorectal cancer

Sarah E Glass et al. JCI Insight. .

Abstract

Dipeptidase-1 (DPEP1) is highly upregulated in colorectal cancer (CRC), with its enzymatic function linked to invasion and metastasis. More recently, DPEP1 was found to serve as a receptor for neutrophils when expressed by activated endothelial cells. It is unknown whether neutrophils bind to DPEP1-expressing CRC cells and whether this impacts features of CRC. Neutrophils have been shown to be tumor promoting in cancers including CRC, where they act to exclude CD8+ T cells. Herein, we show that neutrophils bind DPEP1-expressing CRC cells. In addition, DPEP1 is preferentially expressed in microsatellite-stable (MSS) CRCs, in which there are a paucity of CD8+ T cells, whereas DPEP1 is negatively correlated with microsatellite-unstable (MSI-H) CRCs, which are T cell rich and are more responsive to immunotherapy. Remarkably, carcinogen-treated Dpep1-null mice develop multiple, large, plaque-like, locally invasive adenocarcinomas and squamous cell cancers in the distal colon. These adenocarcinomas exhibit a marked reduction in neutrophils and an influx CD8+ T cells, along with reduced expression of mismatch repair proteins, consistent with features of MSI-H CRC. These results establish DPEP1's importance in maintaining MSS CRC and its ability to shape the tumor microenvironment.

Keywords: Cancer; Cell biology; Oncology.


Conflict of interest statement

Conflict of interest: The authors have declared that no conflict of interest exists.

Figures

Figure 1
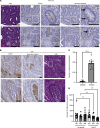
Figure 1. DPEP1 is linked to neutrophil presence and binding in CRC.
(A) Hematoxylin and eosin (H&E) staining and DPEP1 and neutrophil elastase immunohistochemistry (IHC) for 2 selected cores from a human adenoma tissue microarray (TMA) (n = 336 cores assessed). (B) DPEP1 and neutrophil elastase IHC and H&E for a selected core from a human CRC TMA (n = 249 cores assessed). (C) Quantification of neutrophil binding assay for comparison of SW480 and SW620 cells, where each field of view (FOV) is an individual data point (n = 12 FOVs per cell type). (D) Quantification of neutrophil binding assay for SW620 cells treated with scrambled or LSALT peptide at the designated concentrations (μM) as indicated on the graph, where each FOV is an individual data point (n = 12 FOVs per condition). Data are representative images. Arrows mark individual cells positive for neutrophil elastase. Scale bars: 200 μm and 100 μm (insets). Binding assays were conducted in triplicate. Error bars represent SEM. NS, no significance. ***P < 0.001; ****P < 0.0001 by Wilcoxon-Mann-Whitney (C) andor Kruskal-Wallis test (D).
Figure 2
Figure 2. DPEP1 is a Wnt response gene and is associated with MSS CRC and related mutations.
(A) Representative IHC staining of apical DPEP1 at the base of human normal colonic crypts. Scale bar: 100 μm. (B) Relative quantification for AXIN2, NKD1, and DPEP1 mRNA levels in normal colonic organoids with or without CHIR99021 (CHIR) treatment (n = 4 biological replicates). Error bars represent SEM. (CF) DPEP1 mRNA expression of TCGA database COAD and READ cohorts as it relates to (C) APC (n = 274), (D) P53 (n = 356), (E) BRAFV600E (n = 344) mutational status, and (F) MSI-H status (n = 375). (G) Percentage of CRC samples from TMAs based on DPEP1 staining intensity as delineated by MSI status (n = 105). (H) DPEP1 mRNA expression of TCGA database COAD and READ cohorts as it relates to CRC CMS categories (n = 485). Median denoted in red. WT, wild-type; MUT, mutated; NS, no significance. *P < 0.05; **P < 0.01; ***P < 0.001; ****P < 0.0001 by Wilcoxon-Mann-Whitney, χ2 (B-F), chi squared (G), and Kruskal-Wallis test (H).
Figure 3
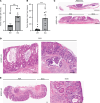
Figure 3. Mice lacking DPEP1 have an increased tumor burden and exhibit invasive adenocarcinoma and invasive squamous cell carcinoma.
(A) Quantification of tumor number per mouse comparing WT (n = 12) and DPEP1-KO (n = 10) mice following a regimen of AOM/DSS. (B) Quantification of total tumor volume per mouse in WT (n = 12) and DPEP1-KO (n = 10) groups. (C) Representative H&E images of WT adenoma (Ad) and DPEP1-KO cancer. Scale bars: 1 mm. (D and E) H&E images of DPEP1-KO tumor shows 2 histological subtypes: (D) adenocarcinoma (ACA) with mucinous features as in the inset from C (left) and invasive features (right); and (E) squamous cell carcinoma (SCC), with related inset showing invasion. Scale bars: 200 μm. Error bars represent SEM. ***P < 0.001 by Wilcoxon-Mann-Whitney test.
Figure 4
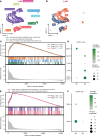
Figure 4. Mice lacking DPEP1 form tumors with molecular features distinct from MSS.
(A) UMAP representation of the major cell types isolated from WT and DPEP1-KO tumor tissue. (B) UMAP plot showing the WT and DPEP1-KO groups. (C) FCS-GSEA plots showing example significantly enriched signaling pathways in DPEP1-KO Ad/ACA cells in comparison with WT. (D) Dot plot of Dpep1, select chemokine genes, and G2M score in WT and DPEP1-KO groups in Ad/ACA cells (Dpep1 Padj = 1.2 × 10–139; Cxcl16 Padj = 7.6 × 10⁻²³; Cxcl9 Padj = 5.5 × 10⁻¹³; Cxcl5 Padj = 8.6 × 10–77; G2M score Padj = 1.6 × 10–61). (E) FCS-GSEA plots showing the significantly enriched pathways in DPEP1-KO Ad/ACA cells, which are negatively regulated WNT signaling pathways. (F) Dot plot of DNA repair genes in WT and DPEP1-KO groups in goblet cells (Msh2 P = 1.2 × 10⁻³; Msh6 P = 6.3 × 10⁻²). Padj, adjusted P value; EECs, enteroendocrine cells.
Figure 5
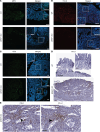
Figure 5. DPEP1-KO mice display features of microsatellite instability in epithelial cells.
Representative immunofluorescence images for WT Ads and DPEP1-KO ACAs stained for (A) MSH6 and β-catenin or (B) MSH2 or (C) AQP5 and merged with DAPI staining. Scale bars: 100 μm. Representative images are a result of staining tumors from 2 cohorts described in the Methods, where experiments were done in triplicate from WT (n = 12) and DPEP1-KO (n = 10) tumors.
Figure 6
Figure 6. DPEP1-KO mice present with immune-related features of microsatellite instability.
Representative immunofluorescence images for WT Ads and DPEP1-KO ACAs stained for (A) MPO, (B) H3-cit, and (C) CD8 merged with DAPI staining. Scale bars: 100 μm. (D and E) Representative PD-L1 IHC staining for WT Ads and DPEP1-KO ACAs. Scale bars: 150 μm (D) and 50 μm (E and insets in D). Representative images are a result of staining tumors from 2 cohorts described in the Methods, where experiments were done in triplicate from WT (n = 12) and DPEP1-KO (n = 10) tumors.

References

    1. Dekker E, et al. Colorectal cancer. Lancet. 2019;394(10207):1467–1480. doi: 10.1016/S0140-6736(19)32319-0. - DOI - PubMed
    1. Fearon ER, Vogelstein B. A genetic model for colorectal tumorigenesis. Cell. 1990;61(5):759–767. doi: 10.1016/0092-8674(90)90186-I. - DOI - PubMed
    1. Buckhaults P, et al. Secreted and cell surface genes expressed in benign and malignant colorectal tumors. Cancer Res. 2001;61(19):6996–7001. - PubMed
    1. Habib GM, et al. Leukotriene D4 and cystinyl-bis-glycine metabolism in membrane-bound dipeptidase-deficient mice. Proc Natl Acad Sci U S A. 1998;95(9):4859–4863. doi: 10.1073/pnas.95.9.4859. - DOI - PMC - PubMed
    1. Campbell BJ, et al. Specificity and inhibition studies of human renal dipeptidase. Biochim Biophys Acta. 1988;956(2):110–118. doi: 10.1016/0167-4838(88)90256-7. - DOI - PubMed