. 2025 Apr 3;135(11):e184115.
doi: 10.1172/JCI184115. eCollection 2025 Jun 2.

SOX9 suppresses colon cancer via inhibiting epithelial-mesenchymal transition and SOX2 induction

Affiliations

SOX9 suppresses colon cancer via inhibiting epithelial-mesenchymal transition and SOX2 induction

Ying Feng et al. J Clin Invest. .

Abstract

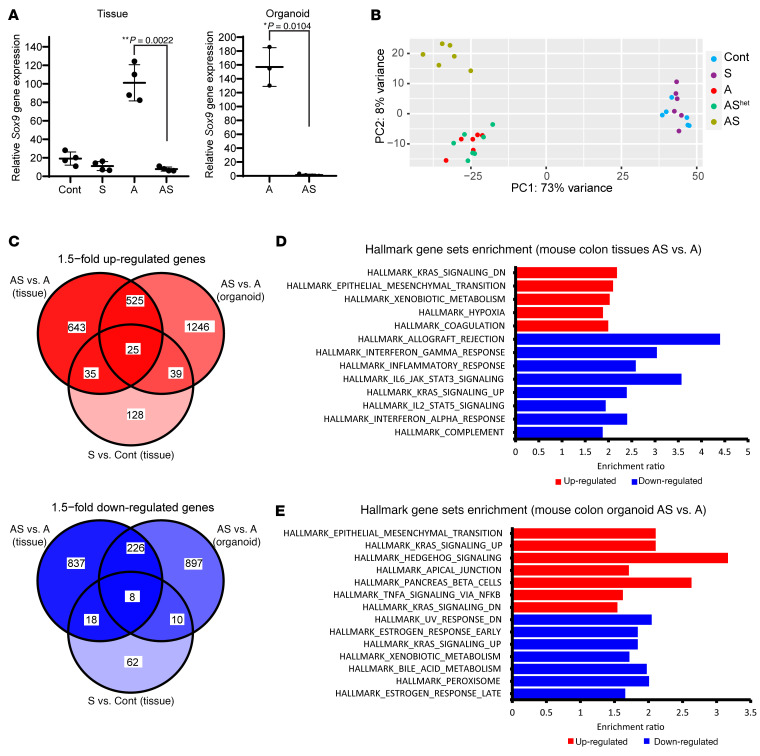
The Wnt/β-catenin pathway regulates expression of the SOX9 gene, which encodes sex-determining region Y-box (SOX) transcription factor 9, a differentiation factor and potential β-catenin regulator. Because APC tumor suppressor defects in approximately 80% of colorectal cancers (CRCs) activate the Wnt/β-catenin pathway, we studied SOX9 inactivation in CRC biology. Compared with effects of Apc inactivation in mouse colon tumors, combined Apc and Sox9 inactivation instigated more invasive tumors with epithelial-mesenchymal transition (EMT) and SOX2 stem cell factor upregulation. In an independent mouse CRC model with combined Apc, Kras, and Trp53 defects, Sox9 inactivation promoted SOX2 induction and distant metastases. About 20% of 171 human CRCs showed loss of SOX9 protein expression, which correlated with higher tumor grade. In an independent group of 376 patients with CRC, low SOX9 gene expression was linked to poor survival, earlier age at diagnosis, and increased lymph node involvement. SOX9 expression reductions in human CRC were linked to promoter methylation. EMT pathway gene expression changes were prominent in human CRCs with low SOX9 expression and in a mouse cancer model with high SOX2 expression. Our results indicate SOX9 has tumor suppressor function in CRC; its loss may promote progression, invasion, and poor prognosis by enhancing EMT and stem cell phenotypes.

Keywords: Colorectal cancer; Gastroenterology; Genetics; Mouse models; Oncology; Tumor suppressors.


Conflict of interest statement

Conflict of interest: The authors have declared that no conflict of interest exists.

Figures

Figure 1
Figure 1. Morphological changes in colon epithelium in mice with inactivation of Sox9 (S), Apc (A), or both Apc and Sox9 (AS).
H&E staining (left) and IHC staining for SOX9 (middle) and β-catenin (right) in proximal colon tissues from S, A, and AS mice, along with a Cre-negative littermate control (Cont) at 35 days after 2 daily doses of TAM to induce Cre-mediated gene targeting. For each mouse, representative images with low magnification (top rows) and corresponding boxed areas at high magnification (directly below) are presented. The dashed lines indicate the muscularis mucosae. Scale bars: 100 μM for low-magnification images; 20 μM for high-magnification images.
Figure 2
Figure 2. Mouse colon lesions with combined Apc and Sox9 inactivation had enhanced dysplastic changes and invasive features compared with lesions with Apc inactivation.
(A) H&E staining of proximal colon tissues from a control (Cont) mouse and mice with Apc inactivation (A) or Apc and Sox9 inactivation (AS), at 35 days after TAM injection for gene inactivation. Representative photomicrographs of low-power magnification are shown in the left panels. The right panels represent high-power magnification of the boxed areas from the left panels, with insets highlighting epithelial features. Scale bars: 50 μm for both low- and high-magnification images; 10 μm for insets. (B) Immunofluorescence staining of E-cadherin (red) and occludin (green), counterstained with Hoechst 33342 (blue) to mark nuclei, in colon tissues from the mice described in A. Scale bars: 50 μm for low magnification images (left); 10 μm for high magnification images (right). (C) Photomicrographs of H&E-stained colon sections show noninvasive polypoid lesions in an A mouse (left) and emerging invasive foci in an AS mouse (right), taken at 35 days and 29 days, respectively, after TAM injection. The dashed lines delineate the muscularis mucosae. Scale bars: 50 μm. (D) Diagram of mouse intestinal tract and 6 independent surgical sampling areas (each 10–20 mm long and 5 mm wide) from ileum, cecum, proximal colon, and mid-colon where invasion was assessed. (E) Quantification of invasive foci per mouse in colon, cecum, and ileum tissues from the surgical areas described in D for A mice (n = 9), AShet mice (n = 6), and AS mice (n = 13) at 28–40 days after TAM injection. Invasive foci were counted in all 6 surgical areas from each mouse (1 tissue section per area). ****P < 0.0001 (Welch’s t test: AS mice versus A mice); the data are shown as mean ± SD.
Figure 3
Figure 3. Proliferation and apoptosis changes in mouse colon epithelium with Apc (A) and/or Sox9 inactivation (AS and S).
(A) IHC staining for BrdU in proximal colon of an S mouse at 125 days after TAM injection and a Cre-negative control (Cont). Scale bars: 50 μM. (B) Quantification of proliferating (BrdU-positive) cells per crypt from S (120–140 days after TAM, n = 6) and Cont mice (n = 5). Solid shapes represent the mean BrdU-positive cells per crypt for each mouse; smaller shapes represent individual values per crypt (15–59 crypts/mouse). **P = 0.0012 (Student’s t test, S vs. Cont). (C) Length of colon crypts from the mice in B, plus 1 additional AS mouse. Solid shapes represent the mean crypt length for each mouse; smaller shapes represent individual crypt lengths (12–30 crypts/mouse). *P = 0.0105 (Student’s t test, S vs. Cont). Scatter plots in B and C show mean ± SD. (D) Representative IHC staining for BrdU in proximal colon of A, AS, and Cont mice 35 days after TAM. Scale bars: 100 μM. (E) BrdU-positive cells as a percentage of total cells in proximal colon of A (n = 5), AS (n = 5), and Cont mice (n = 2) 33–37 days after TAM. *P = 0.045 (Student’s t test, AS vs. A). Data are shown as mean ± SD. (F) TUNEL assay in proximal colon of S, A, AS, and Cont mice 35 days after TAM. Arrows indicate apoptotic cells in S and Cont tissues. Scale bars: 20 μM. (G) TUNEL-positive apoptotic cells as a percentage of total cells in proximal colon of S (n = 8), A (n = 5), AS (n = 5), and Cont (n = 8) mice. *P = 0.01 (AS vs. A) and **P = 0.004 (S vs. Cont) from Student’s t test. Data are shown as mean ± SD.
Figure 4
Figure 4. Differential gene expression in mouse primary colon tissues and organoids with Sox9 inactivation.
(A) Sox9 gene expression was assessed by qRT-PCR in mouse proximal colon tissues from control mice (Cont) and S, A, and AS mice at 27–40 days after TAM dosing for gene targeting (n = 4 for each group). Sox9 gene expression was also assessed by qRT-PCR in organoids derived from proximal colon of A (n = 3) and AS mice (n = 4). Gene expression was normalized to β-actin expression. **P = 0.0022 for colon tissue by Welch’s t test; *P = 0.0104 for organoids in AS versus A comparison; data are shown as mean ± SD. (B) Global gene expression analyses were performed with RNAs from colon tissues of Cont, S, A, AShet, and AS mice at 27–40 days following TAM treatment (n = 6 for each genotype except n = 7 for AShet). Principal component analysis showed colon tissue of AS mice had distinct global gene expression patterns compared with that in Cont, A, and AShet mice. However, no separation was observed between S and Cont mice or between A and AShet mice. (C) Venn diagram of differentially expressed genes in mouse colon tissues and organoids for the comparisons of AS versus A (tissues and organoids) and S versus Cont (tissues). Both upregulated (red) and downregulated (blue) genes induced by Sox9 inactivation (fold change > 1.5, adjusted P ≤ 0.05) are shown. (D and E) Hallmark gene sets (FDR < 0.05) that are overrepresented in the upregulated (red) and downregulated (blue) genes in mouse colon tissues (D) and colon organoids (E) from AS versus A mice following TAM treatment.
Figure 5
Figure 5. Reduced expression of E-cadherin and increased expression of SOX2 and vimentin in mouse colon epithelium with Sox9 inactivation.
(A) IHC staining for E-cadherin in proximal colon tissues of Cont, A, and AS mice at 35 days after TAM treatment, and an S mouse at 125 days after TAM treatment. Representative images with low (top row) and high (bottom row) magnifications for each mouse are shown. Asterisks denote SOX9-positive crypts that show incomplete gene targeting in the S mouse. (B) Representative photomicrographs of IHC staining for SOX9, E-cadherin, and vimentin in mouse colon organoids derived from A and AS mice after TAM treatment. (C) IHC staining for SOX2 in mouse proximal colon tissues of Cont, A, and AS mice at 31 days after TAM treatment, and an S mouse at 70 days after TAM treatment. (D) Representative photomicrographs of IHC staining for SOX2 in mouse colon organoids as described in B. Scale bars for A and C: 100 μM for low magnification image (top); 20 μM for high magnification images (bottom). Scale bars for B and D: 50 μM; 20 μM for insets.
Figure 6
Figure 6. SOX9 protein expression and SOX9 gene methylation status in CRC primary tissues and selected cell lines.
(A) Representative photomicrographs of IHC staining for SOX9 in normal human colon tissue showing nuclear SOX9 expression in crypt base cells. The image is shown with low magnification for the entire colon crypts; boxed areas for lumen and crypt base regions are also shown as high magnification (middle and bottom panels). (BF) Representative photomicrographs of IHC staining for SOX9 in CRCs in a human tissue microarray, with different IHC scores of (B) 0, (C) +/–, (D) 1+, (E) 2+, and (F) 3+. The images with low magnification (left) and their corresponding boxed areas with high magnification (right) are displayed for each CRC. Scale bars: 100 μM (low magnification), 20 μM (high magnification). (G) Immunoblot analysis for SOX9 in human colon cancer cell lines, with β-actin as a loading and transfer control. (H) Diagram of CpG islands in the SOX9 promoter and first exon, and locations of primers for bisulfite sequencing (F1/R1, F2/R2, F3/R3). Lollipop diagrams of bisulfite sequencing of SOX9 at the indicated regions (relative to the +1 transcription start site) in HT29 and RKO cells are shown with black lollipops for methylated CpGs and white for unmethylated. At least 5 clones were sequenced for each primer pair, and methylation of an individual CpG dinucleotide was confirmed in at least 2 clones. (I) RKO cells were treated with vehicle (0) or treated with 1 μM or 5 μM 5-Aza-2′-deoxycytidine (5-AzaD) for 3 days to induce DNA demethylation. During the third day of treatment with vehicle or 5-AzaD, cells were further incubated with vehicle or 0.5 μM trichostatin A (TSA) for 24 hours. SOX9 expression in the cells was assessed by immunoblot, with β-actin as a loading and transfer control.
Figure 7
Figure 7. Multivariate analysis of overall survival in patients with CRC.
The forest plots display the results of multivariate Cox proportional hazards models for OS, including SOX9 gene expression (log2-transformed), age at diagnosis, sex, local invasion depth, lymph node involvement, and tumor site as covariates, in all patients with CRC from the TCGA Colon and Rectal Cancer (COADREAD) cohort (n = 370) (A), and patients without MSI-H from the same cohort (n = 284) (B). The square represents estimated HR, and the length of the horizontal line represents the 95% CI for the HR of each covariate. P values for individual covariates were obtained using the Wald test (column on the far right). Statistical significance is indicated by asterisks: *P < 0.05; **P < 0.01; ***P < 0.001.

References

    1. Sung H, et al. Global cancer statistics 2020: GLOBOCAN estimates of incidence and mortality worldwide for 36 cancers in 185 countries. CA Cancer J Clin. 2021;71(3):209–249. doi: 10.3322/caac.21660. - DOI - PubMed
    1. Fearon ER. Molecular genetics of colorectal cancer. Annu Rev Pathol. 2011;6:479–507. doi: 10.1146/annurev-pathol-011110-130235. - DOI - PubMed
    1. Aoki K, Taketo MM. Adenomatous polyposis coli (APC): a multi-functional tumor suppressor gene. J Cell Sci. 2007;120(pt 19):3327–3335. doi: 10.1242/jcs.03485. - DOI - PubMed
    1. Mosimann C, et al. Beta-catenin hits chromatin: regulation of Wnt target gene activation. Nat Rev Mol Cell Biol. 2009;10(4):276–286. doi: 10.1038/nrm2654. - DOI - PubMed
    1. Polakis P. The many ways of Wnt in cancer. Curr Opin Genet Dev. 2007;17(1):45–51. doi: 10.1016/j.gde.2006.12.007. - DOI - PubMed

MeSH terms