. 2025 Apr 3;21(4):e1012945.
doi: 10.1371/journal.ppat.1012945. eCollection 2025.

The evolution of antibiotic resistance in Europe, 1998-2019

Affiliations

The evolution of antibiotic resistance in Europe, 1998-2019

Martin Emons et al. PLoS Pathog. .

Abstract

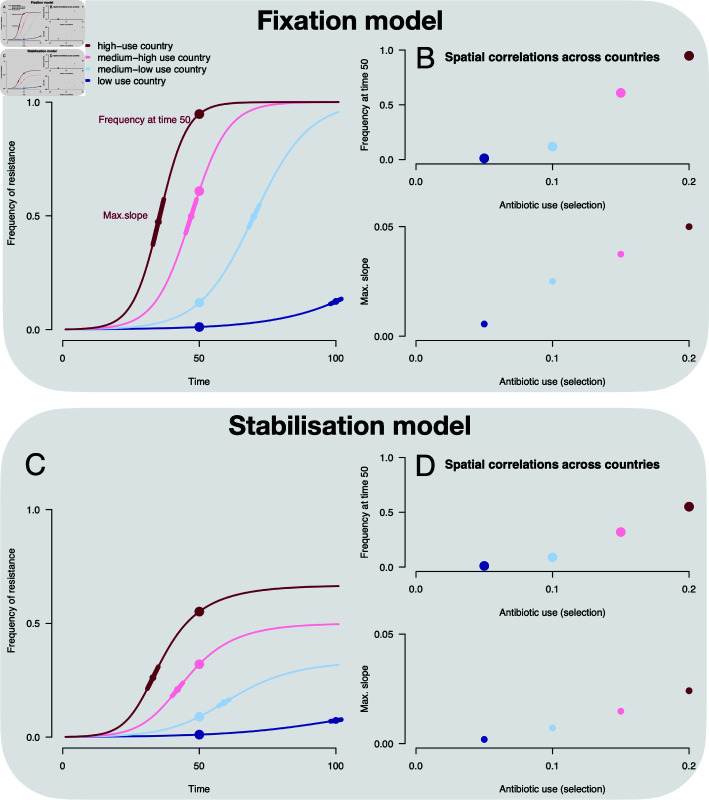
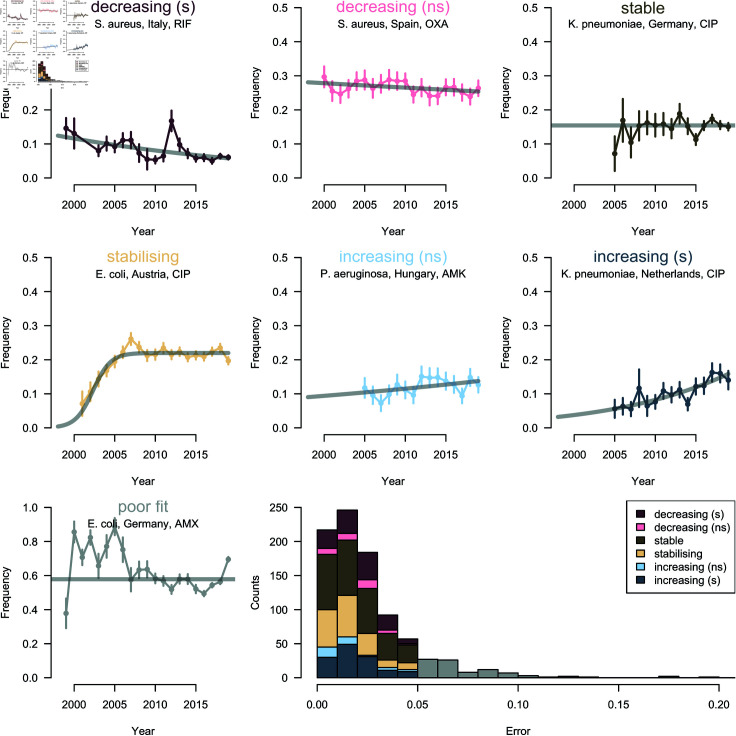
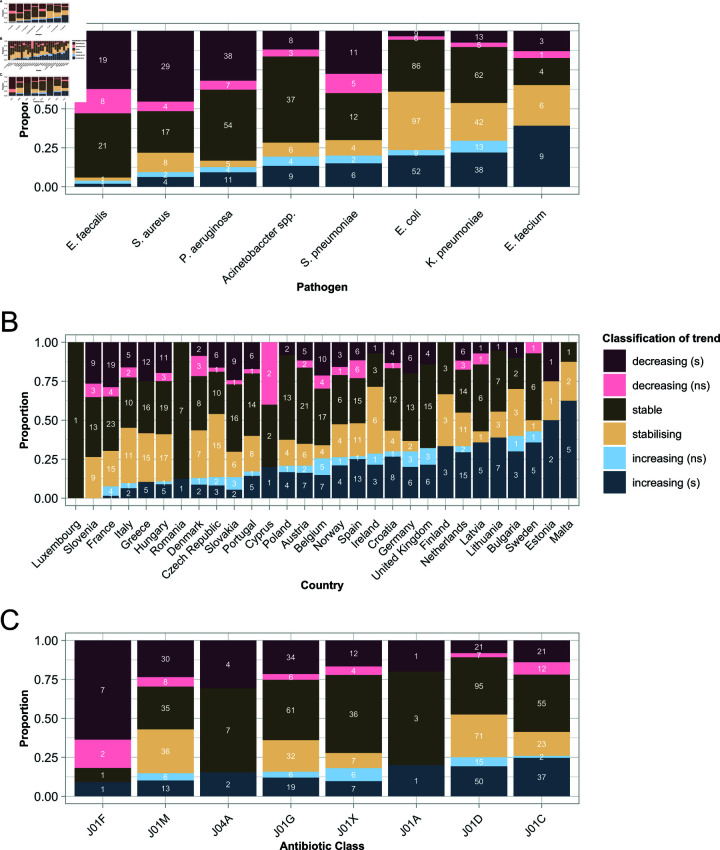
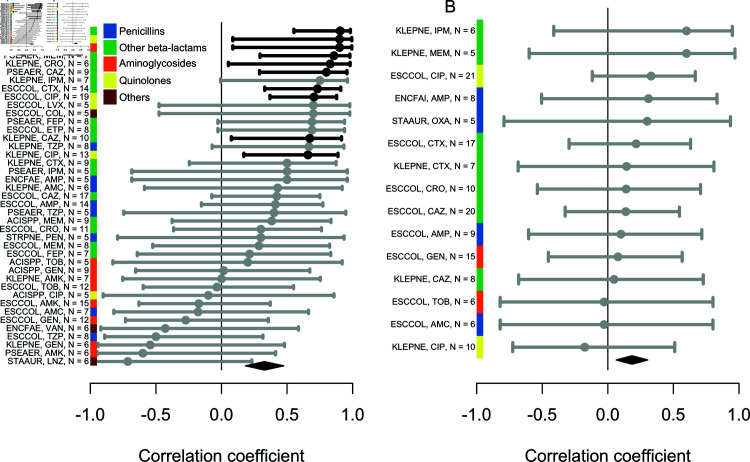
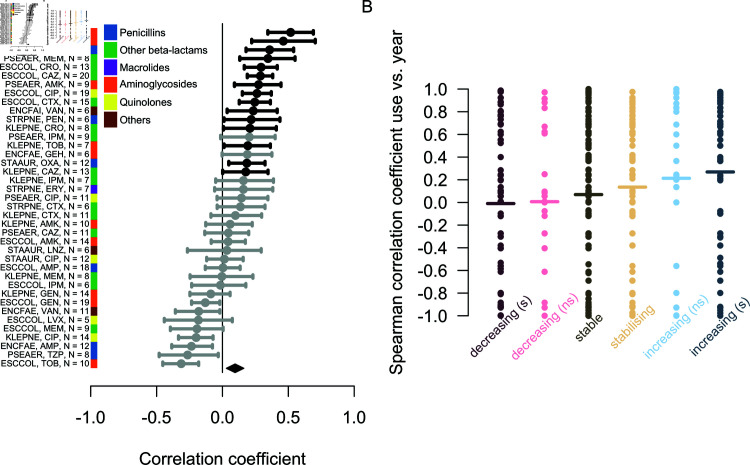
The evolutionary dynamics of antibiotic resistance are not well understood, particularly the long-term trajectories of resistance frequencies and their dependence on antibiotic consumption. Here, we systematically analyse resistance trajectories for 887 bug-drug-country combinations in Europe across 1998-2019, for eight bacterial species with a considerable resistance-associated public health burden. Our analyses support a model in which, after an initial increase, resistance frequencies reach a stable intermediate equilibrium. The plurality (37%) of analysed trajectories were best described as 'stable' (neither increasing nor decreasing). 21% of trajectories were best described as 'stabilising' - i.e. showing a transition from increasing frequency to a stable plateau; 21% as decreasing and 20% as increasing. The antibiotic consumption in a country predicts both the equilibrium frequency of the corresponding resistance and the speed at which this equilibrium is reached. Moreover, we find weak evidence that temporal fluctuations in resistance frequency are driven by temporal fluctuations in hospital antibiotic consumption. A large fraction of the variability in the speed of increase and the equilibrium level of resistance remains unexplained by antibiotic use, suggesting other factors may also drive resistance dynamics. Overall, our results indicate that ever increasing antibiotic resistance frequencies are not inevitable.


Conflict of interest statement

The authors have declared that no competing interests exist.

Figures

Fig 1
Fig 1. Schematic of fixation (A, B) and stabilisation (C, D) models of resistance dynamics. The different colours represent different strengths of selection pressure applied in different countries. (A) and (C) show the predicted temporal trajectories for each of the models. In the fixation model (A), resistance frequencies increase to 100% following a logistic trend, with the slope of the logistic curve reflecting the strength of selection (i.e. selection coefficient in units of time-1 [27]). A simple epidemiological model predicts a constant selection coefficient equal to the antibiotic consumption rate minus the cost of antibiotic resistance [16]. In contrast, balancing selection leads to a stabilising trend (C), with resistance frequencies plateauing below 100%. A number of candidate mechanisms lead to balancing selection, but no clear consensus has been reached on a definitive model. (B, D): If we suppose that different strengths of selection correspond to antibiotic use in different countries, both models generate a positive correlation across countries between the frequency of resistance (here at time 50, materialised by points on A, C) and antibiotic use, as well as between the maximum slope of resistance increase (tangents on A, C) and use.
Fig 2
Fig 2. Example trajectories of antibiotic resistance illustrating the different categories. One example (a specific country-bug-drug combination) is shown for each category in the eight panels. The points are the data, the bars are 95% binomial confidence intervals. In the panel titles, ‘s’ and ‘ns’ stand for significant and non-significant (at the p<0.05 level), respectively. The last panels shows the distribution of errors for each category, for all country-bug-drug combinations. Error is quantified as the mean of the absolute value of the deviation between model predicted and actual resistance frequency. Trajectories with poor fit (i.e. error above 0.05), coloured grey on the plot, are excluded from further analysis. Abbreviated antibiotic names are the following: RIF: Rifampicin, OXA: Oxacillin, CIP: Ciprofloxacin, AMK: Amikacin, AMX: Amoxicillin.
Fig 3
Fig 3. Proportion of trajectories falling into each temporal trend category, by species (A), country (B) and antibiotic class (C). The antibiotic categories are: J01A - tetracyclines, J01C - penicillins, J01D - other betalactams, J01F - macrolides, J01G - aminoglycosides, J01M - quinolones, J01X - others, J04A - drugs for treatment of tuberculosis. The numbers give the actual sample size of trajectories in each category, that is drug-country, bug-drug, bug-country for panels A, B, C respectively. This figure does not correct for correlations among the categories (e.g. some species being more frequently sampled in some countries). A corrected analysis is presented in S1 Text and is consistent with the information presented here.
Fig 4
Fig 4. Correlation (Spearman’s rho) across countries between (A) the plateau frequency of antibiotic resistance, or (B) rate of increase, and the rate of use of the corresponding antibiotic in the community, for all bug-drug combinations. Significantly positive correlations at the 0.05 level are shown in black, others in grey. The abbreviations on the y-axis indicate the species (ACISPP = Acinetobacter spp, ENCFAE = Enterococcus faecalis, ENCFAI = Enterococcus faecium, ESCCOL = Escherichia coli, KLEPNE = Klebsiella pneumoniae, PSEAER = Pseudomonas aeruginosa, STAUR = Staphylococcus aureus) and antibiotic (see Methods for meanings) each correlation is for. The N number indicates the number of countries included for each combination. The black diamond shows the overall mean and 95% confidence interval. Trends are similar when considering hospital instead of community use (Fig I in S1 Text).
Fig 5
Fig 5. Temporal variation in hospital antibiotic use as a predictor of temporal variation in antibiotic resistance. (A), the correlation across years (Spearman’s rho) between the frequency of resistance and hospital antibiotic use in the same year across bug-drug combinations. Correlations across years significantly positive at the 0.05 level are shown in black, others in grey. The number of countries included is indicated for each combination. The black diamond shows the overall mean and 95% confidence interval. (B), the distribution of temporal trends in antibiotic consumption in hospitals for each category of trend in resistance. The horizontal line shows the mean.

Similar articles

Cited by

References

    1. Murray CJ, Ikuta KS, Sharara F, Swetschinski L, Aguilar GR, Gray A, et al.. Global burden of bacterial antimicrobial resistance in 2019: a systematic analysis. Lancet 2022;399(10325):629–55. doi: 10.1016/S0140-6736(21)02724-0 - DOI - PMC - PubMed
    1. Witzany C, Bonhoeffer S, Rolff J. Is antimicrobial resistance evolution accelerating?. PLoS Pathog 2020;16(10):e1008905. doi: 10.1371/journal.ppat.1008905 - DOI - PMC - PubMed
    1. McCormick AW, Whitney CG, Farley MM, Lynfield R, Harrison LH, Bennett NM, et al.. Geographic diversity and temporal trends of antimicrobial resistance in Streptococcus pneumoniae in the United States. Nat Med 2003;9(4):424–30. doi: 10.1038/nm839 - DOI - PubMed
    1. McDonald LC. Trends in antimicrobial resistance in health care-associated pathogens and effect on treatment. Clin Infect Dis. 2006;42(Suppl 2):S65–71. doi: 10.1086/499404 - DOI - PubMed
    1. Siira L, Rantala M, Jalava J, Hakanen AJ, Huovinen P, Kaijalainen T, et al.. Temporal trends of antimicrobial resistance and clonality of invasive Streptococcus pneumoniae isolates in Finland, 2002 to 2006. Antimicrob Agents Chemother 2009;53(5):2066–73. doi: 10.1128/AAC.01464-08 - DOI - PMC - PubMed

MeSH terms

Substances