Monitoring sodium content in packaged foods sold in the Americas and compliance with the updated regional sodium reduction targets
- PMID: 40179102
- PMCID: PMC11967937
- DOI: 10.1371/journal.pone.0304922
Monitoring sodium content in packaged foods sold in the Americas and compliance with the updated regional sodium reduction targets
Abstract
Background: Sodium reduction is a cost-effective measure to prevent noncommunicable diseases. The World Health Organization (WHO) established a target of a 30% relative reduction in mean population intake of sodium by 2025. The Pan American Health Organization (PAHO) published sodium reduction targets (SRTs) for packaged foods in 2015, expanding and updating the targets in 2021 to help Member States with its efforts in reducing population sodium intake.
Objective: This study examined the current sodium levels in packaged foods among five countries in the Americas and monitored cross-sectional and longitudinal compliance with the sodium targets from 2015 to 2022.
Methods: Food labels were systematically collected from the main supermarkets in five countries in the Americas region in 2022. Sodium levels per 100g and per kcal for collected food labels in 16 PAHO categories and 75 subcategories were analyzed and compared against the updated SRTs. Further analysis of three countries that have longitudinal data for 2015-2016, 2017-2018 and 2022 was conducted to compare sodium per 100 g against the 2015 SRTs.
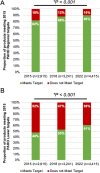
Results: A total of 25,569 food items were analyzed. Overall, 'processed meat and poultry' had the highest sodium levels, although there were large variations within categories. 47% and 45% of products met the sodium per 100g and per kcal 2022 SRTs, respectively. Peru had the highest compliance, whereas Panama had the lowest for both targets. Among Argentina, Costa Rica and Peru, the proportion of foods meeting the 2015 PAHO lower targets were 48, 53 and 61% for 2015-2016, 2017-2018 and 2022, respectively (p < 0.001).
Conclusions: This study showed that around half of the examined foods met their respective SRTs and there have been small improvements in compliance over time. Further efforts are required to reach the WHO's global sodium reduction goal by 2025, such as implementation of mandatory SRTs and front-of-pack labelling regulations.
Copyright: © 2025 Yang et al. This is an open access article distributed under the terms of the Creative Commons Attribution License, which permits unrestricted use, distribution, and reproduction in any medium, provided the original author and source are credited.
Conflict of interest statement
I have read the journal's policy and the authors of this manuscript have the following competing interests: NF is a staff member of the Global Health Advocacy Incubator. LN is a staff member of the Pan American Health Organization. The authors alone are responsible for the views expressed in this publication, and they do not necessarily represent the decisions or policies of the affiliated organizations.
Figures


References
-
- World Health Organization. WHO global report on sodium intake reduction. Geneva: World Health Organization; 2023. Report No.: CC BY-NC-SA 3.0 IGO. Available: https://www.who.int/publications/i/item/9789240069985
-
- Zhou B, Carrillo-Larco RM, Danaei G, Riley LM, Paciorek CJ, Stevens GA, et al. Worldwide trends in hypertension prevalence and progress in treatment and control from 1990 to 2019: a pooled analysis of 1201 population-representative studies with 104 million participants. Lancet. 2021;398:957–980. 10.1016/S0140-6736(21)01330-1 - DOI - PMC - PubMed
-
- World Health Organization. Guideline: sodium intake for adults and children. Geneva: World Health Organization; 2012. Available: https://apps.who.int/iris/handle/10665/77985
MeSH terms
Substances
Grants and funding
LinkOut - more resources
Full Text Sources
Medical
Miscellaneous

