. 2025 Apr 3;135(8):e181659.
doi: 10.1172/JCI181659. eCollection 2025 Apr 15.

ATM-dependent DNA damage response constrains cell growth and drives clonal hematopoiesis in telomere biology disorders

Affiliations

ATM-dependent DNA damage response constrains cell growth and drives clonal hematopoiesis in telomere biology disorders

Christopher M Sande et al. J Clin Invest. .

Abstract

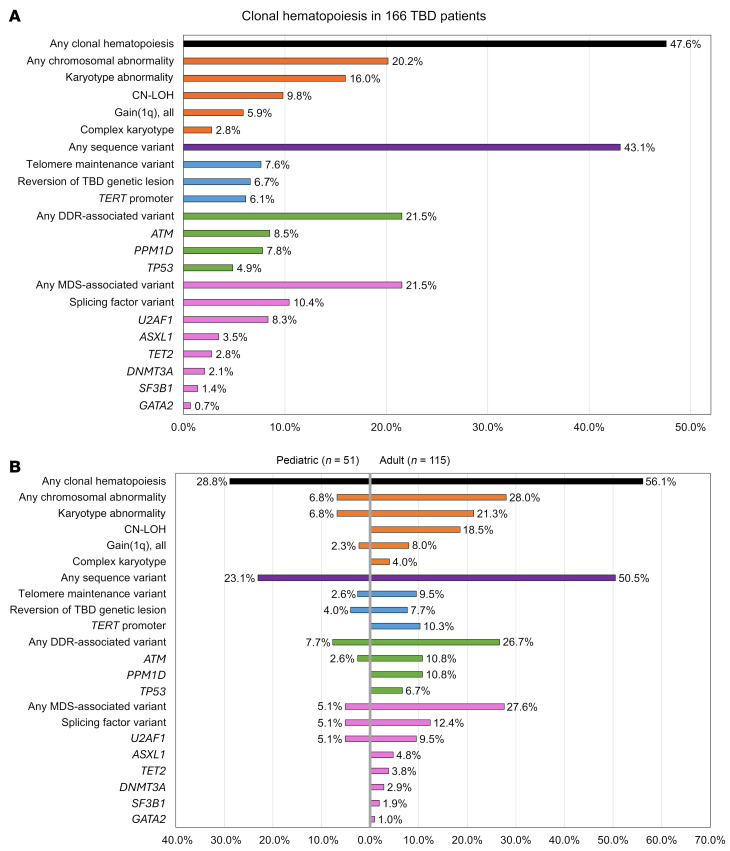
Telomere biology disorders (TBDs) are genetic diseases caused by defective telomere maintenance. TBD patients often develop bone marrow failure and have an increased risk of myeloid neoplasms. To better understand the factors underlying hematopoietic outcomes in TBD, we comprehensively evaluated acquired genetic alterations in hematopoietic cells from 166 pediatric and adult TBD patients. Of these patients, 47.6% (28.8% of children, 56.1% of adults) had clonal hematopoiesis. Recurrent somatic alterations involved telomere maintenance genes (7.6%), spliceosome genes (10.4%, mainly U2AF1 p.S34), and chromosomal alterations (20.2%), including 1q gain (5.9%). Somatic variants affecting the DNA damage response (DDR) were identified in 21.5% of patients, including 20 presumed loss-of-function variants in ataxia-telangiectasia mutated (ATM). Using multimodal approaches, including single-cell sequencing, assays of ATM activation, telomere dysfunction-induced foci analysis, and cell-growth assays, we demonstrate telomere dysfunction-induced activation of the ATM-dependent DDR pathway with increased senescence and apoptosis in TBD patient cells. Pharmacologic ATM inhibition, modeling the effects of somatic ATM variants, selectively improved TBD cell fitness by allowing cells to bypass DDR-mediated senescence without detectably inducing chromosomal instability. Our results indicate that ATM-dependent DDR induced by telomere dysfunction is a key contributor to TBD pathogenesis and suggest dampening hyperactive ATM-dependent DDR as a potential therapeutic intervention.

Keywords: Clonal selection; Hematology; Hematopoietic stem cells; Oncology; Telomeres.


Conflict of interest statement

Conflict of interest: The authors have declared that no conflict of interest exists.

Figures

Figure 1
Figure 1. Telomere lengths of the patient cohort.
Nomograms of average telomere lengths in (A) lymphocytes and (B) granulocytes obtained by flow-FISH for 70 patients in our cohort with available raw clinical telomere length measurement data (red) were plotted alongside published telomere length from healthy controls of different ages from the Johns Hopkins (n = 192) and Vancouver (n = 444) groups (81, 82), alongside the percentile curves.
Figure 2
Figure 2. Summary of CH findings in pediatric TBD patients.
Each column represents an individual patient, arranged horizontally by age (years) at the time of testing. Germline variants are detailed in the top section, CH findings in the middle section, and clinical complications in the bottom section. In each cell, the numbers indicate the numbers of unique variants in each subcategory, reflected by color shading of the following categories: germline TBD variants (yellow); somatic telomere-associated gene variants (blue); cytogenetic variants (orange); DDR-related sequence variants (green); and MDS/AML-related sequence variants (purple); all somatic variants (black); and major TBD complications (red).
Figure 3
Figure 3. Summary of CH findings in adult TBD patients, ages 22–54.
Each column represents an individual patient, arranged horizontally by age (years) at the time of testing. Germline variants are detailed in the top section, CH findings in the middle section, and clinical complications in the bottom section. In each cell, the numbers indicate the numbers of unique variants in each subcategory reflected by color shading of the following categories: germline TBD variants (yellow); somatic telomere-associated gene variants (blue); cytogenetic variants (orange); DDR-related sequence variants (green); and MDS/AML-related sequence variants (purple); all somatic variants (black); and major TBD complications (red).
Figure 4
Figure 4. Summary of CH findings in adult TBD patients, ages 54–78.
Each column represents an individual patient, arranged horizontally by age (years) at the time of testing. Germline variants are detailed in the top section, CH findings in the middle section, and clinical complications in the bottom section. In each cell, the numbers indicate the numbers of unique variants in each subcategory, reflected by colored shading of the following categories: germline TBD variants (yellow); somatic telomere-associated gene variants (blue); cytogenetic variants (orange); DDR-related sequence variants (green); and MDS/AML-related sequence variants (purple); all somatic variants (black); and major TBD complications (red).
Figure 5
Figure 5. Cooccurrence of genetic and clinical outcomes by genotype.
A cooccurrence plot with heat map indicating the percentage of tested patients of each genotype demonstrating the specified somatic abnormality or adverse TBD outcome. Patients with multiple germline variants were included both in the individual gene groups and in the multiple variant group. Entries where fewer than 5 total patients were evaluated have been shaded in light gray. A comparison of patients with and without somatic ATM variants is present in the final 2 columns. Because all patients with somatic ATM variants had CH and DDR variants, these categories are shown in dark blue. The corresponding numbers of patients with indicated findings (the numerator) and total number of patients evaluated per category (the denominator) are provided in Supplemental Figure 3.
Figure 6
Figure 6. Summary of CH findings by category and compared by age.
(A) Bar graph showing summary-level data for somatic findings with percentages including only those patients tested for the specific abnormality. (B) Comparative statistics for pediatric and adult patients. Pediatric patients include those 21 years of age and younger.
Figure 7
Figure 7. Single-cell transcriptome analysis of hematopoietic cells in TBD patients compared with healthy controls.
(A) UMAP plot of bone marrow mononuclear cells (BMMCs) from 2 healthy controls and 2 patients with TBD. (B) UMAP plot of peripheral blood mononuclear cells (PBMCs) from 4 healthy controls and 1 patient with TBD. (C) A lollipop plot of gene set enrichment analysis (GSEA) of single-cell transcriptomes in BMMCs from 2 patients with TBD compared with 2 healthy controls (left side of the panel) and in PBMCs from 1 patient with TBD compared with 4 healthy controls (right side of panel). Shown are the results demonstrating significantly dysregulated pathways (listed on the y axis) across analyzed cell clusters (shown on the x axis in BMMCs: early myeloid, hematopoietic stem cells [HPSCs], early erythroid, T cells, and in PBMCs: Monocytes, T cells). Adjusted P value is indicated by a color scale, from yellow (P = 0.000) to teal (P = 0.050) to blue (P = 0.1), with gray representing adjusted P value >0.1. The absolute enrichment score is indicated by the size of the circle, and normalized enrichment score is indicated by the direction and length of the lollipop stem. ATM-dependent DDR, Fas, and mitotic spindle pathways were upregulated across subsets, with the corresponding downregulation of pathways in S phase, DNA replication, Myc targets, and translation. (D and E) Histograms showing significant differences with a reduction in S phase and increase in G2_M and G1 phases of the cell cycle in TBD patients compared with controls in BMMCs (D) and PBMCs (E). ***P < 0.001. (F) UMAP plot of BMMCs showing expression of ATM in patients versus controls.
Figure 8
Figure 8. Increased ATM target phosphorylation in TERC-mutated compared with control fibroblasts.
(A) A representative Western blot image showing phosphorylation of ATM target proteins in TERC-mutated compared with control fibroblasts. Experimental condition (+/- ATMi) and experimental induction of DDR using x-ray radiation (XRT) are shown at the top of each lane. Vinculin was used as a loading control for ATM, and GAPDH was used as a loading control for KAP1 and Chk2. (B and C) Image densitometry analysis of replicate Western blot experiments was performed in ImageJ and summarized in B for pATM/ATM, n = 4 and (C) for pKAP1/KAP1, n = 7. Quantified densitometry values for each protein were normalized to their respective loading control. The ratio of phosphorylated compared with total protein levels in each experiment, along with the summary statistics (mean and SD) are shown in bar plots. Statistical analysis was performed using 2-tailed paired t tests. (D) Quantitative analysis of average senescence-associated β-galactosidase expression, normalized per cell number in passage 10 primary skin fibroblasts from 2 non-TBD controls and 2 TBD patients bearing different TERC variants grown with or without 20 nM ATMi; (E) Shown are representative β-galactosidase staining images. (F) Quantitative analysis of average senescence-associated β-galactosidase expression, normalized per cell number, in primary skin fibroblasts from non-TBD control and a TBD patient with DKC1 mutation, alongside representative images (G), demonstrating the progressive increase in senescence-associated β-galactosidase expression with successive passages in TBD patients’ cells that is significantly alleviated by 20 nM ATMi. In DG, n = 10–16 wide-field images at 10× magnification per each condition, quantified in Fiji. Statistical analysis was performed in GraphPad Prism using 2-way ANOVA. *P < 0.05; **P < 0.01; ***P < 0.001; ****P < 0.0001.
Figure 9
Figure 9. Low-dose ATM inhibition and siRNA knockdown selectively improve growth of TBD fibroblasts.
(A and B) Results of a representative growth assay, in which low-passage primary skin fibroblasts from a TERC-mutated patient (A) or a control (B) were grown in log phase with or without ATM inhibitor (ATMi) at a range of doses from 10 to 160 nM. ATMi at low doses of 10–20 nM significantly increased growth of TERC-mutant (A) but not control fibroblasts (B). At higher doses, ATMi demonstrated dose-dependent toxicity in long-term growth assays (n = 2 independent dose-titration replicate experiments performed, each with 5 ATMi doses). (C) Representative flow cytometry results of a BrdU incorporation cycle analysis in TERC-mutated and control fibroblasts growth without ATMi (“baseline”) and with 15 nM ATMi. (D) Summary statistics of BrdU incorporation cell-cycle experiments demonstrating a significant increase in TERC-mutated fibroblasts entering S- and G2+M cell cycle phases with concomitant reductions in G1 and apoptotic (Apo) cells with ATMi (n = 6). Statistical analysis was performed using 2-tailed paired t tests, with multiple comparisons adjustment performed using the FDR, calculated using the 2-stage step-up (Benjamini, Krieger, and Yekutieli) method. *q < 0.05. (E) Representative flow cytometry results of a BrdU incorporation cycle analysis in TERC-mutated and control fibroblasts treated with siRNAs targeting ATM, nontargeting control siRNA, vehicle (lipofectamine) alone, and untreated cells. (F) Summary statistics for cell cycle analysis with ATM knockdown demonstrating a significant increase in cells entering S-phase of the cell cycle in TERC-mutated fibroblasts but not control fibroblasts treated with siRNA-targeting ATM (n = 3). Analysis done with 1-way ANOVA with the Šidák’s multiple-comparisons test. ****adjusted P < 0.0001. (G) Western blot showing successful partial knockdown of ATM with ATM-targeting siRNA but preserved levels of ATM in cells treated with nontargeting control siRNA or lipofectamine alone.
Figure 10
Figure 10. ATM protein structure with 20 somatic variants identified in TBD patients.
A diagram of ATM protein structure, showing the defined ATM domains and the 20 identified somatic variants. Variants that were identified in the same patient are shown underneath the protein structure in different colors and designated by different numbers of asterisks (*, **, ***, ****, *****), corresponding to different patients. ATM residues disrupted by more than one variant are labeled with a “hotspot” designation. The diagram was created with DOG version 2.0.1 software (79).
Figure 11
Figure 11. Longitudinal follow-up and clonal evolution in 8 patients with somatic ATM variants.
(AH) VAF graphs showing the VAF of the identified variants at each analysis time point, indicated by patient age. For patients with chromosomal abnormalities, the VAF was estimated as 0.5 times the number of cells carrying a cytogenetic abnormality. Above each of the VAF plots shown are the corresponding stylized drawings depicting the inferred or experimentally confirmed clonal structure. (AE) Shown are the longitudinal follow-up analyses for 5 patients with stable hematologic parameters and no malignant transformation. Of these, clonal structures for the patients in C and G were experimentally confirmed, and for others, the clonal structure was inferred based on variant VAFs and VAF dynamics over time. Results of single-cell DNA and protein sequencing for the patient in C are shown in Figure 9. (FH) Shown are longitudinal clonal dynamics for 3 patients with somatic ATM variants who progressed to MDS. (F) A 54-year-old with cytopenias and MDS-MLD. (G) A 60-year-old who, following a 3.4-year period of stable blood counts, developed worsening cytopenias and transformation to MDS. Clonal architecture analysis after MDS progression revealed a new subclonal acquisition of an NPM1 variant in cells with ATM p.G2891D. (H) A 60-year-old with stable blood counts for 4.5 years, after which developed worsening cytopenias and MDS progression.
Figure 12
Figure 12. Clonal architecture and hematopoietic contributions of cells with and without somatic ATM variants in peripheral blood of a TERC-mutated TBD patient analyzed using single-cell DNA and protein sequencing on the Tapestri platform.
(A) Bar graph showing the numbers of cells with the genotypes indicated on the x axis, and the cell types identified by surface protein staining on the y axis. Both of the somatic ATM variants were identified within the same clone. (B) Shown are the relative hematopoietic cell distributions of WT, ATM-mutant, and PPM1D-mutant clones, showing that ATM-mutant and PPM1D-mutant clones were highly skewed to myeloid cells, as compared with cells without either ATM or PPM1D variants. (CG) UMAP plots depicting the clone distribution of the WT, ATM-, and PPM1D-mutant cells, overlaid in C and shown separately with color coding indicating the corresponding hematopoietic cell subsets. (EG) Distribution of CD117 (immature myeloid and mast cell marker c-kit), myeloid cell marker CD11b, and T-lymphocyte cell marker CD3 expression, respectively.
Figure 13
Figure 13. Overall statistics for patients with and without MDS progression.
A bar plot illustrating the number of patients carrying somatic alterations shown on the y axis in TBD patients without hematologic malignancies (left, in blue) and corresponding number of patients where specific alterations were identified at the time of MDS/AML (right, in red). For the patient in Figure 11H, where the somatic ATM variant was not within the MDS-initiating clone, ATM was counted as non-MDS/AML for this bar plot.
Figure 14
Figure 14. Induction of DDR response in response to dysfunctional telomeres in TBD.
(A) Immunofluorescence staining of low-passage control versus TERC-mutated fibroblasts grown in log phase with and without ATMi. Cells were stained with telomere peptide nucleic acid probe (red), anti-53BP1 antibody (green), or DAPI (blue). Quantitative analysis was performed in Fiji, for 45 nuclei for each condition, with summary statistics of nuclear 53BP1 foci (B and C), telomere (D), and colocalized 53BP1 and telomere foci (E). Statistical analysis was performed using ANOVA. *P < 0.05; ****P < 0.0001.

References

    1. Revy P, et al. Genetics of human telomere biology disorders. Nat Rev Genet. 2023;24(2):86–108. doi: 10.1038/s41576-022-00527-z. - DOI - PubMed
    1. Savage SA, Niewisch MR. Duskeratosis congenita and related telomere biology disorders. In: Gene Reviews. University of Washington; 2023:NBK22301.
    1. Alter BP, et al. Cancer in the National Cancer Institute inherited bone marrow failure syndrome cohort after fifteen years of follow-up. Haematologica. 2018;103(1):30–39. doi: 10.3324/haematol.2017.178111. - DOI - PMC - PubMed
    1. Schratz KE, Armanios M. Cancer and myeloid clonal evolution in the short telomere syndromes. Curr Opin Genet Dev. 2020;60:112–118. doi: 10.1016/j.gde.2020.02.019. - DOI - PMC - PubMed
    1. Schratz KE, et al. Cancer spectrum and outcomes in the Mendelian short telomere syndromes. Blood. 2020;135(22):1946–1956. doi: 10.1182/blood.2019003264. - DOI - PMC - PubMed

Substances