. 2025 Mar 24;166(5):bqaf067.
doi: 10.1210/endocr/bqaf067.

Lipotoxicity Induces β-cell Small Extracellular Vesicle-Mediated β-cell Dysfunction in Male Mice

Affiliations

Lipotoxicity Induces β-cell Small Extracellular Vesicle-Mediated β-cell Dysfunction in Male Mice

Abhishek Roy et al. Endocrinology. .

Abstract

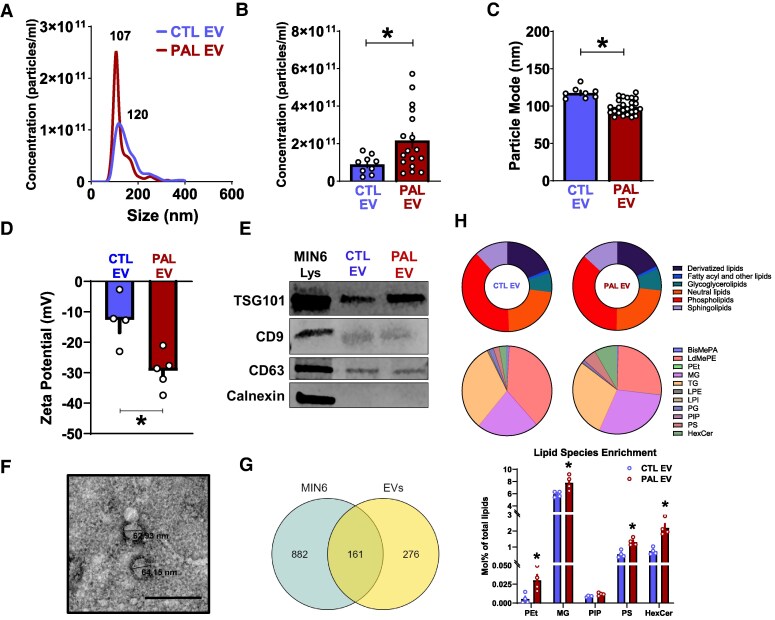
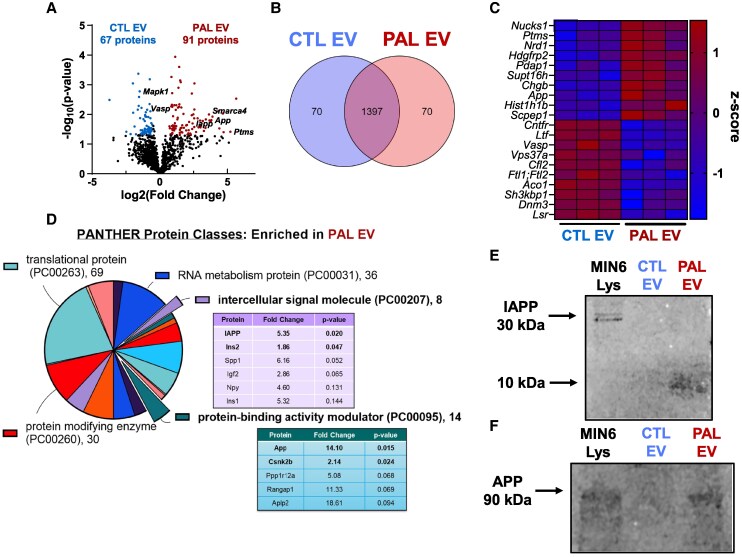
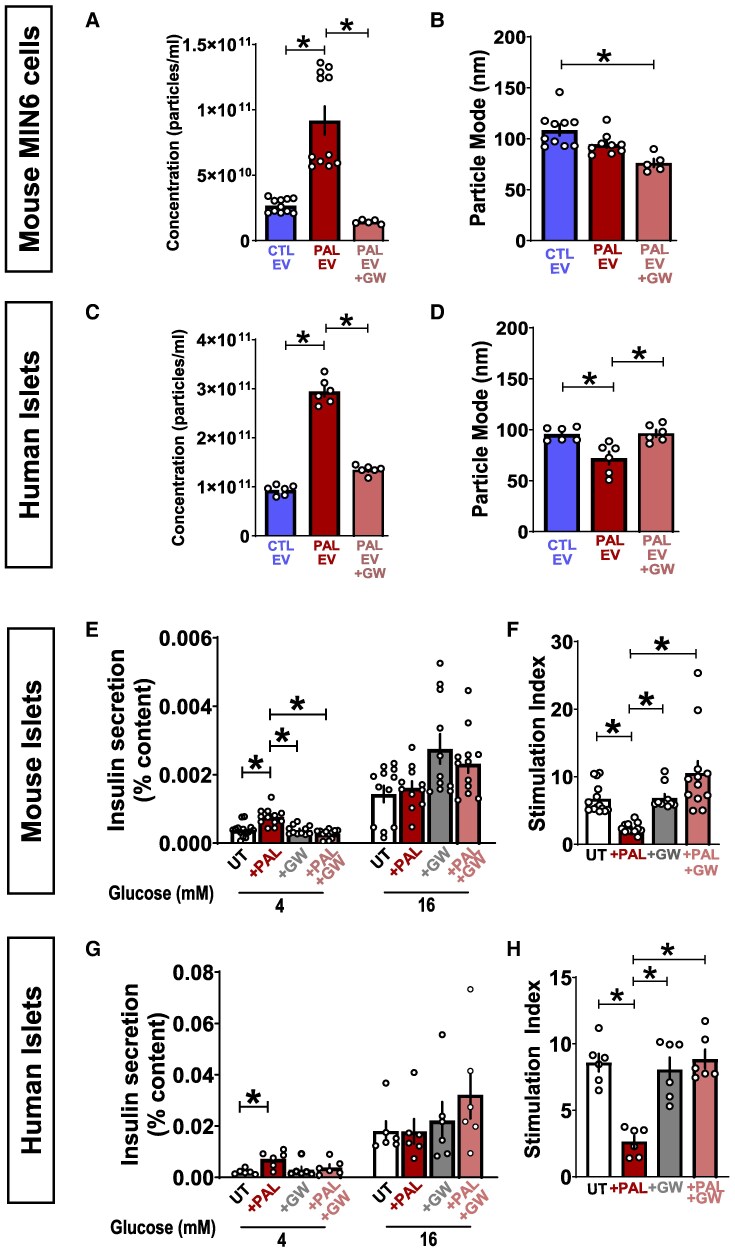
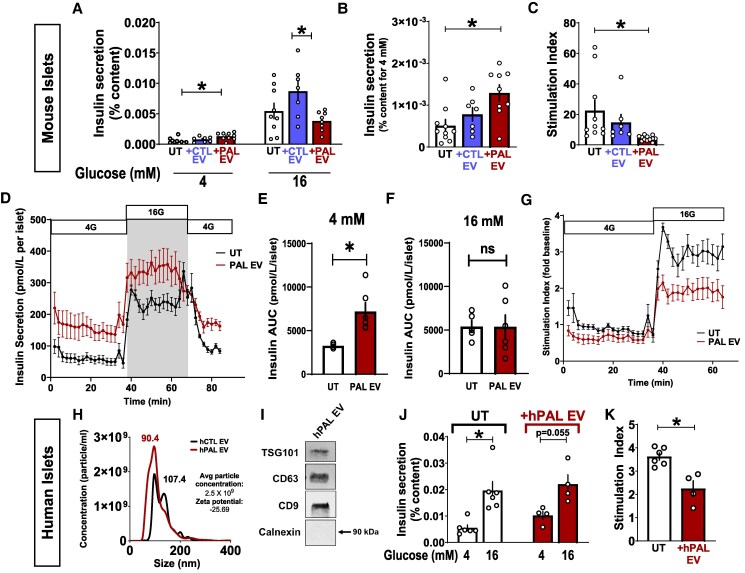
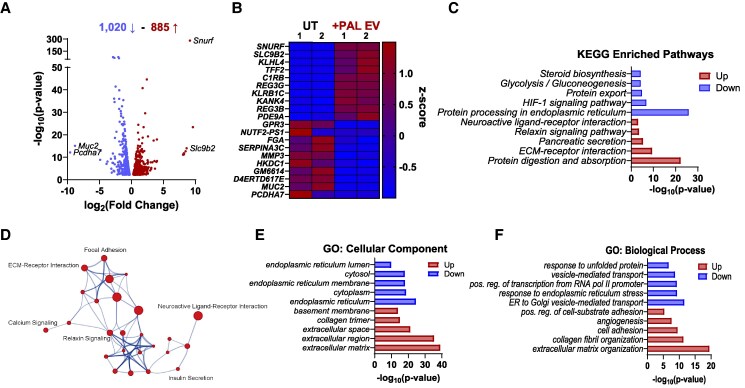
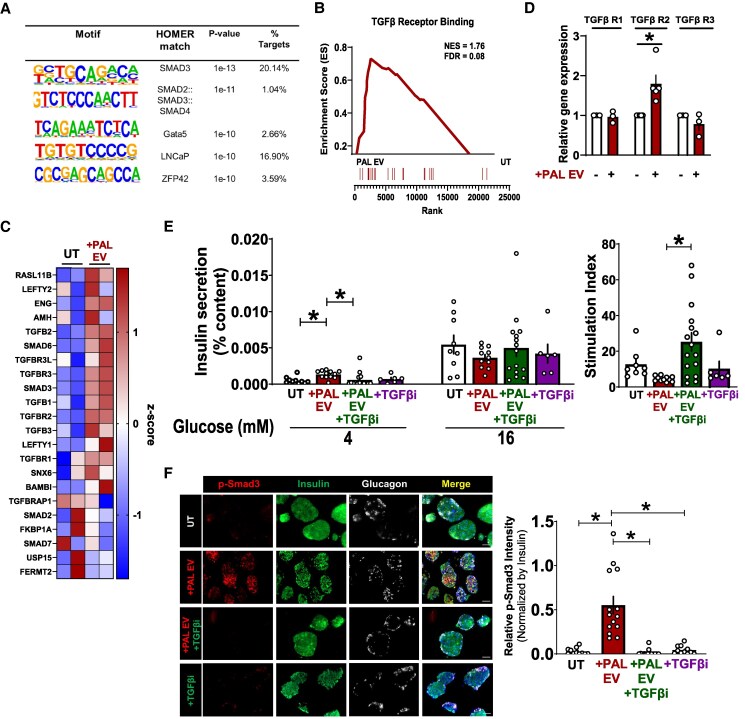
Chronically elevated circulating excess free fatty acids (ie, lipotoxicity) is a pathological process implicated in several metabolic disorders, including obesity-driven type 2 diabetes (T2D). Lipotoxicity exerts detrimental effects on pancreatic islet β-cells by reducing glucose-stimulated insulin secretion (GSIS), altering β-cell transcriptional identity, and promoting apoptosis. While β-cell-derived small extracellular vesicles (sEV) have been shown to contribute to β-cell failure in T2D, their specific role in lipotoxicity-mediated β-cell failure remains to be elucidated. In this work, we demonstrate that lipotoxicity enhances the release of sEVs from β-cells, which exhibit altered proteomic and lipidomic profiles. These palmitate (PAL)-exposed extracellular vesicles (EVs) induce β-cell dysfunction in healthy mouse and human islets and trigger significant islet transcriptional changes, including the upregulation of genes associated with the TGFβ/Smad3 pathway, as noted by RNA sequencing. Importantly, pharmacological inhibition of the TGFβI/II receptor improved PAL EV-induced β-cell dysfunction, underscoring their involvement in activating the TGFβ/Smad3 pathway during this process. We have comprehensively characterized lipotoxic β-cell sEVs and implicated their role in inducing β-cell functional failure in T2D. These findings highlight potential avenues for therapeutic interventions targeting sEV-mediated pathways to preserve β-cell health in metabolic disorders.

Keywords: diabetes; extracellular vesicles; lipotoxicity; β-cell.


Figures

Figure 1.
Figure 1.
Characterization of lipotoxicity-induced MIN6 mouse β-cell small EVs. A, Mouse MIN6 β-cell line was treated with palmitate (PAL) or control (BSA) for 24 hours and sEV were isolated from the conditioned media. Overlap of a representative Nanoparticle Tracking Analysis (NTA) graph depicting untreated (BSA) control (CTL) EV and palmitate (PAL) EV with the mode for each (120 and 110 nm, respectively). B and C, Overall quantification of particles released from CTL− (n = 9 independent isolations) and PAL EV (n = 15 independent isolations) and average mode of those particles (C). D, Zeta potential was acquired from CTL EV (n = 4) and PAL EV (n = 5) using ZetaView (Particle Matrix). E, Western blot analysis of CTL EV, PAL EV, and MIN6 lysate (control) for sEV biogenesis markers TSG101, CD9, and CD63, with Calnexin as a negative control (representative example from n = 4-10 EV blots. F, Transmission electron microscopy (TEM) of isolated PAL EV (representative example from n = 3 EV isolations); scale bar represents 100 nm. G, Venn diagram depicting unique and overlapping lipid specifies from lipidomic analysis of MIN6 EVs (n = 4/condition) vs MIN6 lysate (n = 3/condition). H, Differential expression of lipid species defined as a molecular percentage of total lipids from PAL EV vs CTL EV. Values are a mean ± SEM. Statistical significance among groups is indicated by *, P < .05.
Figure 2.
Figure 2.
Proteomic analysis of lipotoxic β-cell small EV. A, PAL EV and CTL EV were isolated upon PAL or BSA (control) treatment on MIN6 β-cell line for 24 hours. Final sEV pellets were subjected to proteomic analysis. Volcano plot depicting differentially expressed proteins in PAL EV vs CTL EV (n = 3/condition; FC > 1.5; P < .05). B, Venn diagram revealed 70 uniquely enriched proteins in both CTL EV and PAL EV with ∼1400 overlapping proteins. C, Heatmap shows top 10 upregulated and 10 downregulated proteins found in PAL EVs vs CTL EV. D, Panther Go Slim analysis of protein classes that were enriched in PAL EV are depicted in the pie chart. Inserts reveal differentially expressed proteins for “intercellular signal molecule” and “protein-binding activity modulator along with FC and P value. E and F, Western blot confirmation of differentially expressed proteins, IAPP and APP relating to β-cell function and identity in PAL EV (vs CTL EV an MIN6 lysate).
Figure 3.
Figure 3.
Small EV generation contributes to lipotoxic-mediated β-cell dysfunction. A and B, MIN6 cells were treated with PAL or PAL + GW4869 (5 μM; 24 hours) vs Control (BSA) EV and EV particle concentrations (A) and mode (B) were assessed using NTA (n = 5-11 independent EV isolations). C and D, Healthy human cadaveric islets were treated with PAL or PAL + GW4869 (5 μM; 24 hours) vs Control (BSA) EV. Particle concentration and mode were assessed using NTA (n = 6 individual videos/treatment). E and F, C57BL/6L mouse islets were treated with palmitate (PAL; 0.5 mM) ± GW4869 for 24 hours. Static glucose stimulated insulin secretion (GSIS) was assessed at 4 mM basal and 16 mM stimulatory glucose concentrations and insulin stimulation index is expressed as 16 mM glucose divided by 4 mM basal concentrations (n = 10-14 independent experiments per condition). G and H, Healthy human islets were treated with 0.5 mM PAL ± GW4869 (5 μM) for 24 hours and static GSIS was conducted. Insulin stimulation index is depicted as 16 mM stimulatory values divided by 4 mM basal values (n = 6 independent experiments per condition).
Figure 4.
Figure 4.
Lipotoxic-induced β-cell small EVs induce β-cell dysfunction. A-C, C57BL/6L mouse islets were treated with 2 × 109 particles (either CTL EV or PAL EV) each day for 48 hours. Static GSIS was conducted along with determination of insulin stimulation index (C; n = 7-12 independent experiments per condition). B, 4 mM insulin secretion values to show a significant enhancement with PAL EV addition vs CTL EV and UT islets. D, For islet perifusion, C57BL/6L mouse islets were treated with 2 × 109 particles each day for 48 hours (vs UT islets) and islet perifusion was performed at 4 mM basal glucose (0-40 minutes), 16 mM glucose (42-64 minutes), and 4 mM (66-84 minutes). Samples were taken at 2 minutes intervals with n = 3-5 independent experiments per condition. E and F, Area under the curve (AUC) graphs calculated for 4 mM (E) and 16 mM (F) insulin values. G, Stimulation index (SI) calculated based on average baseline values for UT or PAL EV treated islets. H, Representative NTA graph for hPAL EV and hCTL EV depicting concentration (particles/mL) by size (nm), average particle concentration, and zeta potential (n = 2 isolations conducted). I, Western blot analysis depicting expression of sEV biogenesis markers TSG101, CD9, CD63 in a representative hPAL EV sample with the absence of Calnexin. J and K, Static GSIS of hPAL EV exposure to healthy human islets with n = 4-6 independent experiments per condition. Values are a mean ± SEM. Statistical significance among groups is indicated by *, P < .05.
Figure 5.
Figure 5.
Islet transcriptome alterations upon antecedent exposure to lipotoxic β-cell small EVs. A, C57BL/6L mouse islets were exposed to PAL EV (2 × 109 EV/day; 48 hours) vs UT islets (n = 2 biological repeats per condition). RNA-sequencing was conducted, and volcano plot depicts differentially expressed genes (FC > 1.5; P < .05) where 885 genes were found to be upregulated and ∼1000 genes downregulated upon PAL EV addition to islets. B, Heatmap shows normalized topmost upregulated and downregulated transcripts in PAL EV treated vs UT islets. C, KEGG pathway analysis was conducted showing top 4 most upregulated and downregulated pathways (P < .05). D, Significantly enriched KEGG pathways (C) show interactions through in silico pathway analysis such as Focal Adhesion and ECM Receptor Interaction. Size of the node denotes the number of transcripts associated with the pathway. E and F, Gene ontology (GO) analysis for Cellular Component and Biological Processes reveal both up- and downregulated gene transcripts associated with ECM organization (up) and endoplasmic reticulum processes (down) (P < .05).
Figure 6.
Figure 6.
Lipotoxic β-cell-derived small EVs activate the TGFβ-Smad3 pathway. A, De novo motif analysis using HOMER was used to assess transcription factor motifs that were enriched in upregulated genes found in the RNA-seq data (PAL EV vs UT). Topmost enriched transcription factor binding sites in PAL EV-treated mouse islets were those from the TGFβ/Smad3 pathway including: Smad2, Smad3, Smad4 (P < .05). B, Gene set enrichment analysis (GSEA) was conducted on a subset of genes that regulate TGFβ Receptor Binding (FDR = 0.08) that was found to be enriched in PAL EV treated islets (vs UT). C, Heatmap depicts the specific enriched gene transcripts in PAL EV treated islets that are associated with TGFβ Receptor Binding from the GSEA (B). D, Gene expression analysis using qRT-PCR to confirm expression of Tgfβr1, Tgfβr2, and Tgfβr3 (n = 3-5 independent experiments per condition). E, C57BL/6L mouse islets were exposed to PAL EV (2 × 109 EV/day; 48 hours), TGFβi only, or PAL EV + TGFβi (TGFβ receptor I/II inhibitor [1μM; LY2109761]); vs UT islets. Static GSIS was conducted along with insulin stimulation index (n = 8-16 independent experiments conducted per condition). F, Immunofluorescence staining was conducted on mouse islets exposed to PAL EV (2 × 109 EV/day; 48 hours) or PAL EV + TGFβi (TGFβ receptor I/II inhibitor [1µM; LY2109761]); vs UT islets. Relative p-Smad3 intensity was quantified using ImageJ software and normalized to insulin expression. Values are mean ± SEM. Statistical significance among groups is indicated by *, P < .05.

References

    1. Kahn SE, Cooper ME, Del Prato S. Pathophysiology and treatment of type 2 diabetes: perspectives on the past, present, and future. Lancet. 2014;383:1068‐1083. - PMC - PubMed
    1. Kahn SE, Zraika S, Utzschneider KM, Hull RL. The beta cell lesion in type 2 diabetes: there has to be a primary functional abnormality. Diabetologia. 2009;52:1003‐1012. - PMC - PubMed
    1. Galicia-Garcia U, Benito-Vicente A, Jebari S, et al. Pathophysiology of type 2 diabetes mellitus. Int J Mol Sci. 2020;21(17):6275. - PMC - PubMed
    1. Boden G. Obesity, insulin resistance and free fatty acids. Curr Opin Endocrinol Diabetes Obes. 2011;18:139‐143. - PMC - PubMed
    1. Ye R, Onodera T, Scherer PE. Lipotoxicity and beta cell maintenance in obesity and type 2 diabetes. J Endocr Soc. 2019;3:617‐631. - PMC - PubMed