. 2025 Apr 22;166(6):bqaf064.
doi: 10.1210/endocr/bqaf064.

Weight Gain With Advancing Age Is Controlled by the Muscarinic Acetylcholine Receptor M4 in Male Mice

Affiliations

Weight Gain With Advancing Age Is Controlled by the Muscarinic Acetylcholine Receptor M4 in Male Mice

Toshio Takahashi et al. Endocrinology. .

Abstract

Obesity is characterized by the excessive accumulation of adipose tissue, and it is a serious global health issue. Understanding the pathology of obesity is crucial for developing effective interventions. In this study, we investigated the role of muscarinic acetylcholine receptor M4 (mAChR-M4) in the regulation of obesity in Chrm4-knockout (M4-KO) mice. Male M4-KO mice showed higher weight gain and accumulation of white adipose tissue (WAT) with advancing age than the wild-type mice. The M4-KO mice also showed increased leptin expression at both the transcription and the translation levels. RNA sequencing and quantitative reverse transcription polymerase chain reaction analyses of subcutaneous adipose tissues revealed that the expression of WAT marker genes was significantly enhanced in the M4-KO mice. In contrast, the expression levels of brown adipose tissue/beige adipose tissue markers were strongly decreased in the M4-KO mice. To identify the Chrm4-expressing cell types, we generated Chrm4-mScarlet reporter mice and examined the localization of the mScarlet fluorescent signals in subcutaneous tissues. Fluorescent signals were prominently detected in WAT and mesenchymal stem cells. Additionally, we also found that choline acetyltransferase was expressed in macrophages, suggesting their involvement in acetylcholine (ACh) secretion. Corroborating this notion, we were able to quantitatively measure the ACh in subcutaneous tissues by liquid chromatography tandem mass spectrometry. Collectively, our findings suggest that endogenous ACh released from macrophages maintains the homeostasis of adipose cell growth and differentiation via mAChR-M4 in male mice. This study provides new insights into the molecular mechanisms underlying obesity and potential targets for therapeutic interventions.

Keywords: acetylcholine; body weight; brown adipose tissue; muscarinic receptor; white adipose tissue.


Figures

Figure 1.
Figure 1.
The body weight and WAT weight in aging M4–/– mice. (A) and (B) Changes in the body weight in male mice. *P < .05 for WT vs M4–/– mice. (C, D) Changes in the body weight in female mice. (E) Changes in the body weight in male mice at the age of 20 weeks. **P < .01, ***P < .001 for WT vs M1–/–, M3–/–, M4–/–, or M5–/– mice. (F, G) Epididymal adipose tissue in male M4–/– mice at the age of 20 weeks. (H, I) Subcutaneous adipose tissue in male M4–/– mice at the age of 20 weeks. (J) Mesentery adipose tissue in male M4–/– mice at the age of 20 weeks. (K) Weekly food intake of male M4–/– mice from 8 weeks to 20 weeks of age. (L) Average weekly food intake of male M4–/– mice over the experimental period. (M, N) Body weight of WT and M4–/– mice during the feeding of a high-fat diet (HFD). All data are expressed as the mean ± SD. Data were analyzed using a 2-tailed Student's t-test. *P < .05, **P < .01, ***P < .001.
Figure 2.
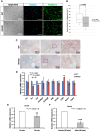
Figure 2.
Morphological and mRNA expression analyses in the subcutaneous adipose tissue and the liver of WT and M4-KO mice. (A) Anti-perilipin-1 antibody staining of subcutaneous adipose tissue. (B) Analysis of nuclear density of the subcutaneous adipose cells in WT and M4-KO mice. (C) Oil Red O staining of the liver sections. (D) Relative quantification of the expression level of lipid metabolism-related genes in the liver of M4-KO mice. (E) Relative quantification of the expression level of Chrm4 in the subcutaneous adipose tissues of 10-week-old and 20-week-old male WT mice. (F) Relative quantification of the expression level of Chrm4 in the subcutaneous adipose tissues of male and female WT mice at 20 weeks of age. The results of qRT-PCR are based on 3 independent experiments and are presented as the mean ± SD. Data were analyzed using a 2-tailed Student's t-test. **P < .01, ***P < .001.
Figure 3.
Figure 3.
Comparison of the expression of marker genes in the brain of WT and M4-KO mice. (A-C) Differential expression patterns of Npy, Pmch (Pro-Mch), and Hcrt (orexin) in the brain of M4-KO mice. The results of RNA-Seq are based on 3 independent experiments and are presented as the mean ± SD. (D) Relative quantification of the expression level of Npy, Mch, and Hcrt in the brain of M4-KO mice. (E, F) Relative quantification of the expression level of NPGM and NPGL in the brain of M4-KO mice. The results of qRT-PCR are based on 3 independent experiments and are presented as the mean ± SD. Data were analyzed using a 2-tailed Student's t-test. *P < .05.
Figure 4.
Figure 4.
Comparison of the expression of WAT marker genes in the subcutaneous adipose tissue of WT and M4-KO mice. (A-E) Differential expression patterns of Fabp4, Lpl, Lep, Adiponectin, and Resistin in the subcutaneous adipose tissue of M4-KO mice. The results of RNA-Seq are based on 3 independent experiments and are presented as the mean ± SD. (F) Relative quantification of the expression level of Fabp4, Lpl, Leptin, Adiponectin, and Resistin in the subcutaneous adipose tissue of M4-KO mice. (G) Relative quantification of the expression level of muscarinic receptor genes in the subcutaneous adipose tissue of M4-KO mice. The results of qRT-PCR are based on 3 independent experiments and are presented as the mean ± SD. Data were analyzed using a 2-tailed Student's t-test. **P < .01, ***P < .001.
Figure 5.
Figure 5.
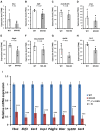
Comparison of the expression of BAT/beige adipose tissue marker genes in the subcutaneous adipose tissue of WT and M4-KO mice. (A-H) Differential expression patterns of Tbx1, Ebf3, Ear2/Nr2F6, Ucp1, Pdgfa, B3ar/Adrb3R, Sp100, and Car4 in the subcutaneous adipose tissue of M4-KO mice. The results of RNA-Seq are based on 3 independent experiments and are presented as the mean ± SD. Data were analyzed using a 2-tailed Student's t-test. *P < .05. (I) Relative quantification of the expression level of Tbx1, Ebf3, Ear2/Nr2F6, Ucp1, Pdgfa, B3ar/Adrb3R, Sp100, and Car4 in the subcutaneous adipose tissue of M4-KO mice. The results of qRT-PCR are based on 3 independent experiments and are presented as the mean ± SD. Data were analyzed using a 2-tailed Student's t-test. ***P < .001.
Figure 6.
Figure 6.
Gene set enrichment analysis of the subcutaneous adipose tissue of M4-KO mice, and comparison of the expression of WAT and BAT/beige adipose tissue marker genes in the BAT of WT and M4-KO mice. (A) GO enrichment tree shows that genes related to immune cell activation and cell division were upregulated in the subcutaneous adipose tissue of M4-KO mice. The enrichment P-value is indicated for each functional category. (B) and (C) The BAT in male M4-KO mice at the age of 20 weeks. (D) Anti-perilipin-1 antibody staining of brown adipose tissue. (E) Analysis of nuclear density of the brown adipose cells in WT and M4-KO mice. (F) Relative quantification of the expression level of Fabp4, Lpl, and Leptin in the BAT of M4-KO mice. (G) Relative quantification of the expression level of Tbx1, Ebf3, Ear2/Nr2F6, Ucp1, Pdgfa, B3ar/Adrb3R, Sp100, and Car4 in the BAT of M4-KO mice. The results of qRT-PCR are based on 3 independent experiments and are presented as the mean ± SD. Data were analyzed using a 2-tailed Student's t-test. **P < .01, ***P < .001.
Figure 7.
Figure 7.
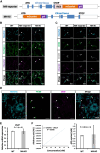
Localization of mAChR-M4 and ChAT in M4-reporter and M4-KI mice, and comparison of the expression of ChAT and the ACh content in the subcutaneous adipose tissue of WT and M4-KO mice. (A) Structures of transgenes integrated into the genomic DNA of M4-KI and M4-reporter mice. IRES, internal ribosome entry site. (B) Double staining using antibodies with red fluorescent protein (RFP) and perilipin-1. (C) Triple staining using antibodies with RFP, CD34, and CD105. (D) Double staining using antibodies with RFP and F4/80. Nuclei were stained using Hoechst staining. White scale bars represent 20 μm. (E) Relative quantification of the expression level of Chat in the subcutaneous adipose tissue of M4-KO mice. (F) The ACh content of the subcutaneous adipose tissue of M4-KO mice was measured quantitatively by LC-MS/MS analysis. The results of qRT-PCR and LC-MS/MS are based on 3 independent experiments and are presented as the mean ± SD. Data were analyzed using a 2-tailed Student's t-test.

Similar articles

References

    1. Hotamisligil GS. Inflammation and metabolic disorders. Nature. 2006;444(7121):860‐867. - PubMed
    1. Volpi E, Nazemi R, Fujita S. Muscle tissue changes with aging. Curr Opin Clin Nutr Metab Care. 2004;7(4):405‐410. - PMC - PubMed
    1. Yoneshiro T, Aita S, Matsushita M, et al. Age-related decrease in cold-activated brown adipose tissue and accumulation of body fat in healthy humans. Obesity (Silver Spring). 2011;19(9):1755‐1760. - PubMed
    1. Cameron HL, Perdue MH. Muscarinic acetylcholine receptor activation increases transcellular transport of macromolecules across mouse and human intestinal epithelium in vitro. Neurogastroenterol Motil. 2007;19(1):47‐56. - PubMed
    1. McLean LP, Smith A, Cheung L, et al. Type 3 muscarinic receptors contribute to intestinal mucosal homeostasis and clearance of Nippostrongylus brasiliensis through induction of TH2 cytokines. Am J Physiol Gastrointest Liver Physiol. 2016;311(1):G130‐G141. - PMC - PubMed