. 2025 Apr 2;17(4):937-959.
doi: 10.18632/aging.206236. Epub 2025 Apr 2.

Decreased mitochondrial NAD+ in WRN deficient cells links to dysfunctional proliferation

Affiliations

Decreased mitochondrial NAD+ in WRN deficient cells links to dysfunctional proliferation

Sofie Lautrup et al. Aging (Albany NY). .

Abstract

Werner syndrome (WS), caused by mutations in the RecQ helicase WERNER (WRN) gene, is a classical accelerated aging disease with patients suffering from several metabolic dysfunctions without a cure. While, as we previously reported, depleted NAD+ causes accumulation of damaged mitochondria, leading to compromised metabolism, how mitochondrial NAD+ changes in WS and the impact on WS pathologies were unknown. We show that loss of WRN increases senescence in mesenchymal stem cells (MSCs) likely related to dysregulation of metabolic and aging pathways. In line with this, NAD+ augmentation, via supplementation with nicotinamide riboside, reduces senescence and improves mitochondrial metabolic profiles in MSCs with WRN knockout (WRN-/-) and in primary fibroblasts derived from WS patients compared to controls. Moreover, WRN deficiency results in decreased mitochondrial NAD+ (measured indirectly via mitochondrially-expressed PARP activity), and altered expression of key salvage pathway enzymes, including NMNAT1 and NAMPT; ChIP-seq data analysis unveils a potential co-regulatory axis between WRN and the NMNATs, likely important for chromatin stability and DNA metabolism. However, restoration of mitochondrial or cellular NAD+ is not sufficient to reinstall cellular proliferation in immortalized cells with siRNA-mediated knockdown of WRN, highlighting an indispensable role of WRN in proliferation even in an NAD+ affluent environment. Further cell and animal studies are needed to deepen our understanding of the underlying mechanisms, facilitating related drug development.

Keywords: NAD+; Werner syndrome; mitochondria; premature aging; proliferation.


Conflict of interest statement

CONFLICTS OF INTEREST: EFF is a co-owner of Fang-S Consultation AS (Organization number 931 410 717) and NO-Age AS (Organization number 933 219 127); he has an MTA with LMITO Therapeutics Inc (South Korea), a CRADA arrangement with ChromaDex (USA), a commercialization agreement with Molecule AG/VITADAO, and MTAs with GeneHarbor (Hong Kong) Biotechnologies Limited and Hong Kong Longevity Science Laboratory (Hong Kong); he is a consultant to MindRank AI (China), NYO3 (Norway), AgeLab (Vitality Nordic AS, Norway), and Hong Kong Longevity Science Laboratory (Hong Kong). HLN has a CRADA arrangement with ChromaDex (USA).

Figures

Figure 1
Figure 1
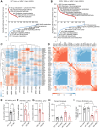
WRN is essential in maintaining metabolic, mitochondrial, and other longevity-related pathways as well as in inhibiting senescence in mesenchymal stem cells. (A, B) Gene-set-enrichment analysis demonstrates upregulated and downregulated signaling pathways (KEGG pathways) in WT and WRN−/− MSCs with/without 1 mM NR treatment for 24 h. The KEGG terms were ranked on the basis of enrichment scores. The upregulated KEGG pathways and downregulated KEGG pathways are summarised separately. (C) Heat map data showing fpkm changes of significantly up- or down-regulated genes (DEGs) related to NAD+ metabolism in the comparisons shown (list of target genes is found in Supplementary Table 1; full list of fpkm values is found in Supplementary File 1). WRN−/− (Veh) clusters alone, whereas WRN−/− (NR) and WT (Veh) cluster together. (D) Correlation matrix of fpkm values showing the correlation between expression of NAD+ related DEGs and proliferation/senescence related markers. (EG) Senescence evaluation by senescence associated β-Galactosidase (SA-β-Gal) staining of MSCs derived from control (WT) and WS patients (WS). SA-β-Gal positive cells decreased with 11–18 days of 1 mM NR treatment in WRN−/− MSCs (Student’s t-test, p-values = 0.0097 and 0.0156, respectively) (F, G), but not in WT MSCs (Student’s t-test, p-value = 0.2029) (E). SA-β-Gal positive MSCs relative to total number of cells were quantified from two biological experiments per cell line. (H) SA-β-Gal staining of primary fibroblasts from healthy control donors (WT) and WS patients (WS). SA-β-Gal staining was increased in WS patient derived fibroblasts compared to healthy controls (WT) (Two-way ANOVA, Tukey’s multiple comparisons test, p-value = 0.0036). SA-β-Gal staining decreased with 10 days 1 mM NR treatment in WS patient derived primary fibroblasts (Two-way ANOVA, Tukey’s multiple comparisons test, p-value = 0.0115) (F, G), but not in WT MSCs (Two-way ANOVA, Tukey’s multiple comparisons test, p-value = 0.9930) (Senescence evaluation by Spider β-Gal (Dojindo) staining of primary fibroblasts from healthy donors (WT) or WS patients (WS) without or with 1 mM NR for 10 days prior to staining are found in Supplementary Figure 1). (I) Staining of HMGB1 in primary fibroblasts from healthy donors (WT) or WS patients (WS) without or with 1 mM NR treatment for 10 days prior to staining. The number of cells with nuclear HMGB1 only relative to the total number of cells is shown in the figure from three biological repeats from two WT cell lines and two WS cell line. The percentage of cells with nuclear HMGB1 was decreased in WS-derived primary fibroblasts compared to WT (Two-way ANOVA, Tukey’s multiple comparisons test, p-value < 0.0001). Supporting the SA-β-Gal staining, 10 days 1 mM NR treatment increased the proportion of WS-derived fibroblasts with nuclear HMGB1 staining compared to vehicle treated cells significantly (Two-way ANOVA, Tukey’s multiple comparisons test, p-value = 0.0006), indicating decreased senescence with NR treatment.
Figure 2
Figure 2
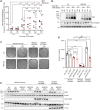
WRN regulates main NAD+ synthetic proteins and shares many transcription targets with NMNAT1-3. (A) Representative western blots of RIPA extracts from HEK293 parental cells with either 30 nM Scramble siRNA (Scr) or 30 nM WRN siRNA (WRN-KD) followed by 24 h 1 mM NR treatment. (BF) Quantification of western blots from 4–6 biological repeats. Statistical analysis was performed in GraphPad Prism with either One-way ANOVA with Šidák multiple comparison’s test or Student’s t-test. (C) NMNAT1 was significantly decreased in WRN-KD cells compared to Scr (Veh) and Scr (NR) (One-way ANOVA, Tukey’s multiple comparisons test, p-value = 0.0108, student’s t-test p-value = 0.0163), (D) NAMPT was significantly increased in WRN-KD (Veh) cells compared to Scr (Veh) (One-way ANOVA, Tukey’s multiple comparisons test, p-value = 0.0492, Student’s t-test, p-value = 0.0010) and (E) NADSYN1 was upregulated in WRN-KD (Veh) compared to Scr (Veh) (Student’s t-test, p-value = 0.0442). (FI) Venn diagram showing the shared transcription targets of WRN and NMNAT1-3 based on the ENCODE transcription database.
Figure 3
Figure 3
Reduced mitochondrial NAD+ in WRN depleted cells. (A, B) WRN-KD in the HEK293-mitoPARP reporter cell line led to decreased mitochondrial NAD+ compared to Scr as measured by PAR signal relative to β-Actin. Cells were grown in the presence of the PARP inhibitor 3-AB (1 mM) and collected at the designated timepoints after removal of 3-AB from the media (0, 3, 6 h). (A) Quantification of 6 biological repeats. Scramble (Scr) is paired with WRN-KD from the same biological repeat with a black line in the graph. Statistical significance was found between 0 h (right after the release of 3-AB treatment) compared to 3 h and 6 h (Two-way ANOVA, Tukey’s multiple comparisons test. Scr (Veh): 0 h to 3 h and 6 h p-values < 0.0001. WRN-KD (Veh): 0 h to 3 h p-value = 0.001; 0 h to 6 h p-value < 0.0001). Further increased PARylation signal, resembling increased mitochondrial NAD+ levels, was observed in Scr between 3 h and 6 h after 3-AB release (Two-way ANOVA, Tukey’s multiple comparisons, p-value = 0.0030), however no change was observed in WRN-KD cells between 3 h and 6 h, suggesting less available mitochondrial NAD+ (Two-way ANOVA, Tukey’s multiple comparisons, p-value = 0.8310). Moreover, there was a significant reduced level of PAR in WRN-KD cells compared to Scr at 6 h after 3-AB release (Two-ANOVA, Tukey’s multiple comparisons, p-value = 0.0321). (B) Representative western blot of PAR and β-Actin signal. (C, D) WRN-KD leads to decreased colony formation in HEK293 cells (Two-way ANOVA, Tukey’s multiple comparisons, p-value = 0.012), which was not rescued by overexpression of the human mitochondrial NAD+ transporter SLC25A51 or 1 mM NR treatment for 24 h. Overexpression of SLC25A51 in HEK293 (HEK293-SLC25A51) did on the other hand significantly increase colony formation in Scr cells (Two-way ANOVA, Tukey’s multiple comparisons, p-value = 0.0049). Colony formation assay was performed for Scr or WRN-KD (30 nM siRNA) in three different HEK293 cell lines: Parental HEK293, HEK293-mitoPARP and HEK293-SLC25A51. The HEK293-mitoPARP cells were exposed to 6 h 3-AB release before seeding out for colonies in medium containing 1 mM 3-AB for 11 days. (C) Representative images of stained colonies. (D) quantification of 3 biological replicates with 3 technical repeats. (E) Confirmation of WRN-KD was shown to be 90–100% in all biological replicates. Western blotting of GFP-PARP1 and FLAG confirmed the specific expression of the mitoPARP and SLC25A51-constructs, respectively. The dotted line indicates that the representative blots are from two different blots with their respective loading controls. Statistics were performed with GraphPad Prism using Two-way ANOVA with Tukey’s multiple comparison.
Figure 4
Figure 4
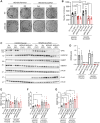
WRN is indispensable in proliferation as mitochondrial or cellular NAD+ augmentation is unable to reinstall compromised proliferation in immortalized WRN-KD cells. (A, B) WRN-KD led to decreased colony formation in HEK293 parental cells (Two-way ANOVA, Tukey’s multiple comparisons, p-value = 0.0009). The proliferation defects caused by knockdown were not rescued by either 1 mM NR treatment throughout the colony formation period or overexpression of SLC25A51. Media was replaced with fresh media every 3 days. (A) Representative images, acquired with Bio-Rad Chemidoc. (B) Quantification of 3 biological replicates with 3 technical repeats/replicates. Statistical analysis was done using two-way ANOVA with Tukey’s multiple comparisons test. (C) Western blotting confirming WRN-KD of 90–100% and blotting of NAD+ related proteins. Western blotting of FLAG confirmed the specific expression of the SLC25A51-construct. The dotted line indicates that the representative blots are from two different blots with their respective loading controls. (D) Quantification of WRN expression, confirming efficient knockdown of WRN in both HEK293 and SLC25A51. (EG) Quantification of NAD+ related proteins. The groups were compared with Two-way ANOVA using Tukey’s multiple comparison to test the difference among all groups, and Student’s t-test as explained in Figure 2. NADSYN1 expression was increased in Scr cells with SLC25A51 overexpression compared to parental HEK293 cells (Two-way ANOVA, Tukey’s multiple comparisons test, p-value = 0.0048), and NAMPT was increased in both Scr and WRN-KD cells with SLC25A51 overexpression (Two-way ANOVA, Tukey’s multiple comparisons test, p-value < 0.0001 and p-value = 0.0004, respectively). No significant effects were found with 24 h 1 mM NR treatment.

Similar articles

Cited by

References

    1. Opresko PL, Laine JP, Brosh RM Jr, Seidman MM, Bohr VA. Coordinate action of the helicase and 3' to 5' exonuclease of Werner syndrome protein. J Biol Chem. 2001; 276:44677–87. 10.1074/jbc.M107548200 - DOI - PubMed
    1. Shamanna RA, Croteau DL, Lee JH, Bohr VA. Recent Advances in Understanding Werner Syndrome. F1000Res. 2017; 6:1779. 10.12688/f1000research.12110.1 - DOI - PMC - PubMed
    1. Oshima J, Sidorova JM, Monnat RJ Jr. Werner syndrome: Clinical features, pathogenesis and potential therapeutic interventions. Ageing Res Rev. 2017; 33:105–14. 10.1016/j.arr.2016.03.002 - DOI - PMC - PubMed
    1. Lautrup S, Caponio D, Cheung HH, Piccoli C, Stevnsner T, Chan WY, Fang EF. Studying Werner syndrome to elucidate mechanisms and therapeutics of human aging and age-related diseases. Biogerontology. 2019; 20:255–69. 10.1007/s10522-019-09798-2 - DOI - PubMed
    1. Tian Y, Lautrup S, Law PWN, Dinh ND, Fang EF, Chan WY. WRN loss accelerates abnormal adipocyte metabolism in Werner syndrome. Cell Biosci. 2024; 14:7. 10.1186/s13578-023-01183-4 - DOI - PMC - PubMed

MeSH terms

LinkOut - more resources