. 2025 May 15;188(10):2603-2620.e18.
doi: 10.1016/j.cell.2025.03.001. Epub 2025 Apr 2.

Therapeutic potential of allosteric HECT E3 ligase inhibition

Affiliations

Therapeutic potential of allosteric HECT E3 ligase inhibition

Alexander M K Rothman et al. Cell. .

Abstract

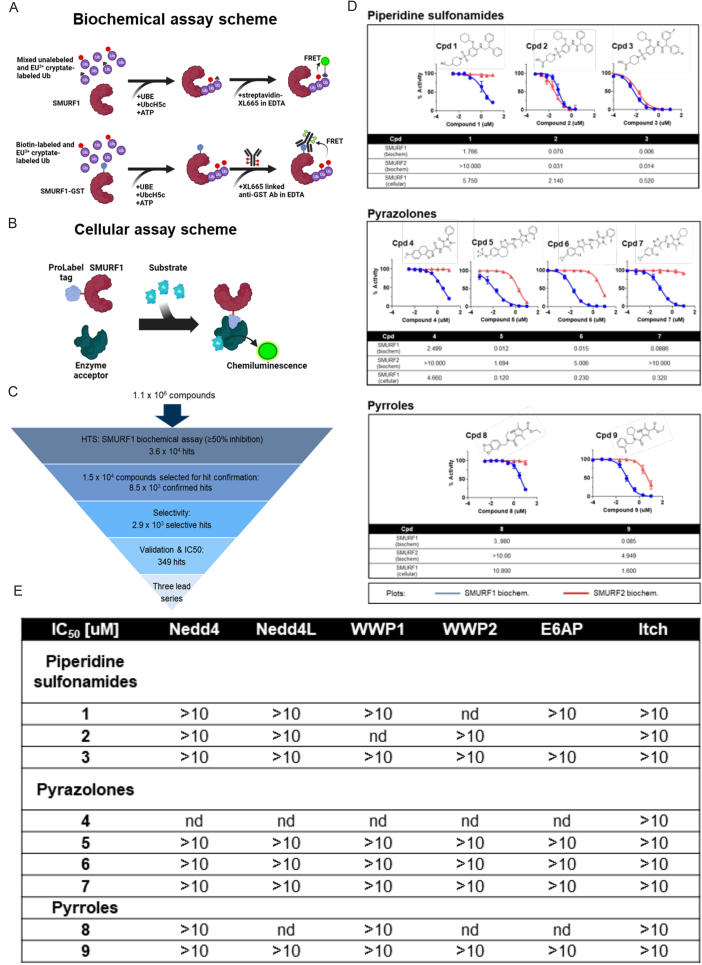
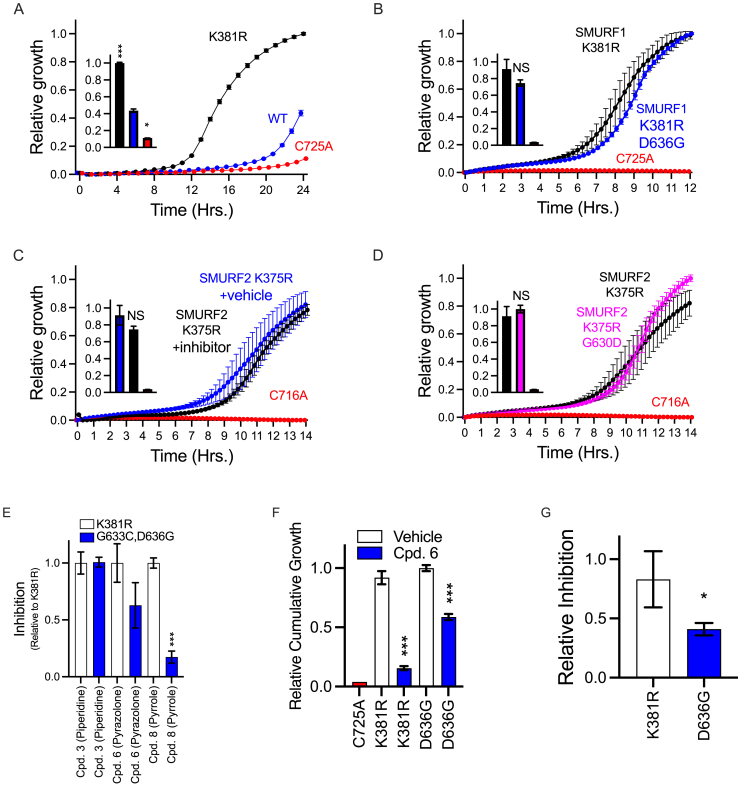
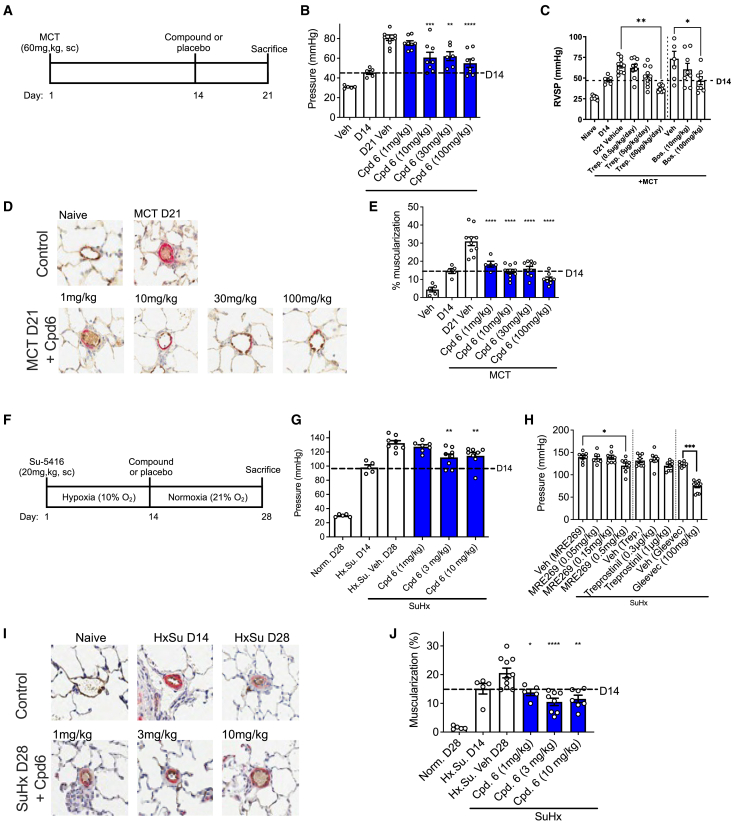
Targeting ubiquitin E3 ligases is therapeutically attractive; however, the absence of an active-site pocket impedes computational approaches for identifying inhibitors. In a large, unbiased biochemical screen, we discover inhibitors that bind a cryptic cavity distant from the catalytic cysteine of the homologous to E6-associated protein C terminus domain (HECT) E3 ligase, SMAD ubiquitin regulatory factor 1 (SMURF1). Structural and biochemical analyses and engineered escape mutants revealed that these inhibitors restrict an essential catalytic motion by extending an α helix over a conserved glycine hinge. SMURF1 levels are increased in pulmonary arterial hypertension (PAH), a disease caused by mutation of bone morphogenetic protein receptor-2 (BMPR2). We demonstrated that SMURF1 inhibition prevented BMPR2 ubiquitylation, normalized bone morphogenetic protein (BMP) signaling, restored pulmonary vascular cell homeostasis, and reversed pathology in established experimental PAH. Leveraging this deep mechanistic understanding, we undertook an in silico machine-learning-based screen to identify inhibitors of the prototypic HECT E6AP and confirmed glycine-hinge-dependent allosteric activity in vitro. Inhibiting HECTs and other glycine-hinge proteins opens a new druggable space.

Keywords: E6AP; HECT; SMURF1; allosteric inhibition; drug discovery; glycine hinge; pulmonary arterial hypertension; small molecule; ubiquitin E3 ligase; vascular remodeling.


Conflict of interest statement

Declaration of interests D.J.R., S.G.-G., C.Q., O.B., R.H., A.H., T.R., M.T., R.J., D. Sutton, J.R., J.-H.Z., S.W., S.C., J.O., S.S., T.T., M.H., M.J.T., G.J., R.E.J.B., J.S.C., R.L., N.S., N.O., J.T., and D. Shaw are current or former Novartis employees. Two patents have been submitted related to this work: WO2020079687A1 (G.P.) and US11672782B2 (D. Shaw and N.S.).

Figures

None
Graphical abstract
Figure 1
Figure 1
SMURF1 and SMURF2 HECT domain:inhibitor complex (A) The catalytic cysteine of HECT E3 ligases SMURF1, E6AP, and neural precursor cell expressed developmentally down-regulated protein 4 (NEDD4) is located on the external surface of the protein, in contrast to the active-site pocket location in the ubiquitin-specific-processing protease 7 (ubiquitin specific peptidase 7 [USP7]). (B) Superposition of HECT structures in two extreme rotation angles of the C-lobe. NEDD4L (blue), the catalytic cysteine is in close proximity to the E2 and ubiquitin (not shown); Rsp5 (cyan), the catalytic cysteine is facing the target (Sna3; magenta) and the C terminus of ubiquitin (not shown); and movement around the hinge is shown in Video S1. (C) Structure of inhibitor-bound SMURF1 (Cpd-8). A slice in the N-lobe reveals the cryptic cavity. Electrostatic surface potential was calculated with Adaptive Poisson-Boltzmann Solver with the indicated ± KT/e. (D) Logo sequence shows the residue conservation demonstrating the invariant G634 (Table S1). Superposition of 28 HECT structures, including inhibitor-bound SMURF1. The conserved glycine (blue spheres) are aligned at the stem of the hinge. The α helix10 (αH10) of SMURF1 (magenta) is elongated over the conserved glycine (G634) that is relocated within the αH10. (E) Schematic of the structural changes of αH10 and the altered length/flexibility of the hinge due to inhibitor binding. (F) Structural comparison of SMURF1 and SMURF2 with and without the inhibitor. See also Figures S1 and S2.
Figure S1
Figure S1
HTS strategy and activity of lead compounds from prioritized chemical series, related to Figure 1 (A) Schematic showing the biochemical TR-FRET assays used for detection of SMURF1 self-ubiquitylation. (B) Cell-based assay: detection of E3 ligase self-ubiquitylation, assay used for the validation screen and selectivity profiling. (C) Process used for triaging of initial hits through to identification of lead series. (D) Overview of pharmacological activity for three prioritized chemical hit classes. Plots show dose-response in SMURF1 (blue) and SMURF2 (red) biochemical assays (n = 4–11). The tables below indicate half-maximal inhibitory concentration (IC50) values for respective inhibitors in SMURF1 and SMURF2 biochemical assays and SMURF1 cellular assay (n = 2–474). (E) Selectivity of SMURF1 inhibitors across representative structurally related HECT family members (n = 4–20).
Figure 2
Figure 2
Allosteric inhibition of SMURF1 (A) Illustration of the E. coli split-CAT system showing target ubiquitylation resulting in CAT assembly, resistance, and selective growth. (B) Replacement of the SMURF1 conserved glycine with proline (G634P), an amino acid with a covalently linked side chain that limits hinge flexibility and a deletion that reduced hinge length (Δ637KID), both reduce ubiquitylation. (C) Cpd-8 (blue) reduces ubiquitylation compared with vehicle (black). (D) SMURF1 escape mutant-1 (insertion of GGLD downstream to D636) shows resistance activity to the inhibitor. (E) SMURF1 escape mutant-2 (replacing indicated residues with SMURF2 residues) shows significant resistance to the inhibitor. (F) Relative inhibition of the escape mutants. (G) SMURF1 G636 forms a non-covalent bond that stabilizes the elongated αH10. Mutation of each of the three residues (D636G, R686A, and N507A) results in escape from inhibition. (H) Escape mutant-3 (D636G mutation replaces the amino acid that stabilizes the elongated αH10 with one that does not form a non-covalent bond) shows significant resistance to the inhibitor. (I) Susceptibility mutant (G630D, replacing indicated residues of SMURF2 with SMURF1; SMURF1lation) shows the sensitivity of mutant SMURF2 to inhibitor. All data: n = 4 replicates; mean ± SD, ∗∗p < 0.01, ∗∗∗p < 0.001 Student’s t test or one-way ANOVA with Dunnett’s correction as appropriate. See also Figures S2 and S3.
Figure S2
Figure S2
Structural details of inhibitor binding to SMURF1, conservation of lysine residues on α helix #1, and AlphaFold model of the SMURF1:BMPR2 complex, related to Figures 1, 2, 4, and 6 (A) Crystallography parameters. The highest resolution shell is shown in parenthesis. (B) Surface representation of SMURF1 shows that the inhibitor is minimally exposed. (C) Detailed structural insight into the SMURF1—inhibitor complex, with a zoomed view of the binding cavity from three different angles. (D) 2D representation of the inhibitor binding site, rendered using LigPlot+ v.2.2 https://www.ebi.ac.uk/thornton-srv/software/LigPlus/. (E) mFo-DFc simulated-annealing electron density omit map showing the α10 and the hinge region without (left) and with (right) the inhibitor. The map was calculated by omitting the entire model of the α 10, the hinge, and the inhibitor using simulated-annealing sigma A analysis contoured at 2.75 (SMURF1, apo) and 2.05 Å (SMURF1, Cpd-8) at 3σ. (F) Structures of HECT ligase showing conservation of lysine residues on α helix #1. Superimposing the structures of Rsp5 (3OLM), NEDD4 (2XBB), and SMURF1 and AlphaFold model of E6AP/UBE3A HECT domains shows the conservation of lysine (K) residues on α helix #1, previously demonstrated to undergo self-ubiquitylation that downregulates the ligase activity. (G) AlphaFold model of the SMURF1:BMPR2 complex. The sequences of full-length SMURF1 and the intracellular domain of BMPR2 were modeled in AlphaFold3. The domains of SMURF1 are indicated. Residues predicted to participate in binding are shown as ball-and-sticks. The model suggests that WW1 and WW2 domains directly interact with the kinase domain of BMPR2.
Figure S3
Figure S3
Split-CAT-based E. coli, related to Figures 2, 4, and 6 System monitoring SMURF1 and SMURF2 activity and evaluation of structure-based allosteric mechanism of serries representative compounds. (A) SMURF1-dependent ubiquitylation of Rpn10: wild-type (blue), K381R mutant (black), and catalytically inactive C725A (red). (B) SMURF1-dependent ubiquitylation of the phosphomimetic peptide of SMAD1 (black) with D636G mutation (blue). (C) SMURF2-dependent ubiquitylation of Rpn10 with (black) or without (blue) Cpd-8. (D) SMURF2-dependent ubiquitylation of Rpn10 (black) with G630D mutation (pink). Growth curves with inset bars representing area under the curve (AUC), n = 4 replicates, mean ± SD. The SMURF1 inhibition modes of representative compound from each of the three-chemical series (piperidine, pyrazolone, and pyrrole): Cpd-3, Cpd-6, and Cpd-8 were assessed in the split-CAT assay. The compounds were assessed against hyperactive (K381R mutant)—white bars or an escape mutant (K381R, G633C, and D636F)—blue bars. (E) Shows relative inhibition of SMURF1 by each of the compounds using Rpn10 as ubiquitylation target reporter (mean ± SD; n = 3 replicates). (F and G) As in (A), but Rpn10 was replaced with phosphomimetic peptide of SMAD1 as ubiquitylation target reporter. n = 4 replicates, mean ± SD.
Figure 3
Figure 3
SMURF1 expression in PAH (A) Schematic representation of canonical BMP signaling resulting in SMAD1/5/8 phosphorylation, in nuclear translocation of SMAD4 and ID1 expression, and its negative regulation by SMURF1-mediated ubiquitylation and degradation of BMPR2 and SMAD1/5/8. (B) In HEK293 cells stably transfected with GFP-tagged SMURF1, BMP4 stimulation results in a decrease in GFP signal and short interfering RNA (siRNA) knockdown of ACVRL1, BMPR2, Endoglin (ENG), or SMAD9, and BMP4 stimulation results in increased GFP signal. n = 3 separate experiments; presented as mean ± SEM. p < 0.05, ∗∗p < 0.01, relative to untreated, unpaired Student's t test. (C) Expression of SMURF1 is increased in PASMC from patients with idiopathic and heritable PAH when compared with PASMC from patients without PAH. n = 6 PAH donor lines and n = 9 control lines; presented as mean ± SEM. ∗∗p < 0.01, unpaired Student's t test. (D) SMURF1 expression in the pulmonary artery intima and media in patients with PAH. SMURF1 (purple) protein co-localization with an endothelial (von Willebrand factor [vWF], yellow) or smooth muscle marker (Alpha Smooth Muscle Actin [αSMA], yellow) is indicated by a red/brown color shift. Representative images were obtained from 19 controls and 33 patients with PAH. Scale bar, 60 μm. Arrows indicate areas of co-localization. See also Figure S4.
Figure S4
Figure S4
SMURF1 expression in patient samples, related to Figure 3 (A) Screen for modulators of SMURF1 mRNA abundance in PASMCs. Human PASMCs from PAH patients were treated with agents that are associated with PAH, including cytokines, chemokines, growth factors, and small-molecule pathway probes, and were cultured under hypoxic conditions to identify modulators of SMURF1 mRNA (n = 2 donors). The figure shows normalized Ct values (ΔΔCt method). The BMP agonist FK506 (tacrolimus) was found to reduce SMURF1 expression. Both hypoxic conditions and TGF-β1 treatment increase SMURF1 expression, supporting SMURF1 induction as part of a feedback loop regulating BMP and TGF-β1 signaling. (B) In silico analysis indicates that the SMURF1 promoter contains two bindings sites for the hypoxia-regulated transcription factor, hypoxia-inducible factor 1 subunit alpha (HIF1α). The human SMURF1 promoter was stably transfected into HEK293 cells upstream of a Green Fluorescence Protein (GFP) encoding sequence. Administration of TGF-β1 and bafilomycin A1 increased GFP signal. (C) Representative histology sections of explanted lungs from patients with and without pulmonary arterial hypertension. Dual staining was performed for vWF (brown) and αSMA (pink), and single staining for SMURF1 (brown). Each set of two images represents a unique patient (total: n = 15 control and n = 18 PAH patients). Scale bar, 60 μm. Plot: quantification of pulmonary vascular muscularization in above histological images (M, full muscularization; NM, no muscularization).
Figure 4
Figure 4
SMURF1 inhibitors restore BMP signaling and pulmonary vascular cell homeostasis (A) Scheme of SMURF1-BMPR2 and SMAD1 split-CAT based E. coli selection system, showing target ubiquitylation resulting in CAT assembly, resistance, and selective growth. (B and C) Hyperactive K381R (black) increases and catalytically inactive C725A (red) reduces SMURF1-dependent direct target ubiquitylation of SMAD1 (B) and BMPR2 (C) (inset represents area-under-the-curve of relative growth; n = 3, ∗∗p < 0.01, ∗∗∗p < 0.001, one-way ANOVA with Dunnett’s correction). (D) Representative western blot demonstrating stabilization of overexpressed SMAD1 in HEK cells in the presence of SMURF1 inhibitor. Mutations that reduce the flexibility (G634P) and length (Δ637KID) of the hinge result in reduce SMURF1 activity. Mutations that preserve the flexibility (G633C, D636G [GGLD]) and length (637GGLDINS) of the SMURF1 glycine hinge escape the effect of the inhibitor. (E) Representative western blot demonstrating stabilization of overexpressed BMPR2-myc in HEK cells in the presence of SMURF1 inhibitor. (F) Immunoblotting of BMPR2, SMURF1, SMAD1/5/8, phosphorylated SMAD1/5/8, ID1, and glyceraldehyde-3-phosphate dehydrogenase (GAPDH) in PASMC cultured without or with BMP4 and SMURF1 inhibitor (Cpd-6) (n = 9 separate experiments across cells from 3 PAH donor lungs, mean ± SEM). (G and H) Quantification of apoptosis in PAECs. (G) Representative time curve (n = 5 technical replicates, mean ± SD) and (H) group data at 300 min with Cpd-6 or vehicle (n = 6 separate donors, mean ± SEM). (I and J) Quantification of proliferation: (I) representative time course (n = 5 technical replicates, mean ± SD) in PAEC with cell confluence mask for each dose of Cpd-6 or vehicle (orange) and (J) group data (n = 3 separate PAEC donors; mean ± SEM). (K) Migration of PASMCs with Cpd-6 or vehicle measured via disc closure assay (n = 2–3 separate donors). (L) Representative time course plots showing proliferation of PASMC from an idiopathic PAH patient with Cpd-6 or vehicle with cell confluence mask for each dose (orange) (n = 5 technical replicates per concentration from one idiopathic PAH donor line, mean ± SD). (M) Group proliferation data at 72 h in PASMCs from patients with idiopathic or hereditary PAH (n = 4–5 separate donor lines, mean ± SEM). p < 0.05, ∗∗p < 0.01, one-way ANOVA with Dunnett’s correction. See also Figures S2, S3, and S5.
Figure S5
Figure S5
BMP signaling and proteomic effects of SMURF1 inhibition in mammalian cells, related to Figure 4 (A) Comparison of small-molecule SMURF1 inhibition and siRNA-mediated SMURF1 knockdown on BMP signaling (BMP response element – ID1 promoter activation) in HEK293 cells. (B–D) Summary of expression proteomics experiments comparing PASMCs treated under hypoxic conditions ±BMP4 or ±SMURF1 inhibitor Cpd-6 (SMURF1i). (B) Experimental workflow. Table: sample conditions for PASMC BMPR2 (C347Y) mutant cells undergoing TMT quantitative proteomics profiling at 24 h. (C) Log2 ratios of protein abundances for treated versus control (DMSO) in selected conditions. Data represent two biological replicates (n = 2) per treatment condition in a single experiment derived from individual donors. Highlighted proteins correspond to “IL-1 beta- and endothelin-1-induced fibroblast/myofibroblast migration and extracellular matrix production in asthmatic airways” gene set, which was significantly enriched among dysregulated proteins, only in condition (B) (ii). Inserts show heatmap for ratios for donors 1 and 2 for proteins highlighted in the plot. (D) Log2 ratio of known SMURF1 targets RhoA and TGFBR1 detected in proteomic study and chemiluminescence of SMURF1, BMPR2, SMAD1, pSMAD1, and ID1 in samples used for proteomic studies measured by western (not detected by proteomics). (E) Summary of significantly enriched terms for mutant cells under hypoxic conditions pre-treated with BMP4, followed by treatment with SMURF1 inhibitor or DMSO.
Figure 5
Figure 5
Inhibition of SMURF1 treats established experimental PAH (A) Experimental timeline for the monocrotaline study. (B–E) Right ventricular systolic pressure (RVSP) (B, SMURF1 inhibition; C, standard of care and experimental PAH therapies) and pulmonary vascular muscularization (D and E) are increased with disease and reduced by small-molecule inhibition of SMURF1 (n = 5–11). Histology (D): original magnification, x200. (F) Experimental timeline for the Su-5416 hypoxia study. (G–J) RVSP (G, SMURF1 inhibition; H, standard of care and experimental PAH therapies) and pulmonary vascular muscularization (I and J) are increased with disease and reduced by small-molecule inhibition of SMURF1 (n = 5–10). Histology (I): original magnification, x200. All bar graphs presented as mean ± SEM, p < 0.05, ∗∗p < 0.01, ∗∗∗p < 0.001, ∗∗∗∗p < 0.0001, one-way ANOVA with Dunnett's correction.
Figure 6
Figure 6
Structure-based identification of E6AP inhibitors (A) Schematic representation of the approach to hit identification. Remodeled HECT domain is formed by tethering on the inhibited SMURF1 structure and allosteric cryptic cavity used for an ML screen, followed by split-CAT validation. (B) Structure of the HECT glycine hinge and location of self-ubiquitylated lysine comparing the inhibited models of SMURF1 and E6AP and the active structure of E6AP. (C) Altered E6AP activity is associated with human disease. (D) Glycine 738 stems the hinge between the N- and C-lobes in E6AP with the lysine self-ubiquitylation target located at 466 (which corresponds to NEDD4 G779 and K525). (E) E6AP-dependent Rpn10 ubiquitylation split-CAT reporter system. (F) Activity of the constitutively active K466R E6AP is reduced by G738E mutation, demonstrating the importance of the glycine hinge and these residues. (G) Mass-spectrometry analysis showing self-ubiquitination of E6AP at K466. (H) Hit prioritization heatmap of 32 compounds derived from the ML-based screen and examined in the E. coli split-CAT system. Percentage inhibition is represented by a color scale from red (maximum inhibition) to blue (minimum inhibition). (I) Inhibition of E6AP with compound i-27 in E. coli split-CAT system and the dose-response curve for E6AP:i-27. (J) Predicted structural rearrangements of the E6AP glycine hinge in the presence of compound i-27. (K) Activity of the E6AP S739L, R740G escape (SMURF2lation) mutant in the presence of compound i-27. All studies, n = 3, mean ± SEM, ∗∗p < 0.01, ∗∗∗p < 0.001, one-way ANOVA with Dunnett’s correction or Student's t test as appropriate. See also Figures S2, S3, and S6.
Figure S6
Figure S6
Self-ubiquitylation and inhibition of E6AP, related to Figure 6 (A) An E6AP self-ubiquitylation cascade was expressed in E. coli with or without ubiquitin. Protein was purified using nitrilotriacetic acid (NTA) affinity purification and run on SDS-PAGE, demonstrating self-ubiquitylation at K466. (B) In-gel analysis of the mass-spectrometry data. (C) LigPlot scheme of the E6AP:i27 interaction. Residues that form the cavity in E6AP and interact with the inhibitor i27 are presented. The chemical structure of the inhibitor (i-27): 1-[1-(4-methylphenyl)-imidazol-2-yl]-4-[adamantane-1-carbonyl]piperazine is shown at the center.

References

    1. Rape M. Ubiquitylation at the crossroads of development and disease. Nat. Rev. Mol. Cell Biol. 2017;19:59–70. doi: 10.1038/nrm.2017.83. - DOI - PubMed
    1. Schmidt M.F., Gan Z.Y., Komander D., Dewson G. Ubiquitin signalling in neurodegeneration: mechanisms and therapeutic opportunities. Cell Death Differ. 2021;28:570–590. doi: 10.1038/s41418-020-00706-7. - DOI - PMC - PubMed
    1. Skaar J.R., Pagan J.K., Pagano M. SCF ubiquitin ligase-targeted therapies. Nat. Rev. Drug Discov. 2014;13:889–903. doi: 10.1038/nrd4432. - DOI - PMC - PubMed
    1. Yang Y., Kitagaki J., Dai R.-M., Tsai Y.C., Lorick K.L., Ludwig R.L., Pierre S.A., Jensen J.P., Davydov I.V., Oberoi P., et al. Inhibitors of ubiquitin-activating enzyme (E1), a new class of potential cancer therapeutics. Cancer Res. 2007;67:9472–9481. doi: 10.1158/0008-5472.CAN-07-0568. - DOI - PubMed
    1. Harrigan J.A., Jacq X., Martin N.M., Jackson S.P. Deubiquitylating enzymes and drug discovery: emerging opportunities. Nat. Rev. Drug Discov. 2018;17:57–78. doi: 10.1038/nrd.2017.152. - DOI - PMC - PubMed

MeSH terms

Substances

LinkOut - more resources