. 2025 Apr 3;16(1):241.
doi: 10.1038/s41419-025-07587-z.

Genome-wide CRISPR screen identifies BUB1 kinase as a druggable vulnerability in malignant pleural mesothelioma

Affiliations

Genome-wide CRISPR screen identifies BUB1 kinase as a druggable vulnerability in malignant pleural mesothelioma

Ece Cakiroglu et al. Cell Death Dis. .

Abstract

Malignant pleural mesothelioma (MPM) is a rare yet highly aggressive malignancy with a severe prognosis. Compounded by the lack of effective treatment modalities, MPM remains a formidable health challenge. Therefore, the identification of actionable liabilities is critical for advancing precision medicine to combat this lethal disease. Here, we exploit an unbiased genome-wide CRISPR screen, integrating and cross-comparing three MPM cell lines with nonmalignant mesothelial cells, to selectively map the gene targets whose depletion indicates a common dependency in MPM cells. This systematic approach unveils a cohort of verifiable genes, among which BUB1, a mitotic checkpoint serine/threonine kinase, emerges as a high-confidence hit in cancer cells. Cellular and molecular studies demonstrate that genetic depletion or pharmacological inhibition of BUB1 profoundly impairs MPM cell survival and growth while inducing G2/M cell cycle arrest, cellular senescence, and apoptosis, and attenuating functional hallmarks of aggressive cancer cells. Transcriptomic profiling of BUB1-depleted cells discloses differential gene expression signatures congruent with cell fate phenotypes, including the reprogramming of mitotic network genes. Mechanistically, BUB1 is indispensable for the proper localization of essential mitotic regulators MAD1, MAD2, and Shugoshin (SGO1), thereby ensuring the functionality of the spindle assembly checkpoint (SAC). Furthermore, BUB1 ablation leads to cytokinesis failure and multinucleation, a phenotype characterized by the downregulation of CDC20, Cyclin A, and Cyclin B, and a reciprocal upregulation of the cyclin-dependent kinase inhibitor p21. Clinically, MPM tumors exhibit elevated levels of BUB1, and high BUB1 expression is associated with shorter patient survival. Our novel findings accentuate comparative CRISPR screens as a powerful platform to explore tumor cell-selective gene essentiality and propose BUB1 kinase as a potential marker and druggable vulnerability with therapeutic implications for MPM.


Conflict of interest statement

Competing interests: The authors declare no competing interests. Ethics approval: All methods were performed in accordance with the relevant guidelines and regulations.

Figures
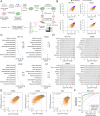
Fig. 1
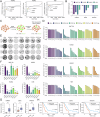
Fig. 1. CRISPR screening of MPM and nonmalignant cell lines.
A Schematic workflow of genome-wide loss-of-function CRISPR screens conducted in MeT-5A, H2052, H2452, and H28 cell lines. Cas9-expressing monoclonal cell lines were transduced with Brunello library at MOI ≌ 0.3 and selected with puromycin. Genomic DNA was extracted from T0 and T14 cell pellets. gRNA-targeted regions were amplified by PCR and sequenced on the HiSeq2500 system. Data were analyzed using MAGeCK software. High-confidence hits were identified based on negative CRISPR viability scores (depleted). B The dot plot showing the distributions of log2 normalized T14 gRNA read counts relative to T0 gRNA read counts. gRNAs targeting 360 core essential genes [88] (orange dots) and non-targeting gRNAs (blue dots), negative controls in the Brunello library, are shown. C Cellular and molecular pathways involving the genes with the highest depletion scores in the CRISPR screens were obtained by pathway enrichment analysis. D The log2 fold change of gRNAs for top-ranked and bottom-ranked 5 genes is depicted. The gRNAs with negative log2 fold change were represented as blue lines and the ones with positive log2 fold change were represented as red lines. E Correlation between our genome-wide CRISPR screen and CRISPR knockout screen data from the Project Achilles (DepMap Public 23Q2+Score, Chronos, access date: 09.06.2023). Genome-wide targets (gray) and fitness/essential genes (1580, orange) are highlighted. F ROC-AUC analysis of CRISPR knockout screening data across four cell lines. False positive rates are calculated based on nonessential genes and graphed in relation to the true positive rate, which is determined by essential genes.
Fig. 2
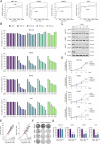
Fig. 2. Validation of high-confidence CRISPR screening hits.
A Dot plots indicate CRISPR viability scores of all genes (gray dots) and significantly depleted AURKA, CDK2, and VPS37A genes (colored dots). B Chart visualization of CRISPR viability scores for AURKA, CDK2, and VPS37A genes in MeT-5A, H2052, H2452, and H28 cell lines. C Schematic illustration of competitive cell proliferation assay. Partially transduced cells are examined for Venus positivity in a time-dependent manner. A significant decrease in the percentage of Venus-positive cells infected with gRNA indicates prominent cell depletion over time, implicating the essential role of the targeted gene. D Competitive cell proliferation assay results of MeT-5A, H2052, H2452, and H28 cells infected with gRNAs targeting AURKA, CDK2, and VPS37A genes. The percentage of Venus-positive cells at Day 0 was normalized to 100%, and the following measurements were calculated accordingly. Bar graphs are presented as the mean ± SD of three replicates. E Representative images showing decreased 2D colony formation capacity of MeT-5A, H2052, H2452, and H28 cell lines upon AURKA, CDK2, and VPS37A depletion. Colony formation assay was performed in triplicates in 12-well cell culture plates for 10–14 days. High-resolution images of the plates were acquired by LI-COR Odyssey CLx Imaging System. F Crystal violet intensity data showing the relative difference in 2D colony formation capacity of gRen and AURKA, CDK2, and VPS37A gRNA expressing cells. Image Studio software was used to measure signal intensities. Bar graphs are presented as the mean ± SD of three replicates. Two-tailed Student’s t-test was used for statistical analysis. *p < 0.05, **p < 0.01, ***p < 0.001, ns not significant. G Box–Whisker plot of AURKA, CDK2, and VPS37A mRNA expression levels in MPM (n = 39) and normal tissues (n = 9) from GSE42977 dataset. Statistical significance was calculated by a two-tailed Mann–Whitney test. **p < 0.01, ***p < 0.001. H The Kaplan–Meier survival plots for AURKA, CDK2, and VPS37A genes indicate survival rates of MPM patients (the TCGA MPM dataset) whose tumors have high gene expression (orange) relative to the low/medium patients (blue). p values are shown on the plots.
Fig. 3
Fig. 3. BUB1 is a critical regulator of MPM cell survival and proliferation.
A Dot plots indicate the CRISPR viability scores of the BUB1 gene in all four cell lines. B Competitive cell proliferation assay results of MeT-5A, H2052, H2452, and H28 cells infected with gRNAs targeting the BUB1 gene. The percentage of Venus-positive cells at Day 0 was normalized to 100%, and the following measurements were calculated accordingly. Bar graphs are presented as the mean ± SD of three replicates. C Western blot assessment of BUB1 knockout in MeT-5A, H2052, H2452, and H28 cells. Cells were infected with lentiCRISPR v2 gRen (control) or lentiCRISPR v2 BUB1 (g1, g2, g3, and g4) lentiviral vectors and selected with puromycin for 3 days. BUB1 levels were detected at 6 days post-infection. β-actin was used as the equal loading control. D The MTT assay measures the proliferation rates of BUB1-depleted MeT-5A, H2052, H2452, and H28 cells. Data are presented as the mean ± SD of six replicates. Two-tailed Student’s t-test was used for statistical analysis. *p < 0.05, ***p < 0.001, ns not significant. E Correlation analysis of expression levels between BUB1 and proliferation markers Ki67 and PCNA in the TCGA MPM dataset. Log2 transformed mRNA levels were compared through cBioPortal. Pearson correlation coefficient (r) for Ki67 is 0.91 (p value = 1.08e-33), and for PCNA, it is 0.68 (p value = 3.09e-13). F Representative images showing decreased 2D colony formation capacity of MeT-5A, H2052, H2452, and H28 cell lines upon BUB1 depletion. Colony formation assay was performed in triplicates in 12-well cell culture plates for 10–14 days. High-resolution images of the plates were acquired by LI-COR Odyssey CLx Imaging System. G Crystal violet intensity data showing the relative difference in 2D colony forming capacity of gRen and BUB1 gRNA expressing cells. Image Studio software was used to measure signal intensities. Bar graphs are presented as the mean ± SD of three replicates. Two-tailed Student’s t-test was used for statistical analysis. **p < 0.01, ***p < 0.001, ns not significant.
Fig. 4
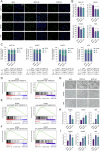
Fig. 4. BUB1 depletion disrupts cell cycle progression and induces senescence and apoptosis in MPM cells.
A Representative image of BrdU incorporation assay showing reduced cell proliferation index (BrdU positivity, green, 12 h labeling) of BUB1-depleted cells. DAPI was used as a nuclear counterstain (Blue). Scale bar: 50 μm. B BrdU-positive cell percentages are presented as the mean ± SD, n = 6. Two-tailed Student’s t-test was used for statistical analysis. **p < 0.01, ***p < 0.001, ns not significant. C Distribution of cell cycle phases of BUB1-depleted cells. Data are presented as mean ± SD, n = 3. Statistical analysis for multiple comparisons was performed by two-way ANOVA. *p < 0.05, **p < 0.01, ***p < 0.001, ns not significant. GSEA plots from H2052 and H2452 cell lines. The plots indicate significantly depleted E2F (D), MYC (E), and G2/M checkpoint (F) target gene expression, all reflecting repression of cell proliferation in MPM cell lines with BUB1 knockout (BUB1 KO). The y-axis represents the enrichment score (ES). The significance of correlation is depicted on the x-axis, by the red color for positive and the blue color for negative correlation. Normalized enrichment score (NES), false discovery rate (FDR), and p values are shown. G Representative images of SA-β-Gal staining (blue) assay identifying increased senescence in BUB1-depleted cells compared to gRen control cells. Scale bar: 100 µm. H Percentage of SA-β-Gal staining. All cell populations as well as SA-β-Gal stained cells were counted and the percentage of SA-β-Gal staining was calculated by proportioning the number of stained cells to the total number of cells. Data are presented as mean ± SD, n = 4. Two-tailed Student’s t-test was used for statistical analysis. *p < 0.05, **p < 0.01, ***p < 0.001. I Bar graphs of the Annexin V/PI apoptosis assay revealing increased apoptosis in BUB1-depleted cells compared to gRen control cells. The percentage of apoptotic cells was calculated as the sum of early and late apoptosis. Data are presented as mean ± SD, n = 3. Two-tailed Student’s t-test was used for statistical analysis. *p < 0.05, **p < 0.01, ***p < 0.001, ns not significant.
Fig. 5
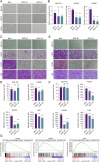
Fig. 5. Impact of BUB1 knockout on aggressive cell fates and EMT signature.
A Representative image of soft agar colony formation assay. Scale bar: 100 µm. B Bar graphs showing the number of colonies with a diameter greater than 35 µm. Data are presented as mean ± SD, n = 4. Two-tailed Student’s t-test was used for statistical analysis. ***p < 0.001, ns not significant. Representative images of transwell migration (C) and invasion (E) assays in BUB1-depleted cells, with their relative controls. Scale bar: 100 μm. Migrated (D) and invaded (F) number of cells per field. ImageJ software was used for manual cell counting. Data are presented as the mean ± SD, n = 6. Two-tailed Student’s t-test was used for statistical analysis. *p < 0.05, **p < 0.01, ***p < 0.001, ns not significant. G Representative GSEA plots from H2052, H2452, and H28 cell lines. The plots show significantly depleted EMT target genes, reflecting decreased cell motility in MPM cells with BUB1 knockout (BUB1 KO). The y-axis represents the enrichment score (ES). The degree of correlation is represented on the x-axis, by the red color for positive and the blue color for negative correlation. Normalized enrichment score (NES), false discovery rate (FDR), and p values are shown.
Fig. 6
Fig. 6. BUB1 depletion disrupts spheroid growth and highlights prognostic significance in MPM.
A Representative image of hanging drop assay. BUB1 depletion impaired the spheroid formation capacity of MPM cells. Spheroids (n = 13, for each condition) were imaged using a stereo microscope. Scale bar: 200 μm. B The Box–Whisker plot of BUB1 mRNA expression levels in GSE2549, GSE42977, GSE51024, and GSE117668 datasets. C Representative IHC images depicting different immunoreactivity scores (IRS, ranging from 0 to 6) of BUB1 staining in MPM tissues. IRS was calculated by the multiplication of proportion of positive cells and the intensity of staining. Scale bar: 20 μm. D IHC-based analysis of BUB1 protein expression in human MPM tumor tissues (n = 10) compared to noncancerous normal samples (n = 10). MM: mesothelioma of other tissues. Two-tailed Student’s t-test was used for statistical analysis. *p < 0.05, **p < 0.01. E The Kaplan–Meier survival plots of BUB1 in the TCGA MPM and GSE2549 datasets compare high gene expression (orange) relative to the low/medium or low patients (blue). p values are shown on the plots.
Fig. 7
Fig. 7. BUB1 overexpression amplifies proliferative and malignant phenotypes.
A BUB1 protein levels in empty vector (Vector) and BUB1 overexpression vector (BUB1) transduced H2052, H2452, and H28 cells. β-actin was used as a loading control. B Representative images showing increased 2D colony formation capacity of H2052, H2452, and H28 cell lines upon BUB1 overexpression. Colony formation assay was performed in triplicates in 12-well cell culture plates for 10–14 days. High-resolution images of the plates were acquired by LI-COR Odyssey CLx Imaging System. C Crystal violet intensity data showing the relative difference in 2D colony forming capacity of Vector and BUB1-overexpressing cells. Image Studio software was used to measure signal intensities. Bar graphs are presented as the mean ± SD of three replicates. Two-tailed Student’s t-test was used for statistical analysis. *p < 0.05 and **p < 0.01. D Representative images of BrdU incorporation assay identifying increased cell proliferation index (BrdU positivity, red, 12 h incubation) in BUB1-overexpressing H2052, H2452, and H28 cells compared to Vector control cells. DAPI was used as the nuclear counterstain (Blue). Scale bar: 100 μm. E BrdU-positive cell percentages are presented as the mean ± SD, n = 6, n = 5 for H2452. Two-tailed Student’s t-test was used for statistical analysis. **p < 0.01 and ***p < 0.001, ns not significant. F Representative images of soft agar colony formation assay. Scale bar: 100 µm. G Bar graphs showing the number of colonies with a diameter greater than 35 µm. Data are presented as mean ± SD, n = 5 for H2052, n = 4 for H2452. Two-tailed Student’s t-test was used for statistical analysis. *p < 0.05 and **p < 0.01. Representative images of transwell migration (H) and invasion (J) assays upon BUB1 overexpression with their relative controls. Scale bar: 100 μm. Migrated (I) and invaded (K) number of cells per field. ImageJ software was used for manual cell counting. Data are presented as the mean ± SD, n = 6. Two-tailed Student’s t-test was used for statistical analysis. *p < 0.05, **p < 0.01, ***p < 0.001.
Fig. 8
Fig. 8. BUB1 is indispensable for maintaining SAC integrity and cytokinesis.
A Heatmap depicting the expression levels of BUB1 local network genes (highlighted in Fig. S9A) in BUB1 knockout (BUB1 KO) H2052 and H2452 cells. B BUB1, Cyclin B, Cyclin A, CDC20 and p21 protein levels in BUB1 WT vs BUB1 KO cells. β-actin was used as a loading control. C Localization of MAD1, MAD2, and SGO1 in mitotic MPM cells demonstrated through immunofluorescence staining. Cells were synchronized with a 12 h thymidine block followed by a 12 h release in a complete culture medium or 150 mM nocodazole for H28 cells. The images were captured as z-stacks using Apotome 3 (Zeiss) and subsequently processed into stacked projections. D Time-lapse live cell microscopy illustrating mitotic progression of BUB1 knockout H2452 cells compared to control. Cells were stained with Hoechst and monitored using confocal microscopy by acquiring z-stacks every 10 min for 20 h. Representative image sequences were aligned on the time axis and presented in the figures.
Fig. 9
Fig. 9. Pharmacological inhibition of BUB1 kinase attenuates MPM cell phenotypes.
A MTT assay measuring the IC50 values of H2052, H2452, and H28 cells. Cells were treated with increasing doses of BAY-1816032 ranging from 0.25 to 10 μM. Control cells were treated with DMSO. The experiment was performed in 2 biological and 6 technical replicates. B Representative images showing 2D colony formation capacity of H2052, H2452, and H28 cell lines upon BAY-1816032 treatment. Experiments were performed in triplicates in 12-well plates. Cells were treated for 3 days with IC50 and two doses under IC50 of BAY-1816032 and cultured for another 7–11 days. High-resolution images were captured with the LI-COR Odyssey CLx Imaging System. C Crystal violet intensity data showing the relative difference in 2D colony forming capacity of Vehicle (DMSO) and BAY-1816032 treated cells. Image Studio software was used to measure signal intensities. Bar graphs are presented as the mean ± SD of three replicates. Two-tailed Student’s t-test was used for statistical analysis. ***p < 0.001. D Bar graphs showing the decrease in size of spheroids upon pharmacological BUB1 inhibition. Data are presented as mean ± SD, n = 6. Two-tailed Student’s t-test was used for statistical analysis. ***p < 0.001. E Distribution of cell cycle phases of BAY-1816032 treated H2052, H2452, and H28 cells. Data are presented as mean ± SD, n = 3. Statistical analysis was performed by two-way ANOVA multiple comparison. *p < 0.05, **p < 0.01, ***p < 0.001, ns not significant. Representative images of transwell migration (F) and invasion (H) assays of BAY-1816032 treated cells, with their relative controls. Scale bar: 100 μm. Migrated (G) and invaded (I) number of cells per field. ImageJ software was used for manual cell counting. Data are presented as the mean ± SD, n = 6. Two-tailed Student’s t-test was used for statistical analysis. ***p < 0.001.

References

    1. Sung H, Ferlay J, Siegel RL, Laversanne M, Soerjomataram I, Jemal A, et al. Global Cancer Statistics 2020: GLOBOCAN estimates of incidence and mortality worldwide for 36 cancers in 185 countries. CA Cancer J Clin. 2021;71:209–49. - PubMed
    1. Beebe-Dimmer JL, Fryzek JP, Yee CL, Dalvi TB, Garabrant DH, Schwartz AG, et al. Mesothelioma in the United States: a Surveillance, Epidemiology, and End Results (SEER)-Medicare investigation of treatment patterns and overall survival. Clin Epidemiol. 2016;8:743–50. - PMC - PubMed
    1. Cakiroglu E, Senturk S. Genomics and functional genomics of malignant pleural mesothelioma. Int J Mol Sci. 2020;21:6342. - PMC - PubMed
    1. Scherpereel A, Wallyn F, Albelda SM, Munck C. Novel therapies for malignant pleural mesothelioma. Lancet Oncol. 2018;19:e161–72. - PubMed
    1. Bronte G, Incorvaia L, Rizzo S, Passiglia F, Galvano A, Rizzo F, et al. The resistance related to targeted therapy in malignant pleural mesothelioma: Why has not the target been hit yet? Crit Rev Oncol Hematol. 2016;107:20–32. - PubMed

MeSH terms

Substances

LinkOut - more resources