. 2025 Apr 3;16(1):2899.
doi: 10.1038/s41467-025-57512-3.

Polycystins recruit cargo to distinct ciliary extracellular vesicle subtypes in C. elegans

Affiliations

Polycystins recruit cargo to distinct ciliary extracellular vesicle subtypes in C. elegans

Inna A Nikonorova et al. Nat Commun. .

Abstract

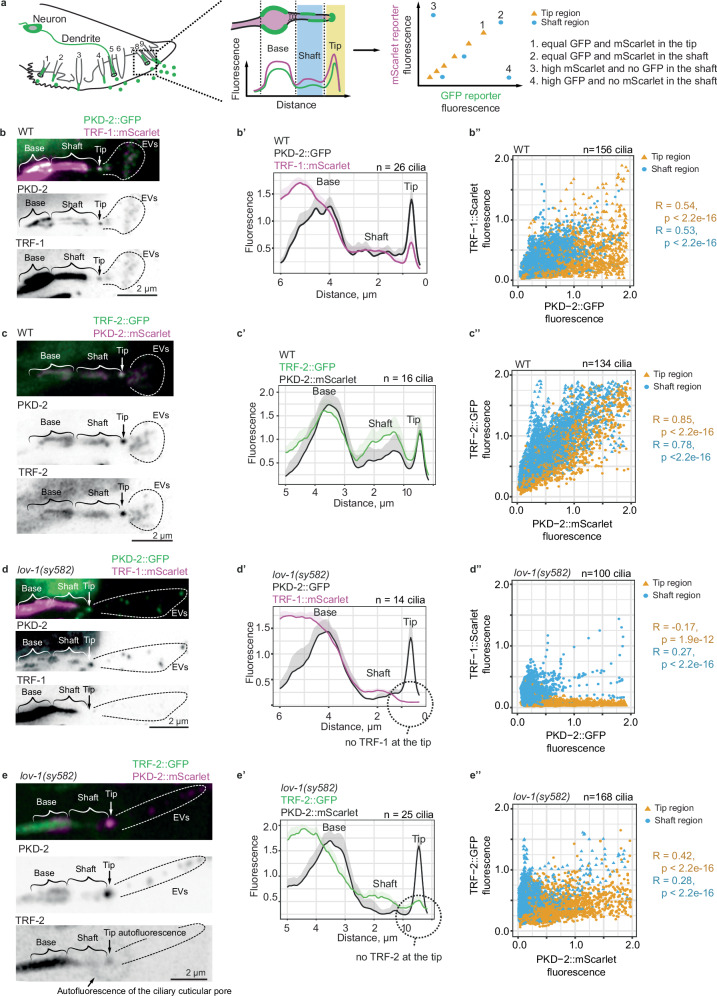
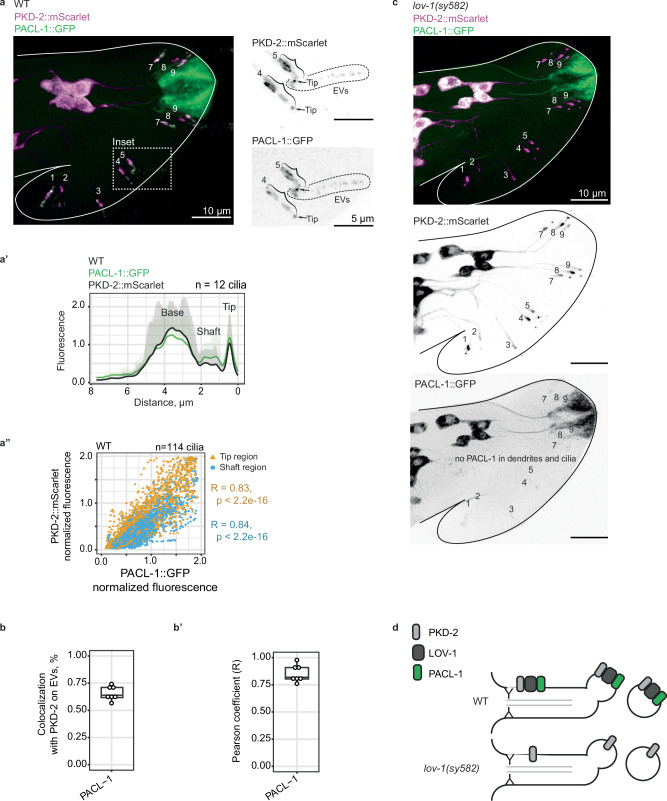
Therapeutic use of tiny extracellular vesicles (EVs) requires understanding cargo loading mechanisms. Here, we use a modular proximity labeling approach to identify the cargo of ciliary EVs associated with the transient receptor potential channel polycystin-2 PKD-2 of C. elegans. Polycystins are conserved ciliary proteins and cargo of EVs; dysfunction causes polycystic kidney disease in humans and mating deficits in C. elegans. We discover that polycystins localize with specific cargo on ciliary EVs: polycystin-associated channel-like protein PACL-1, dorsal and ventral polycystin-associated membrane C-type lectins PAMLs, and conserved tumor necrosis factor receptor-associated factor (TRAF) TRF-1 and TRF-2. Loading of these components to EVs relies on polycystin-1 LOV-1. Our modular EV-TurboID approach can be applied in both cell- and tissue-specific manners to define the composition of distinct EV subtypes, addressing a major challenge of the EV field.


Conflict of interest statement

Competing interests: The authors declare no competing interests.

Figures

Fig. 1
Fig. 1. Indirect proximity labeling within PKD-2-carrying EVs identified candidate interactors of the polycystin complex.
a Scheme of EV harvest and enrichment, followed by pulldown of candidate interactors biotinylated by TurboID targeted to PKD-2-carrying EVs. b Scheme of male tail sensory rays that release PKD-2 EVs. Each sensory ray of the male tail harbors a ciliated dendritic ending protruding into the environment and releasing PKD-2 EVs from the tip of its sensory cilium. c Fluorescence image of EVs released from the sensory rays carrying PKD-2::GFP and TurboID indicative of successful targeting of the biotin ligase to PKD-2-carrying EVs. See Supplementary Fig. 1 for additional images. d Identified top candidate PKD-2 interactors, validated in subsequent figures. Created in BioRender. Barr, M. (2025) https://BioRender.com/n98b409.
Fig. 2
Fig. 2. LOV-1 is required for loading TRFs to ciliary PKD-2-carrying EVs.
a Scheme of fluorescent profiling along cilia and assessment of reporter colocalization. Flattened z-stacks show the ciliary presence of endogenous FP-tagged PKD-2 with TRF-1::mScarlet (b, d) and TRF-2::GFP (c, e) in the wild-type cilium (b, c) and lov-1 mutant (d, e). Representative average fluorescence profiles for each case are shown in panels b’, c’, d’, e’. Fluorescence values are normalized to the average of the minimum and maximum for each cilium. Scatter plots on panels b”, c”, d”, and e” show correlations between PKD-2 fluorescence and either TRF-1::mScarlet (b”, d”) or TRF-2::GFP (c”, e”) within shafts (blue) and tips (yellow) of cilia. Pearson correlation coefficients from a two-sided test are reported alongside unadjusted p-values. Loss of colocalization is observed in lov-1 mutants as reflected by a drop in the Pearson correlation coefficients. Correlation plots contain the combined data for all Ray B neurons of the tail. Sample sizes are indicated for each panel graph. For the full dataset that includes all rays, refer to Supplementary Figs. 2-3. Source Data are provided as SourceData_Main.xls, SourceData_SuppFig2.xls, and SourceData_SuppFig3.xls files.
Fig. 3
Fig. 3. TRFs require each other for their loading to ciliary EVs.
a Flattened z-stack shows that disruption of trf-2 abrogates loading of TRF-1::mScarlet to PKD-2::GFP EVs. TRF-1::mScarlet stays in the cilium and does not reach the ciliary tip, as a representative fluorescent profiling shows (a’); fluorescence values are normalized to the average of minimum and maximum values for each cilium (n = 10 cilia). a” Scatter plot shows no correlation between PKD-2::GFP and TRF-1::mScarlet within shafts (blue) and tips (yellow) of cilia (n = 122 cilia) of the trf-2(tm5167) mutant. Pearson correlation coefficients from a two-sided test are reported alongside unadjusted p-values. For the full dataset that includes all rays, refer to Supplementary Fig. 6. Source Data are provided as SourceData_Main.xls and SourceData_SuppFig6.xls files. b Flattened z-stack shows that disruption of trf-1 abrogates ciliary localization of TRF-2::GFP, and thus, no TRF-2::GFP is loaded to PKD-2::mScarlet EVs. b’ Quantification of total fluorescence within the cilium shows that TRF-2::GFP ciliary levels in the trf-1 mutant are reduced tenfold compared to WT cilia, whereas PKD-2::mScarlet total levels remain unaffected. n = 73 cilia for WT, and 112 cilia for the trf-1(nr2014) mutant. Two-sided Wilcoxon Rank Sum test, p < 2.2e-16 for TRF-2::GFP, and p = 0.006035 for PKD-2::mScarlet. c Flattened z-stack through cell bodies of RnB neurons showing reduced cytoplasmic levels of TRF-2::GFP. c’ Quantification of cell body cytoplasmic levels of PKD-2::mScarlet and TRF-2::GFP as a ratio of average cytoplasmic fluorescence normalized by fluorescence within the nucleus on a single image plane, n = 96 cell bodies for WT, n = 147 cell bodies for the trf-1(nr2014) mutant. Two-sided Wilcoxon Rank Sum test, p < 2.2e-16 for TRF-2::GFP, and p = 0.4343 for PKD-2::mScarlet. The box-and-whiskers plots (b’ and c’) show the median values where the box covers two quartiles around the median, and the whiskers extend 1.5 quartiles from the median. Source Data are provided as SourceData_Main.xls file. d Homology of C. elegans TRFs to human TRAFs. e Working model of the molecular mechanism for loading TRFs to ciliary EVs. LOV-1 is required for loading both TRFs to ciliary EVs; in the lov-1 mutant, cilia produce EVs without TRFs. TRFs are required for loading each other to the ciliary EVs; in the trf-2 mutant, cilia produce EVs without TRF-1, whereas the trf-1 mutation abrogates TRF-2 ciliary localization. Additional supporting data for the model are presented in Supplementary Fig. 4, showing the colocalization of TRF-1::mScarlet and TRF-2::GFP, and Supplementary Fig. 5, showing that TRFs are not required for release of polycystins in ciliary EVs. Source Data are provided as SourceData_SuppFig4.xls and SourceData_SuppFig5.xls files.
Fig. 4
Fig. 4. The polycystin complex associates with and recruits a channel-like protein PACL-1 to cilia and EVs.
a Flattened z-stack showing colocalization of PKD-2::mScarlet with PACL-1::GFP in WT cilia with a representative fluorescence profile (n = 12 cilia) (a’) and a cumulative correlation plot (n = 114 cilia) (a”) showing a high level of colocalization in the ciliary tip and shaft regions. Pearson correlation coefficients from a two-sided test are reported alongside unadjusted p-values. For the full dataset that includes all rays, refer to Supplementary Fig. 8. Source Data are provided as SourceData_Main.xls and SourceData_SuppFig8.xls files. bb’ Quantification showing colocalization of PACL-1::GFP to PKD-2::mScarlet on ciliary EVs (b) with high Pearson correlation (two-sided) coefficients for raw fluorescent intensities (b’), n = 7 animals. The box-and-whiskers plots show the median values where the box covers two quartiles around the median, and the whiskers extend 1.5 quartiles from the median. Source Data are provided as SourceData_Main.xls file. c Flattened z-stacks show that in the lov-1 mutant, PACL-1::GFP remains in the cell bodies and fails to move to dendrites and cilia. d Working model of the molecular mechanism loading PACL-1 to ciliary EVs. LOV-1 is required for PACL-1 ciliary localization. In the lov-1 mutant, cilia produce EVs without PACL-1. A rationale for the PACL-1 channel-like identity is presented in Supplementary Fig. 7.
Fig. 5
Fig. 5. The polycystin complex associates with transmembrane C-type lectins that specify dorsal and ventral populations of polycystin cilia and EVs.
Flattened z-stacks showing colocalization of PKD-2 reporters with PAML-1::GFP (a) and PAML-2::mScarlet (b) in WT. PAML-1 is present in cilia of ventral HOB neuron and paired ray neurons R2B, R4B, R8B, and lateral R3B; whereas PAML-2 is present in cilia of dorsal ray neurons R1B, R5B, R7B, and lateral R9B. c Left panel shows % of EVs with colocalization of PAML-1::GFP with PKD-2::mScarlet released from ventral but not dorsal rays, and PAML-2::mScarlet with PKD-2::GFP in EVs released from dorsal but not ventral rays. The right panel shows Pearson correlation (two-sided) coefficients for each point of the left panel, n = 9 animals for PAML-1::GFP colocalization with PKD-2::mScarlet, and n = 11 animals for PAML-2::mScarlet colocalization with PKD-2::GFP. The box-and-whiskers plots show the median values where the box covers two quartiles around the median, and the whiskers extend 1.5 quartiles from the median. Source Data are provided as SourceData_Main.xls file. d Scheme of PAML-1::GFP and PAML-2::mScarlet localization in HOB and RnB neuronal cell bodies and cilia. The color of the cell body indicates the expression of the corresponding protein, and the color of the cilium indicates the presence of the corresponding protein in the cilium. Disruption of lov-1 abrogates ciliary localization of PAML-1::GFP (e) and PAML-2::mScarlet (f). g Flattened z-stack showing that disruption of the paml-1 gene results in PAML-2::mScarlet ciliary localization in ventral neurons. For the full dataset on fluorescence profiling of each ray, refer to Supplementary Figs. 9-10. Quantification of the aberrant presence of PAML-2::mScarlet in ventral cilia of paml-1(tm12527) mutants is presented in Supplementary Fig. 11. Source Data are provided as SourceData_Main.xls, SourceData_SuppFig9.xls, and SourceData_SuppFig10.xls files.
Fig. 6
Fig. 6. The polycystin complex is not required for shedding ciliary EVs as evidenced by tracking cargo CWP-5.
a Flattened z-stacks showing colocalization of PKD-2::mScarlet with CWP-5::GFP. CWP-5 is enriched in the ciliary transition zone with low levels of PKD-2::mScarlet. a’ Representative average fluorescence profile of CWP-5::GFP and PKD-2::mScarlet along the cilium (n = 20 cilia). Note the prominent presence of CWP-5::GFP in the areas with low levels of PKD-2::mScarlet – the transition zone (TZ) and the neck of the cilium. For the full dataset on fluorescence profiling of each ray, refer to Supplementary Figs. 12-13. Flattened z-stacks showing that disruption of lov-1 (b) and pkd-2 (c) does not alter CWP-5::GFP ciliary and EV localization. d Working model of the molecular mechanism for loading CWP-5::GFP to cilia and ciliary EVs. CWP-5 ciliary localization and release in EVs is independent of polycystins LOV-1 and PKD-2. Source data are provided as SourceData_Main.xls and SuppFig13.xls files.
Fig. 7
Fig. 7. The polycystin complex, PACL-1, and the PAMLs act in the same genetic pathway.
a A diagram showing steps in the male mating behavior controlled by the polycystin pathway—response to hermaphrodite and vulva location. b Assessment of male mating behavior shows that the pacl-1 mutant is deficient in responding to hermaphrodite contact. Number of mating trails conducted were: n = 6 WT, 3 pacl-1(tm12580), 5 pkd-2(sy606), and 3 pacl-1(tm12580)rescue. Vulva location behavior of the pacl-1 mutants could not be assessed due to their severe response defect. Assessment of male mating behavior shows that the paml-1; paml-2 double mutant is deficient in responding to hermaphrodite contact (c), and location of vulva (d, e). Number of mating trails conducted were: n = 8 WT, 3 paml-1(tm12527), 3 paml-2(my155), and 8 paml-1(tm12527); paml-2(my155) double mutant. 20 adult males were tested in each mating trial. Bar graphs represent mean values +/- SD. One-way ANOVA analyzed data with the Tukey post hoc adjustment. Source data are provided as SourceData_Main.xls file.
Fig. 8
Fig. 8. Working model of cargo loading to polycystin ciliary EVs of C. elegans.
A single genetic perturbation leads to a drastic change in EV cargo composition. Compare WT polycystin EVs (a) with EVs of the lov-1 and pkd-2 mutants (b). Refer to the Discussion, Limitations of Study, and Supplementary Figs. 11 and 12 legend sections for a detailed description.

Update of

References

    1. Welsh, J. A. et al. Minimal information for studies of extracellular vesicles (MISEV2023): from basic to advanced approaches. J. Extracell. Vesicles13, e12404 (2024). - PMC - PubMed
    1. Luxmi, R. & King, S. M. Cilia-derived vesicles: an ancient route for intercellular communication. Semin Cell Dev. Biol.129, 82–92 (2022). - PMC - PubMed
    1. Wang, J. & Barr, M. M. Ciliary extracellular vesicles: Txt msg organelles. Cell Mol. Neurobiol.36, 449–457 (2016). - PMC - PubMed
    1. Wang, J., Barr, M. M. & Wehman, A. M. Extracellular vesicles. Genetics227, iyae088 (2024). - PMC - PubMed
    1. Volz, A.-K. et al. Bardet-Biedl syndrome proteins modulate the release of bioactive extracellular vesicles. Nat. Commun.12, 5671 (2021). - PMC - PubMed

MeSH terms

LinkOut - more resources