. 2025 Apr 3;16(1):2900.
doi: 10.1038/s41467-025-57905-4.

A novel PLpro inhibitor improves outcomes in a pre-clinical model of long COVID

Affiliations

A novel PLpro inhibitor improves outcomes in a pre-clinical model of long COVID

Stefanie M Bader et al. Nat Commun. .

Abstract

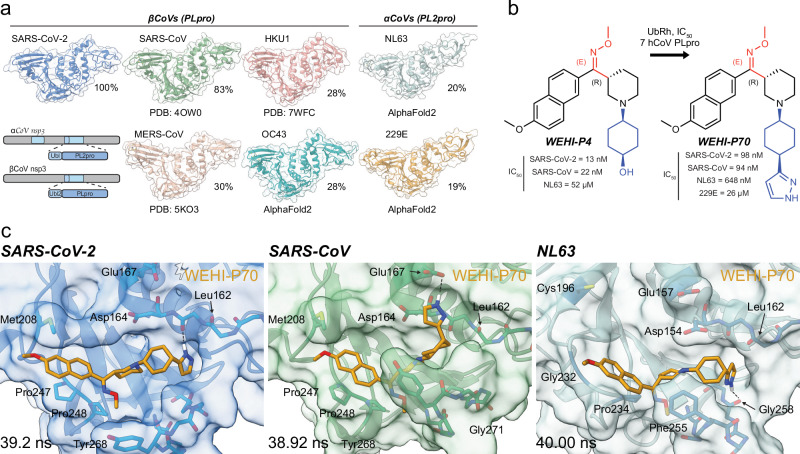
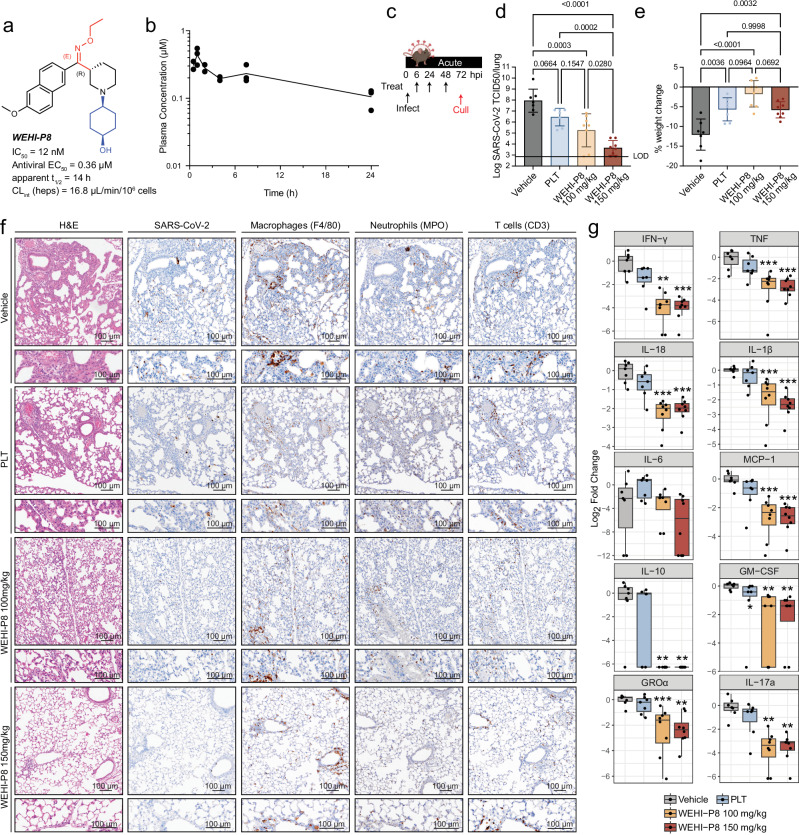
The COVID-19 pandemic caused by the coronavirus SARS-CoV-2 has highlighted the vulnerability of a globally connected population to zoonotic viruses. The FDA-approved coronavirus antiviral Paxlovid targets the essential SARS-CoV-2 main protease, Mpro. Whilst effective in the acute phase of a COVID infection, Paxlovid cannot be used by all patients, can lead to viral recurrence, and does not protect against post-acute sequelae of COVID-19 (PASC), commonly known as long COVID, an emerging significant health burden that remains poorly understood and untreated. Alternative antivirals that are addressing broader patient needs are urgently required. We here report our drug discovery efforts to target PLpro, a further essential coronaviral protease, for which we report a novel chemical scaffold that targets SARS-CoV-2 PLpro with low nanomolar activity, and which exhibits activity against PLpro of other pathogenic coronaviruses. Our lead compound shows excellent in vivo efficacy in a mouse model of severe acute disease. Importantly, our mouse model recapitulates long-term pathologies matching closely those seen in PASC patients. Our lead compound offers protection against a range of PASC symptoms in this model, prevents lung pathology and reduces brain dysfunction. This provides proof-of-principle that PLpro inhibition may have clinical relevance for PASC prevention and treatment going forward.


Conflict of interest statement

Competing interests: This work is protected under provisional patent AU2024900559. The authors declare the following competing interests; D.K. is founder, shareholder and SAB member of Entact Bio and Proxima Bio. The remaining authors declare no competing interests.

Figures

Fig. 1
Fig. 1. The WEHI-P series is a novel scaffold for PLpro inhibitors.
a High Throughput Screening cascade for the identification of PLpro inhibitors. Schematic top, Ub-Rhodamine110 (UbRh) assay was used for assessing the biochemical inhibition (IC50) of PLpro. Rhodamine110 is cleaved off the ubiquitin moiety by PLpro which releases a fluorescent signal that accumulates proportional to activity and can be measured at 535 nm. Below, a diverse library of 412,644 compounds was screened in a single concentration (29.16 µM) with one replicate. 966 compounds (hit rate of 0.23%) were identified from the primary screen. These compounds were then assessed in a 10-point titration study in the PLpro assay (confirmation) and USP21 assay (counter) in duplicate. 20.7% of primary hits, or 200 compounds, had confirmed activity in the PLpro assay. 11.5% of hits from the primary screen, or 111 compounds, showed activity in the USP21 counter-screen assay. 16 compounds displayed no activity against USP21 and were selective for PLpro. b Screening hit WEHI-P1 was optimised to WEHI-P4. The WEHI-P1 core structure represents a novel scaffold not seen in any other PLpro inhibitor and exhibits a methoxynaphthyl group bridged by a ketone (in red) to a piperidine with a substituted cyclopentyl group (in blue). Replacement of the ketone to an O-methyloxime in WEHI-P2 generated activity in the cellular FRET assay (11 µM). Replacing the cyclopentyl with a pendant cyclohexanol and enantiomer separation generated WEHI-P4 with potent biochemical, cellular and antiviral activity. Compounds were assessed for biochemical (IC50, UbRh, Supplementary Fig. 2a) cellular (FRET EC50, Supplementary Fig. 2c), and SARS-CoV-2 plaque assay activity (Antiviral EC50, Supplementary Fig. 2d), and by SPR (KD, Supplementary Fig. 2g). c Crystal structures of PLpro bound to WEHI-P1 and WEHI-P4 were determined in different space groups. The BL2 region of PLpro is coloured yellow. The BL2 loop is not involved in WEHI-P1 binding and participates in a crystal contact (Supplementary Fig. 3a-c, Supplementary Table 1). In WEHI-P4 the BL2 region is in the ‘closed’ conformation to encompass the compound. A zoomed-in view of PLpro bound to WEHI-P4 is shown with key residues labelled. d Structure of WEHI-P4 (top) and GRL0617 (bottom, PDB: 7JIR) with proteins under a semi-transparent surface. The WEHI-P series induces a conformational change of PLpro Met208 to expose a pocket not seen in the GRL-0617 bound structure or any other published PLpro inhibitor complex structures. Figure 1a Created in BioRender.
Fig. 2
Fig. 2. Pan-activity of WEHI-P series towards human CoV PLpros.
a SARS-CoV-2 is one of seven coronaviruses pathogenic to humans. βCoVs (including SARS-CoV-2) have one PLpro domain while αCoVs encode two PLpro domains in nsp-3 (indicated in cartoon, with PLpro domains in blue). αCoV PL2pro domains show high similarity to SARS-CoV-2 PLpro, and were recently confirmed to be DUBs. PDB accession codes for each structure are 4OW0 (SARS-CoV), 5KO3 (MERS), 7WFC (HKU1). AlphaFold2 was used for OC43, NL63 and 229E. Amino acid sequence identity relative to SARS-CoV-2 PLpro is indicated as a percentage (%) (see Supplementary Figs. 4b, 5). b Biochemical IC50s of WEHI-P4 and WEHI-P70 against UbRh active PLpros (see Supplementary Fig. 4d, e). c 40 ns molecular dynamics simulations docking WEHI-P70 into indicated CoV PLpro. Key residues are noted. A H-bond formed between the NH at the 2-position on WEHI-P70 and the backbone carbonyl of Gly258 in NL63 PL2pro appears to stabilise inhibitor binding.
Fig. 3
Fig. 3. WEHI-P8 improves disease outcome in an acute mouse model of severe disease.
a WEHI-P8 was selected for mouse in vivo efficacy due to its favourable ADME properties. b Calculated unbound plasma concentration of WEHI-P8 in male C57BL/6 (WT) mice following oral administration at 100 mg/kg. c Schematic showing treatment regime used in d-g. Mice were treated at 6 h, 24 h and 48 h with euthanasia performed at 72 h post-infection. WT 7-9 week-old mice were infected with SARS-CoV-2 P21 (see Supplementary Fig. 7a) and treated with either vehicle, PLT (Paxlovid-like treatment: 56 mg/kg nirmatrelvir, 19 mg/kg ritonavir), or WEHI-P8 (100 mg/kg or 150 mg/kg) (see schematic and Methods d,e At 3 days port-infection (dpi), mice were monitored for d viral burden and e percent weight change compared to initial weight; nvehicle = 7, nPLT = 7, nP8-100 = 8, nP8-150 = 8 mice per group. Mean ± SD. f Haematoxylin and eosin (H&E) and immunohistochemistry (IHC) stained lungs are shown. Markers used for each cell type are indicated in brackets and images are representative of 4 animals per condition. Scale bars = 100 µm. g Levels of cytokines and chemokines measured by ELISA of lung homogenates from mice infected with SARS-CoV-2 P21; nvehicle = 7, nPLT = 7, nP8-100 = 8, nP8-150 = 8 mice per group; boxplots depict the median and interquartile range (IQR). Whiskers extend to the furthest data point within 1.5 times the IQR from each box end. P-values are indicated above each group and were determined by e one-way ANOVA with Tukey’s multiple comparisons tests d after log10 transformation and g Two-sided wilcoxon rank-sum test, with Bonferroni adjustment for multiple comparisons; **p < 0.01, ***p < 0.001. Exact P-values for Fig. 3g are provided in the Source Data file. Source data are provided as a Source Data file. Figure 3c Partially created in BioRender.
Fig. 4
Fig. 4. A PASC mouse model.
a Schematic showing time points used to analyse long-term SARS-CoV-2 driven disease (PASC). Mice were infected intranasally with SARS-CoV-2 P21 and euthanised between 1 and 3 months post-infection (mpi). bm 9-14 week-old mice were challenged intranasally with either mock (DMEM only) or P21 and monitored daily for b percent weight change relative to initial weight and c percent of animals reaching humane endpoint requiring euthanasia (results are representative of 6 independent experiments; nmock = 11, npasc = 10 animals per group, mean ± SD). Organs were collected for: d Haematoxylin and eosin (H&E) and immunohistochemistry (IHC) staining of fixed lungs. Markers used for each cell type are indicated in brackets and images are representative from 5 animals per group. Scale bar (top) = 5 mm and (bottom) = 100 µm. e Blinded scoring of H&E-stained lung sections was performed. The lung was assessed for the presence of inflammatory foci and haemorrhage, with pathology scored on a scale from 0 to 5. A score of 0 indicated no detectable pathology, while a score of 5 represented extensive pathology; nmock = 8, n1mpi = 9, n3mpi = 13 animals per group; Mean values ± SEM. f Positive area of Picrosirius red staining was quantified relative to total lung area; nmock = 4, n1mpi = 7, n3mpi = 6 animals per group. g Lungs of mock and PASC animals were taken at 45 days post-infection (dpi) for bulk proteomics analysis. 1D annotation enrichment analysis of proteins changing in lungs post-infection compared to mock is shown (significance was set to Benjamini Hochberg FDR < 0.02). nmock = 4, npasc = 5 animals per group. h Histological analysis of H&E-stained hearts. Scale bar = 1 mm. i Quantification of right ventricle area (nmock=8, n1mpi = 5, n3mpi = 6 animals per group.; Mean ± SEM). j Histological analysis of H&E-stained intestines. k Total histological score of the small (nmock=7, n1mpi = 8, n3mpi = 10 animals per group) and large intestines (nmock=8 n1mpi = 6, n3mpi = 7 animals per group; mean values ± SEM). l IHC of fixed brains at 45 dpi, stained with IBA-1 (microglia). Scale bar = 50 µm. m Quantification of the projection area of cells positive for IBA-1 staining in the hippocampus (n = 5 animals per group; >18 cells were counted per mouse; violin plots show median and quartiles). P-values are indicated above the graph and were determined by e Mixed effect analysis with Tukey’s multiple comparison tests (f, i, k) One-way ANOVA with Tukey’s multiple comparisons tests f,I,k and m nested one-way ANOVA. Source data are provided as a Source Data file. Figure 4a Partially created in BioRender.
Fig. 5
Fig. 5. WEHI-P8 significantly reduces post-acute manifestations of disease in lungs and brain.
a Schematic showing treatment regime: Mice were treated at -2 h pre- intranasal infection with SARS-CoV-2 P21, treated again at 6 h and 24 h post-infection with either vehicle, PLT (Paxlovid-like treatment, 56 mg/kg nirmatrelvir, 19 mg/kg ritonavir) or WEHI-P8 (150 mg/kg), rested and euthanised for downstream analysis at 30 days post-infection (dpi). bi 11–12-week-old P21 infected mice were treated and monitored daily for b percent weight change relative to initial weight (mean values ± SEM) and (c) percent of animals reaching humane endpoint requiring euthanasia (results are representative of 2 independent experiments; nveh = 11, nPLT = 8, nP8 = 8 mice per group). Organs were collected for: d Haematoxylin and eosin (H&E) and immunohistochemistry (IHC) staining of lungs. Markers used for each cell type are indicated in brackets and images are representative of 4 animals per group. Scale bar (top) = 5 mm and (bottom) = 100 µm. e Blinded scoring of H&E-stained lung sections. The entire lung was assessed for the presence of inflammatory foci and haemorrhage, with pathology scored on a scale from 0 to 5. A score of 0 indicated no detectable pathology, while a score of 5 represented extensive pathology affecting the entire lung; n = 4 animals per group; Mean values ± SEM. f Quantification of the projection area of cells positive for IBA-1 (microglia) staining in the hippocampus (n = 4 animals per group; >18 cells per mouse were counted; violin plots show median and quartiles). gi Novel object recognition test. g time spent exploring the familiar and novel objects is shown. h The recognition index was calculated as a proportion of the time exploring the novel object over the total time spent exploring both objects (Chi-squared (threshold 60%) = 0.51). i Total distance (mm) travelled by mice during the novel object recognition test. nmock = 12, nveh = 18, nPLT = 8, nP8 = 8 mice per group; Mean values ± SEM. In all cases p-values are indicated above the graph and were determined by (e, g, h, i) Two-way ANOVA with Sidak’s multiple comparison tests and f nested one-way ANOVA with Tukey’s multiple comparisons test. Source data are provided as a Source Data file. Figure 5a Partially created in BioRender.

Similar articles

Cited by

References

    1. data.who.int, W. H. O. 2023. WHO Coronavirus (COVID-19) dashboard. https://data.who.int/dashboards/covid19.
    1. Kesheh, M. M., Hosseini, P., Soltani, S. & Zandi, M. An overview on the seven pathogenic human coronaviruses. Rev. Med. Virol.32, e2282 (2022). - PubMed
    1. Ball, P. The lightning-fast quest for COVID vaccines — and what it means for other diseases. Nature589, 16–18 (2021). - PubMed
    1. Toussi, S. S., Hammond, J. L., Gerstenberger, B. S. & Anderson, A. S. Therapeutics for COVID-19. Nat. Microbiol.8, 771–786 (2023). - PubMed
    1. Ballering, A. V., van Zon, S. K. R., Olde Hartman, T. C. & Rosmalen JGM; Lifelines Corona Research Initiative. Persistence of somatic symptoms after COVID-19 in the Netherlands: an observational cohort study. Lancet400, 452–461 (2022). - PMC - PubMed

LinkOut - more resources