. 2025 May;17(5):1153-1183.
doi: 10.1038/s44321-025-00227-1. Epub 2025 Apr 3.

Formyl-peptide receptor type 2 activation mitigates heart and lung damage in inflammatory arthritis

Affiliations

Formyl-peptide receptor type 2 activation mitigates heart and lung damage in inflammatory arthritis

Andreas Margraf et al. EMBO Mol Med. 2025 May.

Abstract

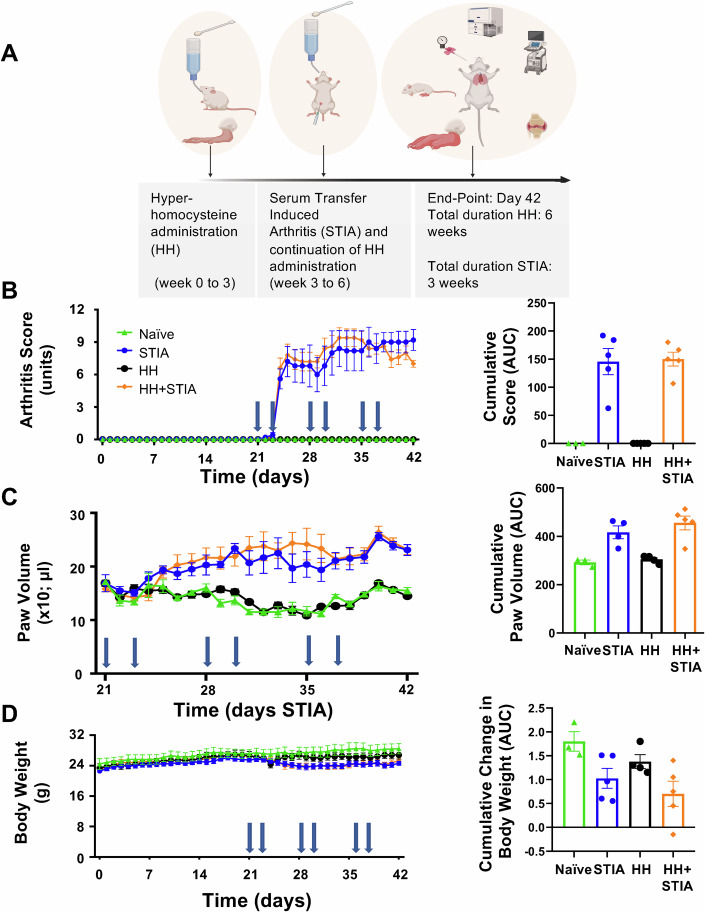
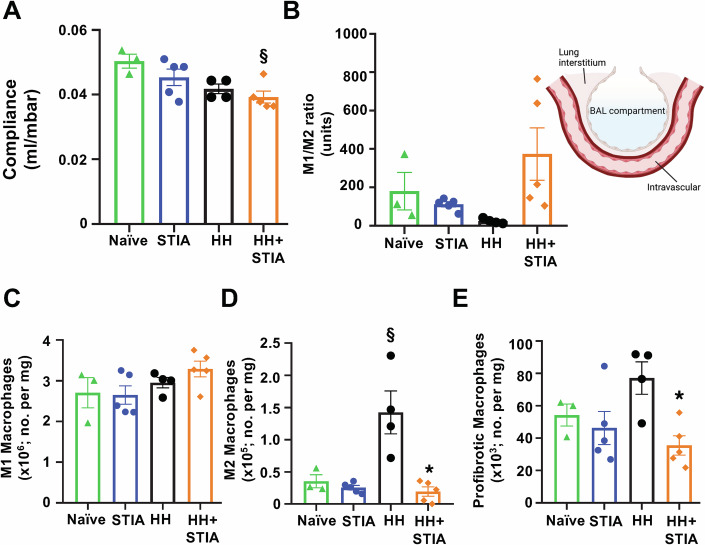
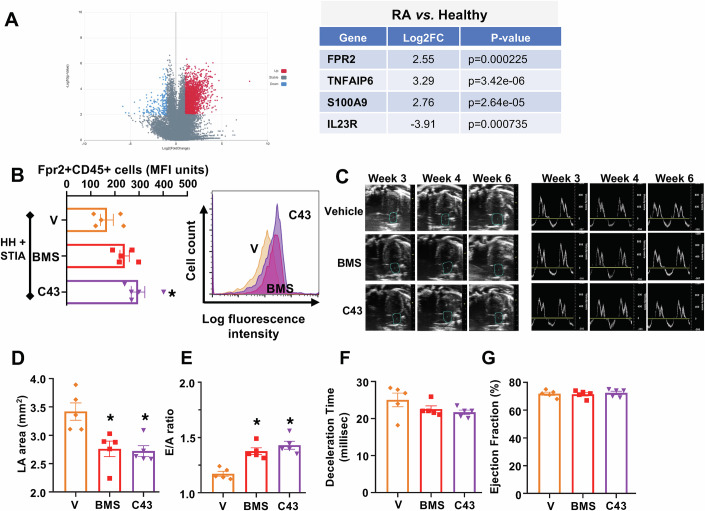
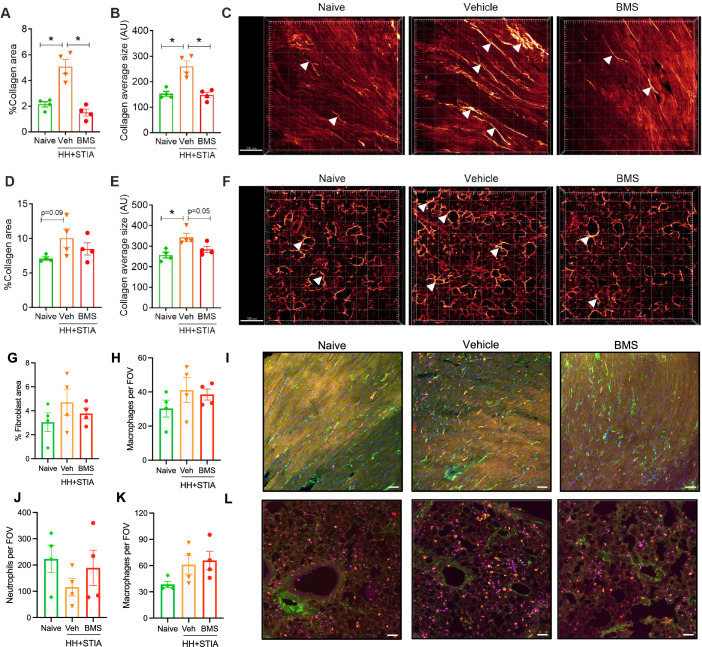
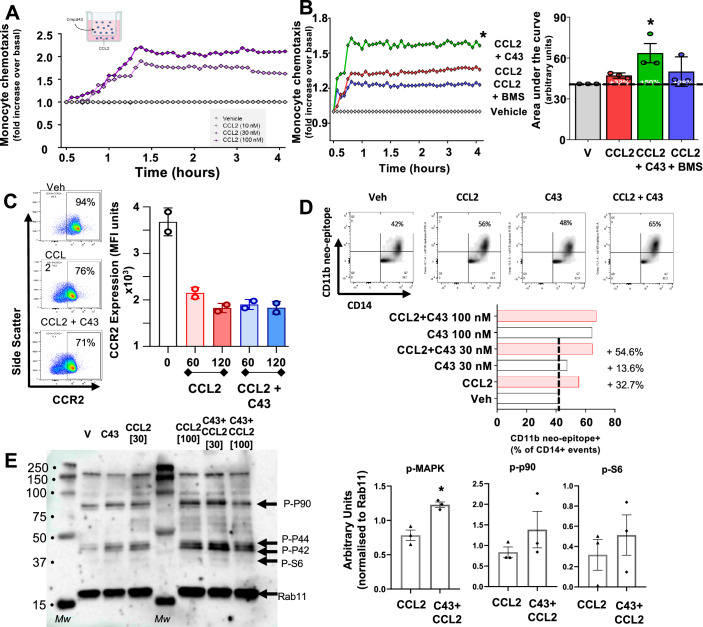
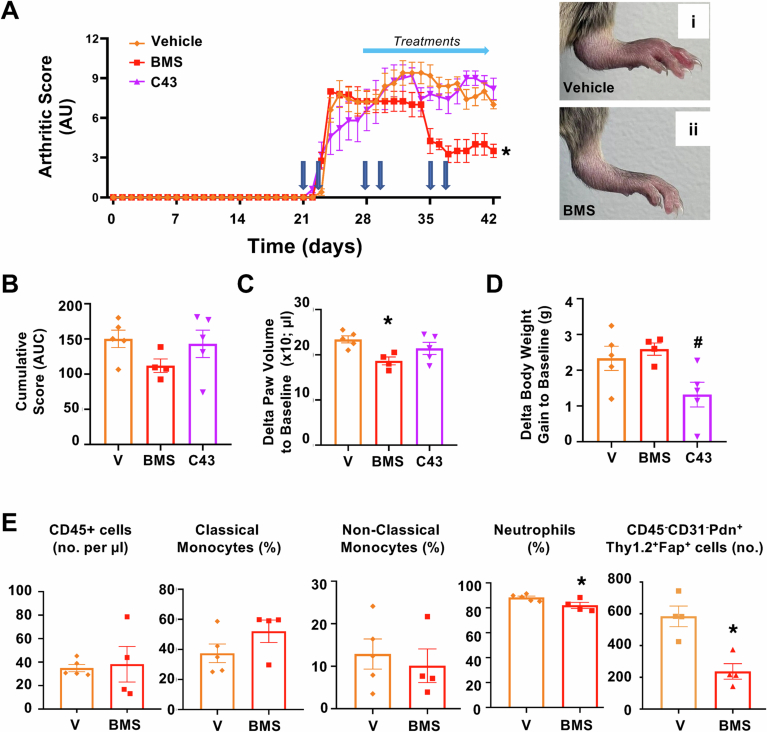
Rheumatoid arthritis (RA) is associated with heart and lung dysfunction. Current therapies fail to attenuate such complications. Here, we identify formyl-peptide receptor type 2 (FPR2) as a therapeutic target to treat heart and lung dysfunction associated with inflammatory arthritis. Arthritic mice on high levels of dietary homocysteine develop cardiac diastolic dysfunction and reduced lung compliance, mirroring two comorbidities in RA. Therapeutic administration of a small molecule FPR2 agonist (BMS986235) to hyper-homocysteine arthritic mice prevented diastolic dysfunction (monitored by echocardiography) and restored lung compliance. These tissue-specific effects were secondary to reduced neutrophil infiltration, modulation of fibroblast activation and phenotype (in the heart) and attenuation of monocyte and macrophage numbers (in the lung). A dual FPR1/2 agonist (compound 43) failed to prevent the reduction in lung compliance of arthritic mice and promoted the accumulation of inflammatory monocytes and pro-fibrotic macrophages in lung parenchyma. This cellular response lies downstream of FPR1-mediated potentiation of CCL2-dependent monocyte chemotaxis and activation. This finding supports the therapeutic development of selective FPR2 agonists to mitigate two impactful comorbidities associated with inflammatory arthritides.

Keywords: HFpEF; Lung Injury; Pro-resolving GPCR; Resolution Pharmacology; Rheumatoid Arthritis.


Conflict of interest statement

Disclosure and competing interests statement. MP declares to be a shareholder of ResoTher Pharma ApS and a director of William Harvey Research Limited; advisory board member for SynAct Pharma AB; and is involved in the following commercial projects: SynAct Pharma AB and TXP Pharma AG. MP and JD are inventors on a patent related to AnxA1 pro-resolving peptides (European Patent 3533457 B1). JAL, NRW and RAG are employees of Bristol Myers Squibb and hold shares in the company.

Figures

Figure 1
Figure 1. A model of hyper-homocysteinemia plus serum transfer induced arthritis (HH + STIA).
(A) Mice were treated with ad libitum access to homocysteine-supplemented drinking water for a total duration of 6 weeks. After the initial 3 weeks (hyper-homocysteine [HH] induction period), arthritogenic serum transfer-induced arthritis (STIA) was initiated with injections at day 0 and day 2 of each week for a total of 3 weeks. Mice were culled after a total time interval of 6 weeks. (B) STIA is associated with a steady increase in arthritic scoring, while treatment with HH itself does not evoke any symptoms. (C, D) HH + STIA is associated with paw oedema (C) and a reduction in body weight gain (D), with no difference from STIA-only animals. Data are mean ± SEM of n = 3 (naive), n = 4 (HH) and n = 5 (STIA and HH + STIA) mice. Multiple measurements: two-way ANOVA with Tukeys multiple comparisons test. Cumulative statistics: one-way ANOVA with Tukey’s multiple comparisons test, showing STIA vs. HH + STIA. Source data are available online for this figure.
Figure 2
Figure 2. Hyper-homocysteinemia plus serum transfer-induced arthritis (HH + STIA) is associated with cardiac dysfunction.
Application of HH + STIA treatment (see Fig. 1) leads to a progressive impairment in cardiac diastolic functionality. (A) Left-hand images: representative B-mode four-chamber echocardiograms and increased left atrial (LA) area in arthritic mice. Right-hand images: representative mitral flow patterns from pulsed-wave colour Doppler echocardiography. (B) Quantification of six cardiac parameters across the four experimental groups; HH + STIA display increased left atrial (light blue circle in (A)) area (*P = 0.0060); reduced E/A ratio (*P = 0.00000025); interventricular septum thickness shows significant interaction between time and treatment (*P = 0.0325); no change in ejection fraction and left ventricle internal diameter, with a trend for increased deceleration time. (C) neutrophils: CD45+7/4+Ly6G +; adjusted P value = 0.0380. (D) T effector memory cells: CD4+CD62L-CD44+. (E) monocytic fibroblasts: cTnT-CD31-Lin-CD45+CD34+Thy1.2+ cells; adjusted P value = 0.0395. (F) structural fibroblasts: cTnT-CD31-Lin-CD45-CD34-Thy1.2 +; adjusted P value = 0.0066. (G) inflammatory fibroblasts: cTnT-CD31-Lin-Pdpn+Thy1.2 +; adjusted P value = 0.0005. (H) activated profibrotic myofibroblasts: cTnT-CD31-Lin-CD45-CD34-MEFSK4+Thy1.2-. Data are mean ± SEM of n = 3 (naive), n = 4 (HH) and n = 5 (STIA and HH + STIA) mice. (B) * Denotes significant interaction between treatment and time (P ≤ 0.05). (CH) #P < 0.05 vs. STIA group. *P < 0.05 vs. HH group. (B) Two-way ANOVA with Bonferroni’s multiple comparisons test. (CH) One-way ANOVA with Tukey’s multiple comparisons test. Source data are available online for this figure.
Figure 3
Figure 3. Hyper-homocysteinemia plus serum transfer-induced arthritis (HH + STIA) is associated with pulmonary dysfunction.
Application of HH + STIA treatment (see Fig. 1) leads to a progressive decline in pulmonary function and immune cell numbers. (A) Lung compliance as measured at day 42; adjusted P value = 0.0198. (BE) Interstitial immune cell profiling of the lungs collected on day 42. Macrophage subtypes were identified as follows. M1-like macrophages: CD45+CX3CR1+F4/80+CD80+CD206low; M2-like macrophages, CD45+CX3CR1+F4/80+CD80-CD206high; profibrotic macrophages, CX3CR1+CD11c+SiglecF+MHCIIhigh. Analyses revealed a slightly elevated M1/M2 ratio (B) with a significant increase in M1 macrophages (C) and differentially modulated M2 profiles (§, adjusted P value = 0.0010; *, adjusted P value = 0.0006) as well as profibrotic macrophages in the HH group (*, adjusted P value = 0.0207) (D, E). Data are mean ± SEM of n = 3 (naive), n = 4 (HH) and n = 5 (STIA and HH + STIA) mice. §P < 0.05 vs. naive mice; *P < 0.05 vs. HH group. One-way ANOVA with Tukey’s multiple comparisons test. Source data are available online for this figure.
Figure 4
Figure 4. Target screening and functional impact of agonists at formyl-peptide receptors on cardiac dysfunction in HH + STIA.
(A) A publicly available database for RNAseq datasets of autoimmune maladies was interrogated for bulk RNAseq data on PBMCs isolated from healthy vs. rheumatoid arthritis (RA) patients. Volcano plot (left panel) shows significant changes in gene expression patterns. Selected disease-relevant genes are presented in the table, and display increased expression levels of FPR2, TNFAIP6, S100A9 and a reduction in IL23R. (DEG method: Wilcoxon; P value cutoff: 0.01; RA vs. Healthy; Sample count: n = 12 RA and n = 64 healthy datasets; see: (Shen et al, 2022)). (B) Fpr2 expression in CD45+ blood cells of HH + STIA mice (see Fig. 1), treated daily for the last two weeks with vehicle, BMS235 (3 mg/kg p.o.) or C43 (10 mg/kg p.o.). Left: quantitative data presented as median fluorescence intensity (MFI) units; right: representative histograms for Fpr2 distribution in CD45+ cells (*, adjusted P value = 0.0085). (C) Left-hand images: representative B-mode four-chamber echocardiograms and left atrial (light blue circles) area in HH + STIA mice. Right-hand images: representative mitral flow patterns from pulsed-wave colour Doppler echocardiography. (DG) Quantification of four cardiac parameters across the experimental groups; (D) left atrial (LA) area (*, adjusted p-value for BMS vs. V = 0.0099; *, adjusted P value for C43 vs. V = 0.0069); (E) E/A ratio (*, adjusted P value for BMS vs. V = 0.0011; *, adjusted P value for C43 vs. V = 0.0001); (F) deceleration time; (G) ejection fraction. Data are mean ± SEM of n = 5 mice per group. *P < 0.05 vs. vehicle group. One-way ANOVA with Tukey’s multiple comparisons test. Source data are available online for this figure.
Figure 5
Figure 5. Modulation of cellular profiles by FPR-agonism in HH + STIA-mediated cardiac dysfunction.
HH + STIA was induced as in Fig. 1. From week 4, mice were treated with either vehicle or BMS235 (3 mg/kg per os) or C43 (10 mg/kg per os) daily. (A) neutrophils: CD45+7/4+Ly6G+ (*, adjusted P value for BMS vs. V = 0.0381; adjusted p-value for C43 vs. V = 0.0036). (B) Monocytic fibroblasts; Thy1.2+cTnT-CD31-Lin-CD45 + CD34+ cells (*, adjusted P value = 0.0027). (C) Structural fibroblasts: Thy1.2+cTnT-CD31-Lin-CD45-CD34- (*, adjusted P value = 0.0140). (D) Activated profibrotic myofibroblasts: MEFSK4+Thy1.2-cTnT-CD31-Lin-CD45-CD34- (*, adjusted P value = 0.0070). (E) Inflammatory fibroblasts: Thy1.2+cTnT-CD31-Lin-Pdpn+ (*, adjusted P value for BMS vs. V = 0.0008; adjusted P value for C43 vs. V < 0.0001). Right hand side: representative flow cytometry plots for each experimental group. Data are mean ± SEM of n = 5 mice per group. *P < 0.05 vs. vehicle group. One-way ANOVA with Tukey’s multiple comparisons test. For (C): Kruskal–Wallis ANOVA followed by Dunn’s multiple comparisons test since prior testing with Bartlett’s test (as performed for all analyses) showed a P value of 0.0325. Source data are available online for this figure.
Figure 6
Figure 6. Functional impact of agonists at formyl-peptide receptors on pulmonary dysfunction in HH + STIA.
HH + STIA was induced as in Fig. 1. From week 4, mice were treated with either vehicle or BMS235 (3 mg/kg per os) or C43 (10 mg/kg per os) daily and analyses were conducted at week 6 (day 42). (A) Lung compliance (*, adjusted P value = 0.0035; #, adjusted P value = 0.0103). (B-I) Cellular characterisation from lungs; (BD) M1 macrophages: CD45+CX3CR1+F4/80+CD80+CD206low (*, adjusted P value for BMS vs. V = 0.0396; adjusted P value for C43 vs. V = 0.0112); M2 macrophages: CD45+CX3CR1+F4/80+CD80-CD206high. (E) Classical monocytes: CX3CR1+Ly6Chigh. (F) Non-classical monocytes: CX3CR1+Ly6Clow (*, adjusted P value = 0.0296). (G) CCR2 expression on F4/80+ cells (*, adjusted P value = 0.0249; #, adjusted P value = 0.0165); lower part: representative histogram with overlapping profiles for one sample from each group. (H) Profibrotic macrophage population: CX3CR1+CD11c+SiglecF+MHCIIhigh (*, adjusted P value = 0.00000006; #, adjusted P value = 0.00000015). (I) Platelet-leukocyte aggregates as proportion of the CD45+ population (#, adjusted P value = 0.0188). (J) Nestin mRNA as quantified by qPCR (*, adjusted P value = 0.0382). (K) Heatmap of selected gene expression values quantified by qPCR and normalised to naive (left panel) or vehicle (right panel), respectively. Data are mean ± SEM of n = 3–5 mice per group. *P < 0.05 vs. vehicle group; #P < 0.05 vs. BMS group; §P < 0.05 vs. STIA; P < 0.05 vs. HH. One-way ANOVA with Tukey’s multiple comparisons test. For (B, J): Kruskal–Wallis ANOVA followed by Dunn’s multiple comparisons test. Source data are available online for this figure.
Figure 7
Figure 7. Selective FPR2 agonism by BMS235 regulates collagen deposition in both heart and lung tissue of HH + STIA mice.
HH + STIA was induced as in Fig. 1. From week 4, HH + STIA mice were treated with either vehicle or BMS235 (3 mg/kg per os) daily and analyses were conducted at week 6 (day 42). (AF) Visualisation and analysis of collagen deposition in both hearts and lungs using second harmonic generation (SHG) by multiphoton microscopy. Data are mean ± SEM of n = 4 mice per group. *P < 0.05 vs. vehicle group. One-way ANOVA with Dunnett’s multiple comparisons test (A) Percentage (%) of collagen area and (*, adjusted P value = 0.0007 vs. naive; *, adjusted P value = 0.0002 vs. BMS) (B) collagen average size (calculated by total collagen area divided by the number of collagen fibres) in the heart (*, adjusted P value = 0.0012 vs. naive, *, adjusted P value = 0.0009 vs. BMS). (C) Representative SHG images of the heart after conversion to maximum intensity projection (scale bars, 100 μm). (D) Percentage (%) of collagen area and (E) collagen average size in the lung (*, adjusted P value = 0.0081 vs. naive). (F) Representative SHG images of the lung after conversion to maximum intensity projection (scale bars, 100 μm). Arrows highlight streaks or clusters of collagen fibres. (GL) Visualisation and quantification of fibroblasts, macrophages and neutrophils in hearts and lungs using spinning disk confocal microscopy, after conversion to maximum intensity projection. Green: Vimentin, red: Galectin-3, purple: MRP14 (scale bars, 50 μm). Data are mean±SEM of n = 4 mice per group. (G) Percentage (%) of vimentin-positive fibroblast area and (H) galectin-3-positive macrophages per field of view in the heart. (I) Representative immunofluorescence spinning disc images of the heart. (J) Neutrophils and (K) macrophages per field of view in the lung. (L) Representative immunofluorescence spinning disc images of the lung. Source data are available online for this figure.
Figure 8
Figure 8. C43 modulates human monocyte reactivity.
(A) Chemotaxis of purified human peripheral blood monocytes was assessed using a xCELLigence™ DP system (see Appendix Methods). Representative concentration-response curves to CCL2. (B) CD14+ monocytes were incubated for 30 min with either vehicle, 100 nM C43 or 100 nM BMS235, prior to addition to the chemotactic chambers, with 30 nM CCL2 added to the lower chamber. Changes in impedance were recorded up to 4 h (*P value = 0.0402). (C) CD14+ monocytes were incubated with vehicle or 100 nM C43 for 30 min, prior to the addition of 30 nM CCL2 and CCR2 expression quantified by flow cytometry at 60 or 120 min, as indicated. Left: representative dot plots. Right: summary from experiments with two distinct cell donors. (D) CD14+ monocytes treated as in (C)), though this time 10 nM CCL2 was used, while C43 was tested at two different concentrations. Expression levels of CD11b neo-epitope were quantified by flow cytometry. Top: representative density plots. Bottom: example of one experiment, indicating the additive effect of the lower C43 concentration (see Appendix Fig. S7B for experiments with three different cell donors). (E) PathScan™ Western blot phosphorylation screening on PBMCs treated with 30 nM C43 and two concentrations of CCL2. Left: representative blot. Right: cumulative data p44/42, p90 and S6 phosphorylation from experiments with three different cell preparations. See Appendix Fig. S8 for all three distinct blots. Data are mean ± SEM. *P < 0.05 vs. respective CCL2 value. One-way ANOVA with Tukey’s multiple comparisons test. For (A, B): two-way ANOVA with Tukey’s multiple comparisons test. For (E): unpaired two-tailed t test. Source data are available online for this figure.
Figure EV1
Figure EV1. Formyl peptide receptor 2 (FPR2) expression in cardiac and lung cells.
HH + STIA was induced as in Fig. 1. From week 4, mice were treated with either vehicle (100 µl per os daily) or BMS235 (3 mg/kg per os daily). At the end of week 6, hearts and lungs were harvested, digested and processed for flow cytometry analysis. (A) Top panels, representative histograms for FPR2 expression on cardiac macrophages and fibroblasts. Table, summary data for the reported cardiac cell types. (B) Top panels, representative histograms for FPR2 expression on lung macrophages and fibroblasts. Table, summary data for the reported lung parenchyma cell types. Cardiac cell populations were defined by the following markers: myeloid cells, CD45+CD11b+; macrophages, CD45+CD11b+CD64+; neutrophils, CD45+CD11b+Ly6G+; endothelial cells, CD45-CD11b-CD31+; fibroblasts, CD45-CD11b-CD31-MEFSK4+. Lung cell populations were defined by the following markers: myeloid cells, CD45+CD11b+; macrophages, CD45+CD11b+CD64+; neutrophils, CD45+CD11b+Ly6G+; lung endothelial cells, Lineage-CD31+; fibroblasts, Lineage-CD31-CD140a+. Data are mean ± SEM of n = 4 (naive), n = 4 (HH + STIA+Vehicle) and n = 4 (HH + STIA + BMS) mice.
Figure EV2
Figure EV2. Selective FPR2 agonism by BMS235 significantly attenuates cardiac diastolic dysfunction in K/BxN F1 mice.
K/BxN F1 mice were treated daily from week 4 to week 8 with vehicle or BMS235 (3 mg/kg p.o.). Echocardiography was performed at week 8 after 4 weeks of treatment. (A) Quantification of left atrial (LA) area (*, P value = 0.0029); Right-hand images: representative B-mode four-chamber echocardiograms and left atrial (light blue circles) area in K/BxN F1 mice. (B) Quantification of deceleration time (*, P value = 0.003). (C) Quantification of E/A ratio; Right-hand images: representative mitral flow patterns from pulsed-wave colour Doppler echocardiography (*, P value = 0.0003). (DG) Quantification of four other cardiac parameters in the two experimental groups; (D) ejection fraction; (E) left ventricular dimension in diastolic (d) phase; (F) interventricular septum in diastolic (d) phase; (G) arthritic score, area under curve (AUC). Data are mean ± SEM of n = 5 mice per group. *P < 0.05 vs. vehicle group. One-way ANOVA with Tukey’s multiple comparisons test. For (B, J): Kruskal–Wallis ANOVA followed by Dunn’s multiple comparisons test.
Figure EV3
Figure EV3. Human monocyte reactivity experiments.
Chemotaxis of purified human peripheral blood monocytes was assessed using a xCELLigence™ DP system as in Fig. 8. (A) Inhibition of C5a (10 nM) induced monocyte chemotaxis by C43 (100 nM; 30 min pre-incubation); *P value = 0.0051 vs. C5a data. (B) Additive effect of C43 to CCL2 (10 nM)-mediated neo-epitope expression. Data for each single donor (n = 3 in total) are presented. (C) C43 (100 nM)-mediated human monocyte chemotaxis; regulation by cyclosporin H (CyH, 1 µM) and WRW4 (1 µM) added to cells 30 min prior to beginning of the chemotaxis assay using the xCELLigence™ DP system. Quantitative data from multiple donor cells are given in the main text. For AUC-values: One-way ANOVA with Tukey’s multiple comparisons test.
Figure EV4
Figure EV4. Modulation of human macrophage/fibroblast crosstalk by BMS235.
(A) Schematic of the co-culture experiments with human monocyte-derived macrophages treated with vehicle or BMS235 (BMS, 100 nM) or vehicle control (0.1% DMSO) for 24 h prior to addition to either human RA synovial fibroblasts (FLS) or human cardiac fibroblasts (HCF). Fibroblast markers were quantified 24 h later. (B) VCAM-1 and α-SMA expression in human RA fibroblast-like synoviocytes (FLS). Data are mean ± SEM of 3–4 distinct cone preparations. (**, adjusted P value = 0.0025), one-way nonparametric Kruskal–Wallis, Dunn’s multiple comparisons test. (C) Chemokine gene expression in human cardiac fibroblasts (HCF), where Ct values were normalised using 18S as a housekeeping gene and fold change was calculated relative to the geometric mean of the HCF co-cultured with vehicle control M1-like macrophages. Data are mean ± SEM of 4 distinct macrophage preparations. Statistical analysis is nonparametric t-test Mann-Whitney test.
Figure EV5
Figure EV5. Impact of FPR2 agonism on joint disease.
Figure EV5. Impact of FPR2 agonism on joint disease. HH + STIA was obtained as in Fig. 1. From week 4, mice were treated with either vehicle or BMS235 (3 mg/kg per os) or C43 (10 mg/kg per os) daily. (A) Time course of the arthritic score (arrows indicate serum injections; bar, treatment time). Representative images of arthritic score: i) score ≥9, ii) score ~6. (B) Cumulative value for the arthritic score. Area under the curve (AUC). (C) Oedema shown as delta paw volume between day 0 and day 42 (*, adjusted P value = 0.0085). (D) Change in body weight between day 0 and day 42 (#, adjusted P value = 0.0155). (E) Cellular characterisation from paws collected at day 42. Classical monocytes: CD45+CD11b+CD115+CD43-Ly6Chigh; non-classical monocytes: CD45+CD11b+CD115+CD43+Ly6Clow. Neutrophils: CD45+CD11b+CD115-Ly6G+ (P value = 0.0398). Proinflammatory fibroblasts: Thy1.2+CD45-CD31-Pdpn+Fap+ (P value = 0.0053). Data are mean ± SEM of n = 4–5 mice per group. *P < 0.05 vs. vehicle; #P < 0.05 vs. BMS group. For (A): Two-way ANOVA with Tukey’s multiple comparisons test. For (BD): one-way ANOVA with Tukey’s multiple comparisons test. For (E): unpaired two-tailed t-test.

Similar articles

Cited by

References

    1. Abdulrahman N, Jaballah M, Poomakkoth N, Riaz S, Abdelaziz S, Issa A, Mraiche F (2016) Inhibition of p90 ribosomal S6 kinase attenuates cell migration and proliferation of the human lung adenocarcinoma through phospho-GSK-3beta and osteopontin. Mol Cell Biochem 418:21–29 - PubMed
    1. Aran D, Looney AP, Liu L, Wu E, Fong V, Hsu A, Chak S, Naikawadi RP, Wolters PJ, Abate AR et al (2019) Reference-based analysis of lung single-cell sequencing reveals a transitional profibrotic macrophage. Nat Immunol 20:163–172 - PMC - PubMed
    1. Asahina Y, Wurtz NR, Arakawa K, Carson N, Fujii K, Fukuchi K, Garcia R, Hsu MY, Ishiyama J, Ito B et al (2020) Discovery of BMS-986235/LAR-1219: a potent formyl peptide receptor 2 (FPR2) selective agonist for the prevention of heart failure. J Med Chem 63:9003–9019 - PubMed
    1. Bednar F, Song C, Bardi G, Cornwell W, Rogers TJ (2014) Cross-desensitization of CCR1, but not CCR2, following activation of the formyl peptide receptor FPR1. J Immunol 192:5305–5313 - PMC - PubMed
    1. Binder MD, Fox AD, Merlo D, Johnson LJ, Giuffrida L, Calvert SE, Akkermann R, Ma GZM, ANZgene, Perera AA, Gresle MM, Laverick L, Foo G, Fabis-Pedrini MJ, Spelman T, Jordan MA, Baxter AG, Foote S, Butzkueven H, Kilpatrick TJ, Field J (2016) Common and Low Frequency Variants in MERTK Are Independently Associated with Multiple Sclerosis Susceptibility with Discordant Association Dependent upon HLA-DRB1*15:01 Status. PLoS Genet. 12:e1005853 - PMC - PubMed

Substances