. 2025 May;5(5):780-798.
doi: 10.1038/s43587-025-00847-9. Epub 2025 Apr 3.

Regeneration leads to global tissue rejuvenation in aging sexual planarians

Affiliations

Regeneration leads to global tissue rejuvenation in aging sexual planarians

Xiaoting Dai et al. Nat Aging. 2025 May.

Abstract

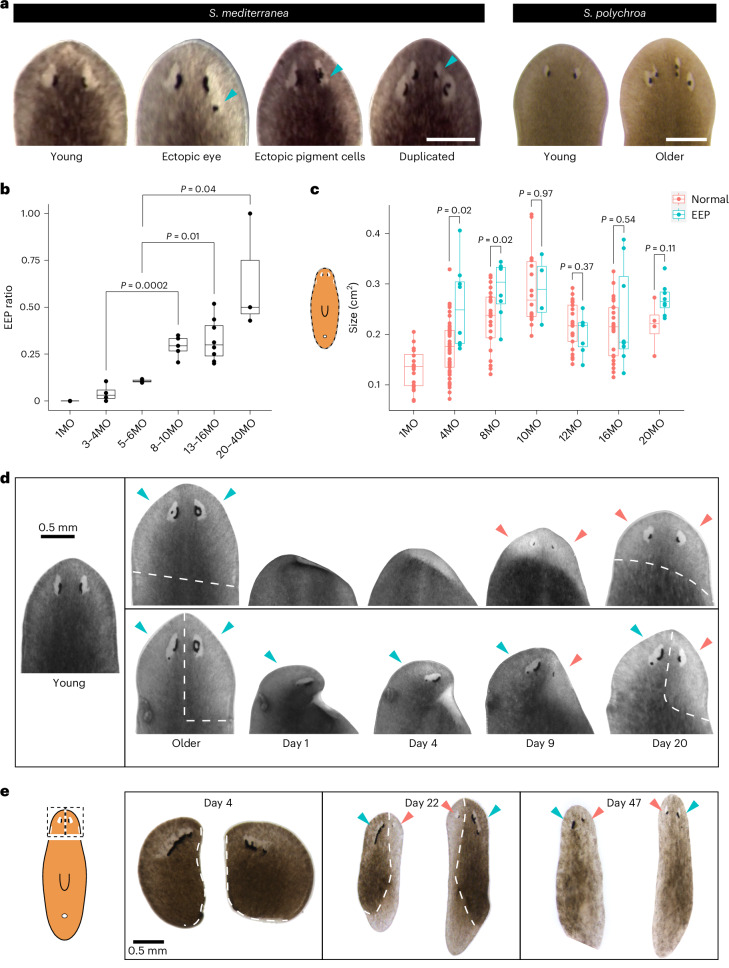
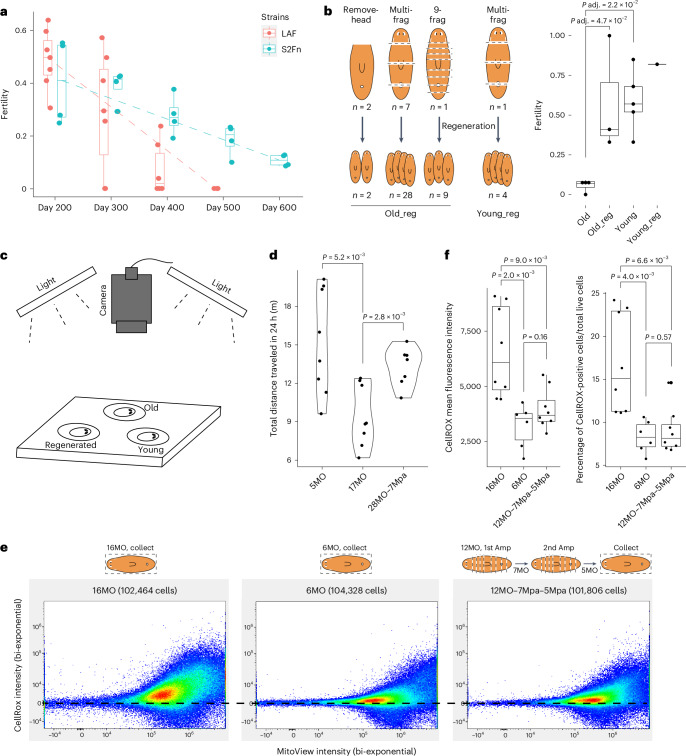
The possibility of reversing the adverse impacts of aging could significantly reduce age-related diseases and improve quality of life in older populations. Here we report that the sexual lineage of the planarian Schmidtea mediterranea exhibits physiological decline within 18 months of birth, including altered tissue architecture, impaired fertility and motility, and increased oxidative stress. Single-cell profiling of young and older planarian heads uncovered loss of neurons and muscle, increase of glia, and revealed minimal changes in somatic pluripotent stem cells, along with molecular signatures of aging across tissues. Remarkably, amputation followed by regeneration of lost tissues in older planarians led to reversal of these age-associated changes in tissues both proximal and distal to the injury at physiological, cellular and molecular levels. Our work suggests mechanisms of rejuvenation in both new and old tissues concurring with planarian regeneration, which may provide valuable insights for antiaging interventions.


Conflict of interest statement

Competing interests: The authors declare no competing interests.

Figures

Fig. 1
Fig. 1. Aging and rejuvenation of planarian eyes.
a, Morphological changes in the eyes of S. mediterranea and S. polychroa, from left to right. Cyan arrowheads indicate ectopic eyes, ectopic eye pigment cells and duplicated eyes (EEP). Scale bars, 0.5 mm. b, The ratio of worms with EEP phenotypes as a function of age. Each data point represents an independent container of worms with n ≥ 4 individuals and 744 individuals were sampled. Two-sided standard two-sample t-test. MO, months. c, Whole-body size changes with age in worms with and without EEP. Each data point represents an individual animal. n ≥ 12 for each age condition and a total of 200 individuals were included. Two-sided Welch’s t-test. In the box plots (b and c), the center is the median, the height of the box is given by the interquartile range (IQR), the whiskers extend up to 1.5 times the IQR, and the minima and maxima are the observed minima and maxima. d, Whole-head regeneration (top, n = 15) and half-head regeneration (bottom, n = 10) of worms with EEP. e, Regeneration of a half head with EEP into a new worm (n = 5). Dashed line indicates the amputation plane. Cyan arrowheads indicate old eyes; red arrowheads indicate new eyes. Scale bar, 0.5 mm. Source data
Fig. 2
Fig. 2. Repeated amputation and regeneration maintain youthful heads.
a, Strategy to create the aging cohort (group A) and regenerated cohort (group B) with the same genetic background and chronological age. amp, amputation; reg, regeneration; feed, feeding. b, Representative images of six clones with heterogeneous EEP phenotypes from group A. c, Representative images of six clones with homogeneous young eyes from group B. d, Whole-body size comparison between EEP worms in group A and randomly sampled 45 worms in group B. Each data point represents an individual animal (n = 14 and 45 in group A and B, respectively). Two-sided Welch’s t-test. The box plot shows the median (center), IQR (box), whiskers extending to 1.5 times the IQR and the observed minima and maxima (minima and maxima). Scale bars, 0.5 mm. Source data
Fig. 3
Fig. 3. Aging and rejuvenation of fertility, motility and oxidative stress state.
a, Tracking of fertility over time in two different inbred lines, LAF and S2Fn. Fertility was quantified as the percentage of hatched egg capsules to the total eggs produced every 100 days. Each data point represents a box of animals (n = 7 and 4 for LAF and S2Fn, respectively). The box plot shows the median (center), IQR (box), whiskers extending to 1.5 times the IQR and the observed minima and maxima (minima and maxima). b, Left: three strategies of amputation to produce regenerated worms, including removing the heads, cutting animals into random 3–4 fragments and cutting animals into 9 fragments. Right: fertility of the first month of reproduction, from young, young-regenerated, old and old-regenerated cohorts. Young: 4MO, 6MO, 7MO. Old: 12MO, 13MO, 14MO, 24MO. Old_reg: 18MO–3Mpa (9-frg), 21MO–3Mpa (remove-head), 24MO–5Mpa (multi-frg), representative data for each method. Each method was repeated at least three times. Young_reg: 4.5MO–4Mpa. One-way analysis of variance (ANOVA) with Tukey’s honestly significant difference (HSD) test. The box plot shows the median (center), IQR (box), whiskers extending to 1.5 times the IQR and the observed minima and maxima (minima and maxima). c, Camera, light and chamber setup for video recording in the stress–motility assay. d, Total movements measured as distance traveled in 24 h for 5MO, 17MO and 28MO–7Mpa animals. Each data point represents an individual worm. n ≥ 6 individuals for different experimental groups. Two-sided Welch’s t-test. e, Flow cytometry analysis of oxidative stress states determined by CellROX Green staining in 6MO (n = 6), 16MO (n = 8) and 12MO–7Mpa–5Mpa (n = 8) animals. Amp, amputation. Horizontal dashed lines are added to help compare the density and intensity of CellRoxhigh cell populations. f, Quantification of CellROX mean fluorescence intensity and percentage of CellROX-positive cells in each age group from e. Each data point represents an individual worm. Two-sided Welch’s t-test. The box plots show the median (center), IQR (box), whiskers extending to 1.5 times the IQR and the observed minima and maxima (minima and maxima). Source data
Fig. 4
Fig. 4. Single-cell profiling of the ASCs.
a, Experimental outline for scRNA-seq on heads of young (5MO, n = 4; 7MO, n = 2), older (12MO, n = 1; 18MO, n = 5; 32MO, n = 1) and regenerated (21MO–3Mpa–5Mpa–3Mpa, n = 3) worms. Reg, regenerated. b, Uniform manifold approximation and projection (UMAP) visualization of eight major tissue types identified (n = 104,617 cells). c, Subclusters of sexual ASCs (neoblasts). d, Proportion of stem cells in different age groups in scRNA-seq data. The sample size for each experimental group is as indicated in a. The stem cells were quantified as the whole neoblast cluster or all smedwi-1+ cells. Two-sided Welch’s t-test. Error bars represent the mean ± s.d. e, HCR-FISH images of neoblast marker smedwi-1 (magenta) in young and old planarian heads. n = 4 in each group. Scale bars, 500 µm. f, Quantification of smedwi-1+ cells in young and old planarian heads. Each data point represents an individual animal. Two-sided Welch’s t-test. Error bars represent the mean ± s.d. g, Telomere length of young (1MO, 5MO), old (36MO), and regenerated (5MO-3xAmp) planarians. One lane corresponds to one worm. h, Cell ratio of neoblast subtypes in three age groups from a. No significant differences between any two of these groups. The sample size for each group is indicated in a. Two-sided Welch’s t-test. Error bars represent the mean ± s.d. i, Fraction of stem cells at the G1 stage according to the predicted cell cycle state, derived from scRNA-seq data in a. The sample size for each experimental group is as indicated in a. Two-sided Welch’s t-test. j, Entropy (mutual distance) of neoblast subtypes. Each data point represents the mean entropy of a biological replicate derived from scRNA-seq data from a. The sample size for each experimental group is as indicated in a. Two-sided Welch’s t-test. The box plots in i and j show the median (center), the IQR (box) and whiskers extending to 1.5 times the IQR. Source data
Fig. 5
Fig. 5. Tissue-specific aging and rejuvenation at the cellular level.
a, PCA showing different degrees of dispersal by age and regeneration in stem cells and differentiated tissues. The union (4,321 genes) of the top 2,000 HVGs of each tissue was used for analysis. b, Cell-to-cell variability in various tissue types at different ages. Each data point represents the mean variability across all genes of a biological replicate derived from scRNA-seq data. The sample size for each experimental group is as indicated in Fig. 4a. Two-sided Welch’s t-test. The box plots show the median (center), IQR (box) and whiskers extending to 1.5 times the IQR. c, S. mediterranea exhibits progressive head atrophy with age (left). The blue bracket indicates the head region. Scale bars, 5 mm. The relative head size was defined as the fraction of the area of the head region to the whole worm area (right). Young group, <5MO (n = 63); older group, >12MO (n = 45). Two-sided Welch’s t-test. Error bar denotes the IQR; center line indicates the mean. d, Cell proportion analysis based on scRNA-seq data for neurons (GABAergic, dopaminergic, TMPRSS9+) and glia. The sample size for each experimental group is as indicated in Fig. 4a. One-way ANOVA with Tukey’s HSD test. Error bar denotes the mean ± s.d. e, HCR-FISH of dopaminergic neuron marker th (blue) and glia marker cali (red) in young (4–5MO), older (14–16MO) and old-regenerated (15MO–2Mpa) heads. Scale bars, 200 µm in head images and 20 µm in zoomed-in images. f, The number of th+ cells counted in the dorsal side of young, older and old-regenerated heads with HCR-FISH. Each data point represents an individual worm. n = 10 individuals for each experimental group. Two-sided Welch’s t-test. Error bar indicates the IQR; center line denotes the mean. g, Glia cell density in young, older and old-regenerated heads quantified from HCR-FISH images. Each data point represents an individual animal. n = 5, 10 and 10 individuals for young, older and regenerated groups, respectively. Two-sided Welch’s t-test. Error bar indicates the IQR; center line denotes the mean. h, Cell proportion changes of various muscle cell types in three age groups from scRNA-seq data. The sample size for each experimental group is indicated in Fig. 4a. One-way ANOVA with Tukey’s HSD test. Error bar indicates the mean ± s.d. P values or adjusted P values are indicated in the figures. DVM, dorsal ventral muscle. Source data
Fig. 6
Fig. 6. Reversal of aged-dependent molecular changes.
a, log2-transformed fold changes of PAGs during aging (y axis, older versus young) and after regeneration (x axis, older versus regenerated) in different tissues based on scRNA-seq data. Top-right quadrant represents genes upregulated in older conditions, compared to either young or regenerated conditions. b, Percentage of rejuvenated genes in each tissue. Dark-gray bars represent reversed PAGs that were upregulated in older age; light-gray bars represent PAGs that were downregulated in older age. c, Expression level changes of COX1/COX2 in neural and muscle tissues based on scRNA-seq data. The sample size for each experimental group is indicated in Fig. 4a. Two-sided Wilcoxon rank-sum test P value adjusted using Bonferroni correction. d, Enriched Gene Ontology (GO) terms among rejuvenated genes in various tissues. Two-sided chi-squared test (when all expected frequencies are greater than 5) or Fisher’s exact test P value adjusted with Benjamini–Hochberg correction. e, PCA of gene expression signatures of planarian aging (blue), mammalian aging (red) and lifespan-extending interventions in mice (green). Variance explained by first two principal components (PC1 and PC2) is indicated in parentheses. CR, caloric restriction; GH, growth hormone. f, Statistically significant pathways associated with planarian aging (blue), mammalian aging (red) and lifespan-extending interventions in mice (green). GSEA permutation test P value adjusted for multiple comparisons with Benjamini–Hochberg correction. Only functions significantly enriched by at least two signatures are visualized (adjusted P value < 0.1). Cells are colored based on normalized enrichment scores (NES). ^P adjusted < 0.1; *P adjusted < 0.05; **P adjusted < 0.01; ***P adjusted < 0.001. BP, biological process. Source data
Fig. 7
Fig. 7. Potential rejuvenation mechanisms.
a, Heat map of Pearson correlation coefficients of tail transcriptomes between young (4MO), old (15MO) and head-regenerated (15MO–20Dpa) conditions showing rejuvenation in distal uninjured tissues. Three biological replicates were used for each condition. b, log2-fold change of upPAGs (red) and downPAGs (blue) during the early stage of regeneration (6Hpa versus 0Hpa) in different tissues. Percentage of reversed PAGs at 6Hpa. Hpa, hours post amputation; itst, intestine; epi, epidermal; cat, cathepsin+; neu, neural; mus, muscle; sec, secretory; pro, protonephridia; neo, neoblast. c, Confocal images showing SOSd+ cell density at different ages. Representative images of n = 3 animals for each age. Yellow arrows point to the SOSdhigh cells. Scale bars, 1 mm. d, Distribution of SOSd+ cells in young (4MO), old (14MO) and regenerated (18MO–10Dpa) heads. Representative images of n = 5 (4MO), n = 5 (14MO) and n = 4 (18MO–10Dpa) animals. Yellow rectangles indicate selected regions for cell density quantification. Vertical yellow line indicates the midline of the animal; horizontal yellow line indicates the widest points from the left to right sides of the head; white dashed line indicates the boundary between blastema and old trunk tissues, marked by two notches introduced after animal fixation. Scale bars, 500 µm. e, Representative images of regions 1 and 2 from 4MO, 14MO and 18MO–10Dpa heads. Region size, 273.45 μm × 79.55 μm. Scale bars, 20 μm. f, Quantification of cell density ratio between region 1 and region 2. Each data point represents an individual worm. n = 5, 5 and 4 animals for 4MO, 14MO and 18MO–10Dpa, respectively. Two-sided Welch’s t-test. Error bar indicates the IQR; center line denotes the mean. g, Confocal images showing expression of UBAC1 and smedwi-1 in a pair of dividing stem cells. Representative images of n = 3 animals. Dividing stem cells are marked by two blobs of condensed chromosomes (gray color). Scale bar, 10 μm. Source data
Extended Data Fig. 1
Extended Data Fig. 1. Age associated changes in feeding behavior and eye morphology.
(a) Average time spent on food in four independent feeding sessions for young (8MO) and old (18MO) planarians. Each dot represents the average time from 8 animals that were examined independently in one feeding session. Two-sided Welch Two Sample t-test. (b) The amount of liver ingested per feeding session, normalized by the weight of the animal (mg/mg). Each dot represents one animal. Young, 7MO: 7 animals. Old, 12MO: 6 animals. Red and cyan represent two feeding sessions of the same animals. (c) Development of EEP phenotypes over time in three animals from 4MO to 8MO. From top to bottom: ectopic eye, ectopic eye pigment, duplicated eyes. wks = weeks-old (d) Body size changes over time in 44 individually housed animals, from 4MO to 8MO. Red lines: animals developed early signs of EEP. Grey lines: animals with normal eyes. *: the first time point when EEP was visible. #: the first time point when EEP was visible, and the animal was at its largest size. w4, w5, w6…w42: worm IDs, corresponding to eye phenotypes in source data. (e-f) No significant differences in the timing of EEP appearance (e) or body sizes of EEP appearance (f) between ectopic eyes and ectopic pigment cells. Each data point represents an individual with EEP, n = 10 individuals were examined. Welch two sample t-test. (a-b, e-f) The boxplots show the median (center), IQR (box) and whiskers extending to 1.5 × IQR. Source data
Extended Data Fig. 2
Extended Data Fig. 2. Head amputation and body size changes.
(a) Representative images of intact (week0), 2-week post head removal (week2) and 3-week post head removal (week3) adult sexual planarians. (b) Body size changes after head removal. The data point represents individual worm. n = 31 individuals were sampled. One-Way ANOVA with Tukey’s HSD test. The boxplot shows the median (center), IQR (box) and whiskers extending to 1.5 × IQR. Source data
Extended Data Fig. 3
Extended Data Fig. 3. sc-RNA sequencing data quality control and cluster annotation.
(a) UMAP plot depicting the distribution of cells from different replicates. Cells were colored by age. (b) Violin plots of the number of UMIs (top) and genes (bottom) of each sample. The captured cell number in each sample were indicated in Supplementary Table 1. The boxplots show the median (center), IQR (box) and whiskers extending to 1.5 × IQR. (c) Publicly reported tissue specific genes and their expression on the UMAP projection.
Extended Data Fig. 4
Extended Data Fig. 4. Subclustering of eight planarian tissues.
UMAP plots of different tissues colored by sub-clusters. neoblast (12 clusters, 8,261 cells). neural (21 clusters, 13,187 cells). muscle (17 clusters, 10,361 cells). cathepsin+ parenchymal cell (10 clusters, 28,901 cells). epidermal (11 clusters, 18,532 cells). intestine (11 clusters, 14,050 cells). protonephridia (10 clusters, 5,123 cells). secretory (15 clusters, 6,202 cells).
Extended Data Fig. 5
Extended Data Fig. 5. Identification and characterization of neoblast subclusters.
(a) Publicly reported neoblast specific genes and their expression in different subclusters of the neoblast in the integrated dataset of current study and Issigonis et al.. (b) Heatmap of top 30 genes expressed in neoblast subclusters, with unique patterns for es-neo cells. (c) Shannon entropy of different neoblasts. Each data point represents the mean value in one scRNA-seq sample from Fig. 4a, n = 16 samples were sampled. Two-sided Welch’s t-test. The boxplots show the median (center), IQR (box) and whiskers extending to 1.5 × IQR, observed minima and maxima (minima and maxima). (d) Velocities streamlines showing potential differentiation trajectories of neoblasts. (e) Heatmap showing the expression of 180 ‘unlimited primordial stem cells’ genes (top) and of whole transcriptome with a non-zero expression value (bottom) in neoblast subtypes, measured as the average of 16 samples. (f) Proportion of cells that express neoblast, proliferation, differentiation, and post-mitotic markers. (g) UMAP projection of neoblasts with cells colored by predicted cell cycle state (left) and proportions of cells at each state. Each dot represents a single neoblast, n = 8261 neoblasts were examined. Error bars: standard error of the mean (SEM). Source data
Extended Data Fig. 6
Extended Data Fig. 6. Expression of marker genes in neoblasts.
(a) UMAP plots colored by expression of marker genes. (b) UMAP plot shows different neoblast subtypes.
Extended Data Fig. 7
Extended Data Fig. 7. Neoblasts in the integrated analysis of Dai et al. and Issigonis et al.
(a) Subclusters of neoblasts from Dai et al. Head tissues were used. (b) Subclusters of neoblasts from Issigonis et al. Trunk tissues were used and named as ‘anterior’. (c) Subclusters of neoblasts from Issigonis et al. Copulatory regions were used and named as ‘posterior’. (d-e) Subclusters of neoblasts after integration of the three datasets. Integration with labels of data and cell type sources (d). neoA.1 and neoP.2 are es-neo2 (d, e). neoA.6, neoA.9 and neoP.7 are es-neo1 (d, e). neoA.4 and neoP.16 are nu-neoblasts (d, e).
Extended Data Fig. 8
Extended Data Fig. 8. Tert expression in single cell analysis and HCR-FISH.
(a) Violin plot showing the neoblast-specific expression of Tert. (b) Box plot showing Tert expression in various neoblast subclusters. Es-neo 1 and 2 have the most Terthigh cells (red dashed line: Tert expression level = 2). Each dot represents a Tert+ neoblast, n = 2488 neoblasts were examined. Two-sided Welch’s t-test. The boxplots show the median (center), IQR (box) and whiskers extending to 1.5 × IQR, observed minima and maxima (minima and maxima). (c) HCR-FISH detected a small subset of the Smedwi-1+ cells that expressed Tert at highest levels. Representative images of n = 3 individuals (d) HCR-FISH of Smedwi-1 and Tert in the head of a 5MO worm. Bottom-left: Smedwi-1+ and Terthigh cells. Bottom-right: Smedwi-1- and Terthigh cells. Representative images of n = 13 individuals. Percentage of Terthigh cells quantified from scRNA-seq and HCR-FISH data, normalized to number of Smedwi-1+ cells. Each dot represents a sample, n = 13, and 7 samples for scRNA-seq and HCR-FISH, respectively. Two-sided Welch’s t-test. Error bars represent mean ± SD. (e) Extra confocal images showing Smedwi-1+ and Terthigh cells in 5MO and 38MO planarians. Representative images of young (n = 3) and old (n = 4) individuals. (f) Head fragments at 10 days post amputation of control (n = 9) and Tert RNAi knockdown worms (n = 5). Top: regeneration defects in Tert RNAi. Bottom: Smedwi-1 and Tert expression in posterior ends. Representative images of n = 4 individuals. Source data
Extended Data Fig. 9
Extended Data Fig. 9. Age-associated molecular changes.
(a) Log2-transformed fold changes of PAGs during aging (y-axis, older v.s. young) and after regeneration (x-axis, older v.s. regenerated) in different tissues (neoblast, epidermal, protonephridia, and secretory) based on scRNA-seq data. Top right quadrant represents genes upregulated in older conditions, compared to either young or regenerated conditions. (b) Expression level of gene SOSd in different tissue types. (c) Expression of positional control gene ndk, wnt2, and ndl-4 during aging and after regeneration. Two-sided Wilcoxon Rank Sum test, p-value adjusted using Bonferroni correction. (d) Top 10 enriched terms from Gene Ontology enrichment analysis of non-rejuvenated up-regulated PAGs in neoblast and secretory cells. Two-sided Chi-square test (when all expected frequencies are greater than 5) or Fisher’s exact test, p-value adjusted with Benjamini-Hochberg correction (e) Heatmap of normalized enrichment scores (NES) obtained from functional enrichment analysis (GSEA) of gene expression signatures of planarian aging, mammalian aging and lifespan-extending interventions in mice. Cells are colored based on NES. Hierarchical clustering with Euclidean distance metric and complete linkage was utilized to cluster signatures and functions.
Extended Data Fig. 10
Extended Data Fig. 10. Rejuvenation of transcriptomic profiles in distal tails.
(a) Differentially expressed genes in old and old-regenerated tails compared with young tails, two-sided Wald test, p-value adjusted with Benjamini-Hochberg correction, adjusted p-value < 0.05, |log2FC| > 1. (b) Overlap of PAGs in tail and head (left: up-regulated, right: down-regulated). (c) Heatmap of expression profiles along planarian A/P axis showing distinct expression patterns of head and tail. (d) Log2-transformed fold changes of DEGs during tail aging (y-axis, 15MO v.s. 4MO) and after head regeneration (x-axis, 15MO v.s. 15MO-regenerated). The expression patterns of genes that distributed in blue region were reversed after head regeneration. Source data

References

    1. Lopez-Otin, C., Blasco, M. A., Partridge, L., Serrano, M. & Kroemer, G. Hallmarks of aging: an expanding universe. Cell186, 243–278 (2023). - PubMed
    1. Brunet, A., Goodell, M. A. & Rando, T. A. Ageing and rejuvenation of tissue stem cells and their niches. Nat. Rev. Mol. Cell Biol.24, 45–62 (2023). - PMC - PubMed
    1. Sousounis, K., Baddour, J. A. & Tsonis, P. A. Aging and regeneration in vertebrates. Curr. Top Dev. Biol.108, 217–246 (2014). - PubMed
    1. Rando, T. A. & Jones, D. L. Regeneration, rejuvenation, and replacement: turning back the clock on tissue aging. Cold Spring Harb. Perspect. Biol.13, a040907 (2021). - PMC - PubMed
    1. Oh, J., Lee, Y. D. & Wagers, A. J. Stem cell aging: mechanisms, regulators and therapeutic opportunities. Nat. Med.20, 870–880 (2014). - PMC - PubMed

LinkOut - more resources