Advancements in ecological niche models for forest adaptation to climate change: a comprehensive review
- PMID: 40181243
- PMCID: PMC12227795
- DOI: 10.1111/brv.70023
Advancements in ecological niche models for forest adaptation to climate change: a comprehensive review
Abstract
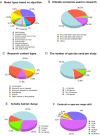
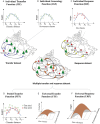
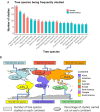
Climate change poses significant challenges to the health and functions of forest ecosystems. Ecological niche models have emerged as crucial tools for understanding the impact of climate change on forests at the population, species, and ecosystem levels. These models also play a pivotal role in developing adaptive forest conservation and management strategies. Recent advancements in niche model development have led to enhanced prediction accuracy and broadened applications of niche models, driven using high-quality climate data, improved model algorithms, and the application of landscape genomic information. In this review, we start by elucidating the concept and rationale behind niche models in the context of forestry adaptation to climate change. We then provide an overview of the advancements in occurrence-based, trait-based, and genomics-based models, contributing to a more comprehensive understanding of species responses to climate change. In addition, we summarize findings from 338 studies to highlight the progress made in niche models for forest tree species, including data sources, model algorithms, future climate scenarios used and diverse applications. To assist researchers and practitioners, we provide an exemplar data set and accompanying source code as a tutorial, demonstrating the integration of population genetics into niche models. This paper aims to provide a concise yet comprehensive overview of the continuous advancements and refinements of niche models, serving as a valuable resource for effectively addressing the challenges posed by a changing climate.
Keywords: assisted migration; climate niche shift; forest adaptation; genecology; landscape genomics; species distribution models (SDMs).
© 2025 The Author(s). Biological Reviews published by John Wiley & Sons Ltd on behalf of Cambridge Philosophical Society.
Figures


Similar articles
-
Climate is stronger than you think: Exploring functional planting and TRIAD zoning for increased forest resilience to extreme disturbances.PLoS One. 2025 Jun 27;20(6):e0326627. doi: 10.1371/journal.pone.0326627. eCollection 2025. PLoS One. 2025. PMID: 40577352 Free PMC article.
-
Integrating Microbial Community Data Into an Ecosystem-Scale Model to Predict Litter Decomposition in the Face of Climate Change.Glob Chang Biol. 2025 Jul;31(7):e70352. doi: 10.1111/gcb.70352. Glob Chang Biol. 2025. PMID: 40673352 Free PMC article.
-
A scoping review of tropical pioneer trees' roles for restoration and conservation management: Harungana madagascariensis (Hypericaceae) a widespread African species as a model.PeerJ. 2025 May 23;13:e19458. doi: 10.7717/peerj.19458. eCollection 2025. PeerJ. 2025. PMID: 40421372 Free PMC article.
-
Simulations of historical impacts of climate change and atmospheric chemistry on a northeastern U.S. forest ecosystem.Ecol Appl. 2025 Jul;35(5):e70079. doi: 10.1002/eap.70079. Ecol Appl. 2025. PMID: 40702586
-
The use of climate information to estimate future mortality from high ambient temperature: A systematic literature review.PLoS One. 2017 Jul 7;12(7):e0180369. doi: 10.1371/journal.pone.0180369. eCollection 2017. PLoS One. 2017. PMID: 28686743 Free PMC article.
References
-
- Abakumova, M. , Zobel, K. , Lepik, A. & Semchenko, M. (2016). Plasticity in plant functional traits is shaped by variability in neighbourhood species composition. New Phytologist 211(2), 455–463. - PubMed
-
- Aguirre‐Liguori, J. A. , Ramírez‐Barahona, S. & Gaut, B. S. (2021). The evolutionary genomics of species' responses to climate change. Nature Ecology & Evolution 5(10), 1350–1360. - PubMed
-
- * Ahmadi, K. , Alavi, S. J. , Amiri, G. Z. , Hosseini, S. M. , Serra‐Diaz, J. M. & Svenning, J.‐C. (2020). The potential impact of future climate on the distribution of European yew (Taxus baccata L.) in the Hyrcanian Forest region (Iran). International Journal of Biometeorology 64(9), 1451–1462. - PubMed
-
- * Ahmadi, K. , Mahmoodi, S. , Pal, S. C. , Saha, A. , Chowdhuri, I. , Kolyaie, S. , Linh, N. T. T. , Thai, V. N. & Kumar, L. (2023). Modeling tree species richness patterns and their environmental drivers across Hyrcanian mountain forests. Ecological Informatics 77, 102226.
-
- * Aidoo, O. F. , Souza, P. G. C. , Silva, R. S. , Junior, P. A. S. , Picanco, M. C. , Heve, W. K. , Duker, R. Q. , Ablormeti, F. K. , Setamou, M. & Borgemeister, C. (2023). Modeling climate change impacts on potential global distribution of Tamarixia radiata Waterston (hymenoptera: Eulophidae). Science of the Total Environment 864, 160962. - PubMed
Publication types
MeSH terms
Grants and funding
LinkOut - more resources
Full Text Sources
Medical

