. 2025 Apr 3;25(1):128.
doi: 10.1186/s12935-025-03755-5.

Pan-cancer analysis identifies CLEC12A as a potential biomarker and therapeutic target for lung adenocarcinoma

Affiliations

Pan-cancer analysis identifies CLEC12A as a potential biomarker and therapeutic target for lung adenocarcinoma

Desheng Zhou et al. Cancer Cell Int. .

Abstract

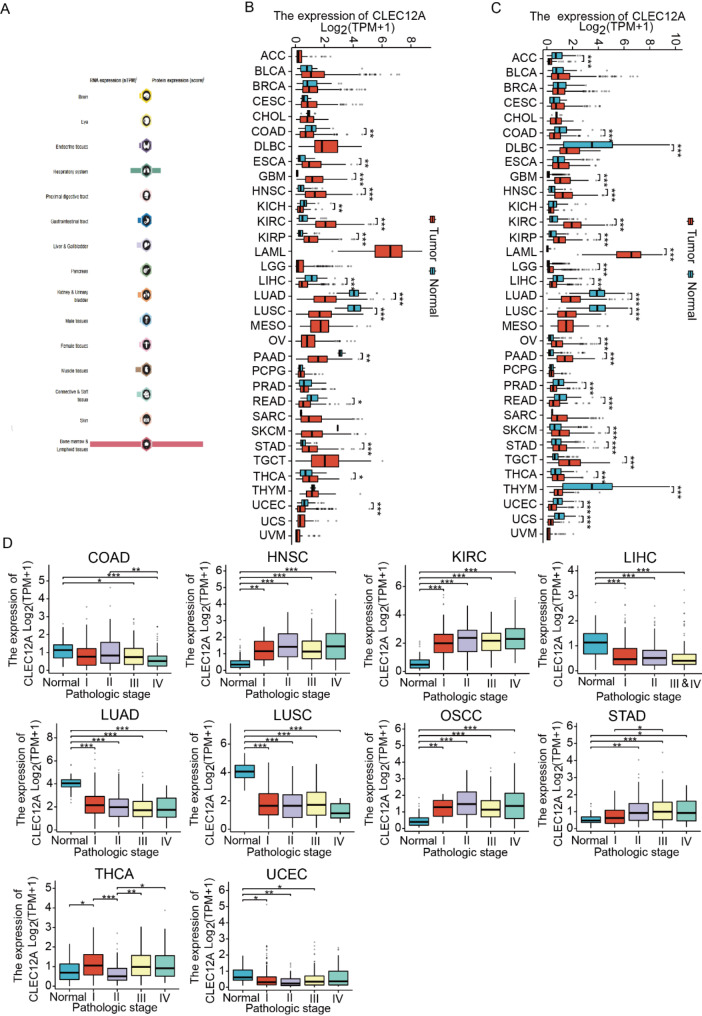
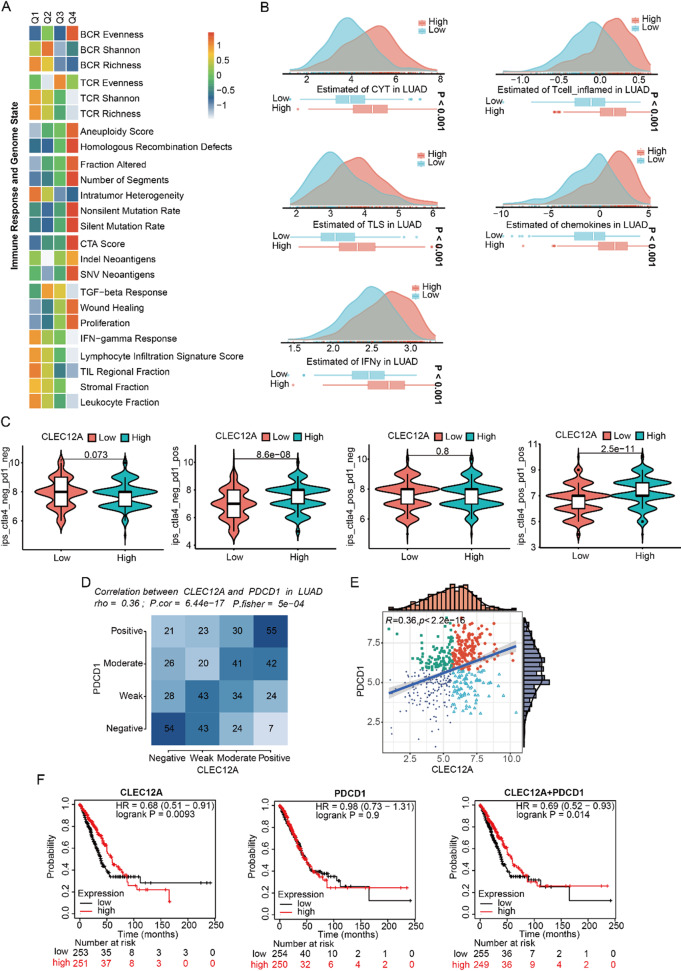
C-type lectin domain family 12 member A (CLEC12A) is a type II transmembrane glycoprotein widely expressed in innate immune cells, where it plays a crucial role in immune modulation and has been implicated in cancer progression. However, its precise function in oncogenesis and immune infiltration remains incompletely understood. To investigate this, we utilized multiple databases to assess the mRNA and protein expression levels of CLEC12A across normal tissues and a broad spectrum of cancers. We also evaluated its prognostic and diagnostic significance in pan-cancer contexts. Furthermore, the relationship between CLEC12A expression and immune cell infiltration, immune checkpoints, and immune predictors was explored. In addition, Weighted Gene Co-Expression Network Analysis (WGCNA) and differential expression analysis were performed to examine the biological relevance of CLEC12A in lung adenocarcinoma (LUAD). We also leveraged various databases to predict CLEC12A's response to immunotherapy and drug sensitivity. Finally, in vitro experiments validated the functional role of CLEC12A in LUAD. Our comprehensive pan-cancer analysis revealed that CLEC12A exhibited distinct expression patterns across different cancer types, suggesting its potential as both a diagnostic and prognostic biomarker. Notably, CLEC12A expression was strongly correlated with immune cell infiltration, immune checkpoints, and immune predictors. Functional enrichment analysis highlighted that increased CLEC12A expression in LUAD was associated with a variety of immune-related biological processes and pathways. Moreover, CLEC12A showed significant predictive value for immunotherapy outcomes, and several drugs targeting CLEC12A were identified. In vitro experiments further demonstrated that CLEC12A overexpression inhibited the proliferation, migration, and invasion of LUAD cells. Taken together, our findings position CLEC12A as a promising candidate for cancer detection, prognosis, and as a therapeutic target, particularly in LUAD, where it may serve as a potential target for both immunotherapy and targeted therapy.

Keywords: Biomarker; CLEC12A; Immune; LUAD; Pan-cancer; Therapy.


Conflict of interest statement

Declarations. Ethics approval and consent to participate: Not applicable. Consent for publication: All authors have read and agreed to the published the manuscript. Competing interests: The authors declare no competing interests.

Figures

Fig. 1
Fig. 1
Flow chart
Fig. 2
Fig. 2
Expression profile of CLEC12A in normal organs, tissues and pan-cancer. (A) The summary of CLEC12A mRNA and protein expression in human organs and tissues. (B) The expression of CLEC12A in matched tumor tissues and normal tissues utilizing data from the TCGA database. (C) Matched analysis comparing CLEC12A expression in TCGA database and GTEx database. (D) CLEC12A expression at diverse pathological stages in pan-cancer. ∗ p < 0.05, ∗∗ p < 0.01, ∗∗∗ p < 0.001
Fig. 3
Fig. 3
Survival analysis and diagnostic prediction of CLEC12A in pan-cancer. (A) Univariate Cox regression analysis of CLEC12A with OS in pan-cancer. (B) Kaplan–Meier analysis of the link between CLEC12A expression and OS in pan-cancer. (C) AUC of ROC curves examined the diagnosis performance of CLEC12A in pan-cancer
Fig. 4
Fig. 4
Genetic mutations and DNA methylation of CLEC12A in pan-cancer. (A) Mutation frequency of CLEC12A in pan-cancer. (B) Mutational distributions of CLEC12A in pan-cancer. (C) The SNV profile of CLEC12A in pan-cancer. (D) Bubble plot shows the spearman correlation between CLEC12A expression and methylation in pan-cancer. Positive and negative associations are depicted in red and blue, respectively. (E) Bubble plot illustrating differential CLEC12A methylation patterns across cancer types; red bubbles indicate hypermethylation, while blue bubbles represent hypomethylation (the higher the significance, the larger the bubble)
Fig. 5
Fig. 5
Immune landscape of CLEC12A in pan-cancer. (A) The links between the ESTIMATE scores (ESTIMATE score, Immune score, and Stromal score) and CLEC12A expression in pan-cancer. (B) Seven software were employed to analyze the links between CLEC12A expression and immune cell infiltration in pan-cancer. (C-E) The relationships between CLEC12A expression and TMB(C), MSI(D), and NEO(E) were displayed by the radar chart. (F, G) The expression of CLEC12A in valid cohort(R) and invalid cohort(N) and proportion of immunotherapy response between high- and low-CLEC12A cohorts in two Melanoma cohorts receiving ICB therapy
Fig. 6
Fig. 6
Functional analysis of CLEC12A in LUAD. (A) Heatmap depicts the link between modules and the expression of CLEC12A (According to the quartile of CLEC12A expression, the samples were divided into four phenotypes: Q1, Q2, Q3, and Q4(Q1 being the 25% with the highest expression and Q4 being the 25% with the lowest expression)). (B) The link between the green module’s membership and gene significance. (C) Circular histogram for GO analyses of hub genes of the green module. BP, biological processes; CC, cellular components; MF, molecular function. (D) Bar graph for KEGG pathway analyses of hub genes of the green module
Fig. 7
Fig. 7
Pathway enrichment analysis of CLEC12A in LUAD. (A) Volcano map shows the DEGs in high- and low-CLEC12A expression cohorts (red: up-regulation; blue: down-regulation). (B, C) GO analyses of up-(B) and low-regulation (C) DEGs. (D, E) KEGG analyses of up-(D) and low-regulation (E) DEGs
Fig. 8
Fig. 8
Predictive performance of CLEC12A in LUAD. (A) Proportion of patients living and dying in cohorts with CLEC12A different expression levels. Blue represents living patients, and red represents dead patients. (Q1 represents the 25% of the samples with the highest expression, Q4 represents the 25% of the samples with the lowest expression). (B, C) The prognostic significance of CLEC12A and clinicopathologic factors were analyzed by univariate(B) and multivariate(C) Cox analysis in the TCGA-LUAD dataset. (D) Multiple GEO datasets validated the prognostic significance of CLEC12A with clinicopathological factors. (E) Construction of a nomogram for predicting the survival rate of individuals with LUAD. (F) 1-, 3-, and 5-year calibration curves for evaluating the accuracy
Fig. 9
Fig. 9
Analysis of tumor immune infiltration for CLEC12A in LUAD. (A) The lollipop chart shows the correlation between CLEC12A expression and LUAD TME. (B) Seven algorithms evaluate the difference in LUAD TME between high and low CLEC12A expression cohorts. (C) Associations between CLEC12A expression and immune subtypes in 30 cancers. (D) Differences of immune subtypes between high and low expression cohorts of CLEC12A in LUAD
Fig. 10
Fig. 10
Single-Cell Analysis of CLEC12A in LUAD. (A) UMAP plot visualizes the distribution of cell types in scRNA data (GSE146100). (B) The UMAP plot shows the cell-type expression of CLEC12A in the GSE146100 database. (C) The Kruskal-Wallis rank sum test assessed the difference in expression of CLEC12A in different immune cell types. (D) The bubble map shows the pathway differences in each cell type in the positive and negative CLEC12A expression cohorts. Red represents an increase in the score of the pathway (activation) in the cohort with positive expression of CLEC12A, and blue represents a decrease in the score of the pathway (inhibition) in the cohort with positive expression of CLEC12A. The size of the bubble indicates significance, and larger means more significance
Fig. 11
Fig. 11
Prediction of CLEC12A expression for immunotherapy in LUAD. (A) Heat maps show the associations between CLEC12A expression and multiple immune responses and genomic states. From left to right, the heat map represents the intra-group mean of each immune response score and genome status score for the Q1, Q2, Q3, and Q4 subtypes. (B) The immune prediction in the score of the high- and low-CLEC12A expression cohort was evaluated by the EaSIeR model (including CYT, TLS, IFNy, Tcell_inflamed, and Chemokines features). (C) Immunotherapy IPS scores between high- and low- CLEC12A expression cohorts (pos, positive; neg, negative). (D) The scatter plot shows the Pearson correlation between PDCD1 and CLEC12A. (E) Fischer’s precise test explores the link between PDCD1 and CLEC12A. (F) KM analysis for CLEC12A, PDCD1 and CLEC12A combined with PDCD1 expression and OS in LUAD
Fig. 12
Fig. 12
Functional effects of CLEC12A on LUAD cells. (A) WB shows the protein expression of CLEC12A in one normal lung cell line and eight lung cancer cell lines. (B) WB shows overexpression of CLEC12A in H1975 and A549 cells. (C, D) The proliferation capacities were measured by CCK8 assay (C) and clone formation assay (D) in H1975 and A549 cells with CLEC12A overexpression. (E, F), The abilities of migration and invasion were measured by wound healing (E) and transwell assay (F) in H1975 and A549 cells with CLEC12A overexpression. *P < 0.05; **P < 0.01; ***P < 0.001

References

    1. Bray F, Laversanne M, Sung H, Ferlay J, Siegel RL, Soerjomataram I, Jemal A. Global cancer statistics 2022: GLOBOCAN estimates of incidence and mortality worldwide for 36 cancers in 185 countries. CA Cancer J Clin. 2024;74(3):229–63. - PubMed
    1. Siegel RL, Miller KD, Jemal A. Cancer statistics, 2019. CA Cancer J Clin. 2019;69(1):7–34. - PubMed
    1. Yang ZS, Tang XJ, Guo XR, Zou DD, Sun XY, Feng JB, Luo J, Dai LJ, Warnock GL. Cancer cell-oriented migration of mesenchymal stem cells engineered with an anticancer gene (PTEN): an imaging demonstration. Onco Targets Ther. 2014;7:441–6. - PMC - PubMed
    1. Li K, Zhang A, Li X, Zhang H, Zhao L. Advances in clinical immunotherapy for gastric cancer. Biochim Biophys Acta Rev Cancer. 2021;1876(2):188615. - PubMed
    1. Sharma P, Hu-Lieskovan S, Wargo JA, Ribas A. Primary, adaptive, and acquired resistance to cancer immunotherapy. Cell. 2017;168(4):707–23. - PMC - PubMed

LinkOut - more resources