. 2025 Apr 3;20(1):45.
doi: 10.1186/s13020-025-01078-1.

Pharmacological effects of bile acids on polycystic ovary syndrome via the regulation of chemerin

Affiliations

Pharmacological effects of bile acids on polycystic ovary syndrome via the regulation of chemerin

Tian-Tian Tong et al. Chin Med. .

Abstract

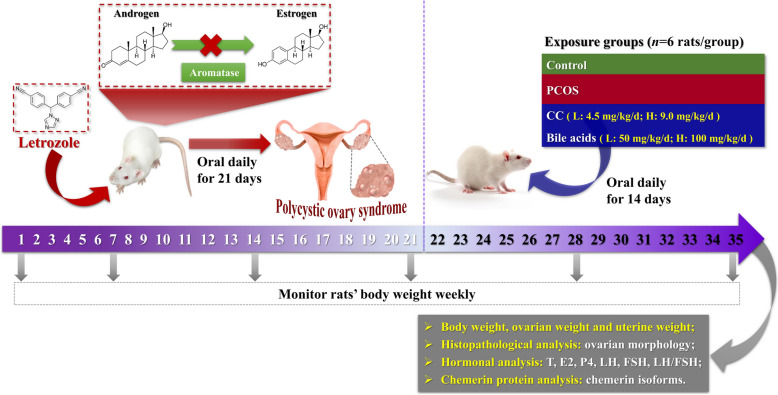
Background: Polycystic ovary syndrome (PCOS) poses significant health risks for women of reproductive age, and conventional treatments typically involve anti-hormonal interventions or surgical procedures, which often lead to lifelong medication cycles and potential side effects. Bile acids have been applied in the treatment of PCOS-related conditions, including obesity and type 2 diabetes. This study aimed to investigate the effects of bile acids on a PCOS rat model and explore the underlying mechanisms involved.

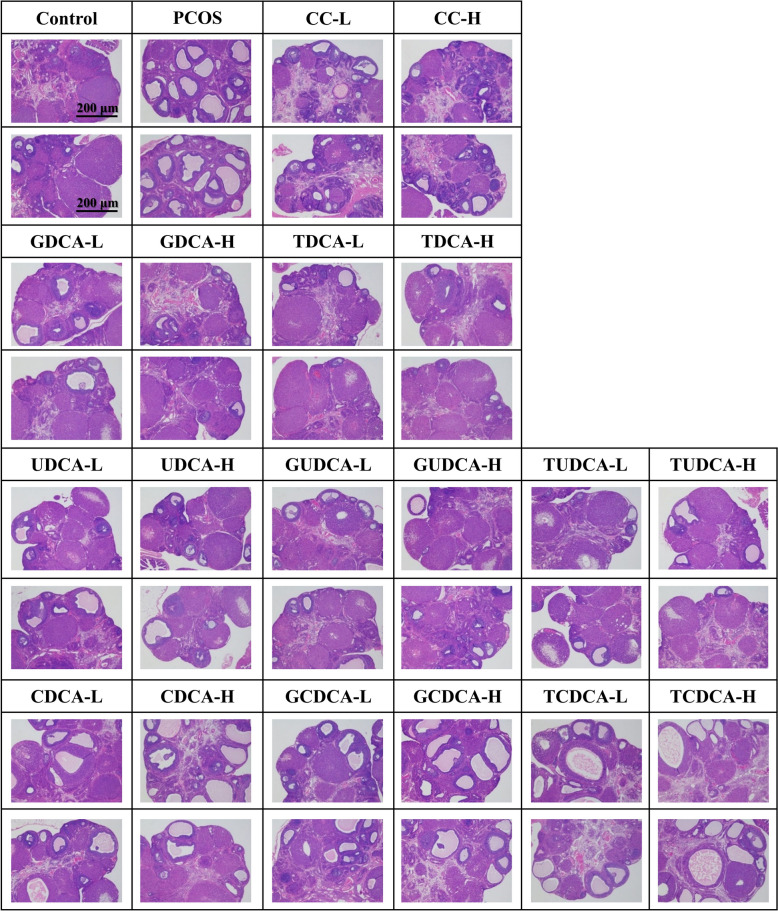
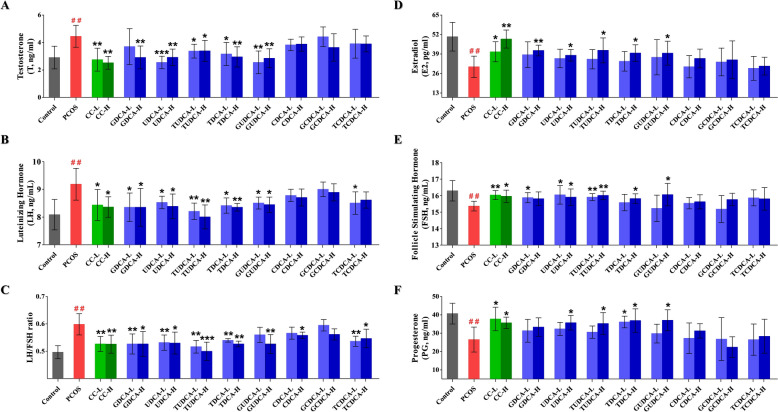
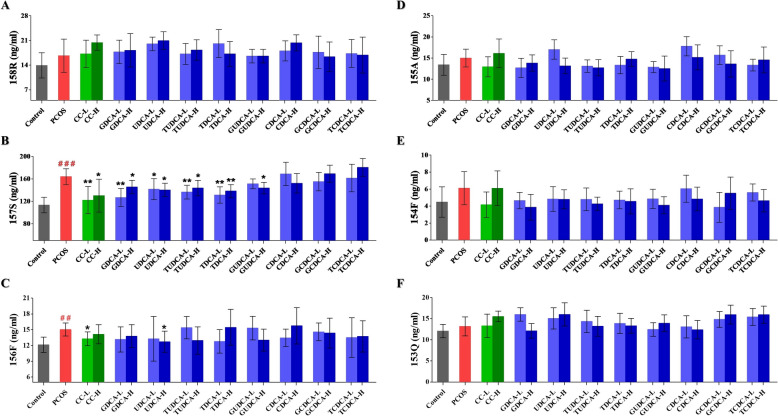
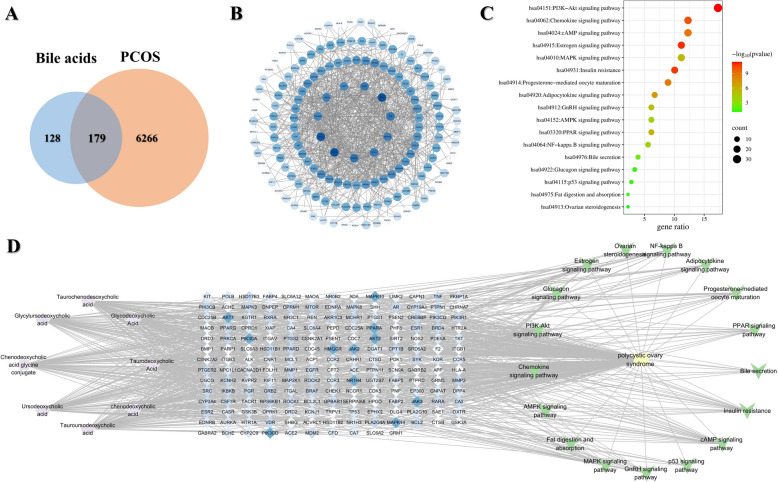
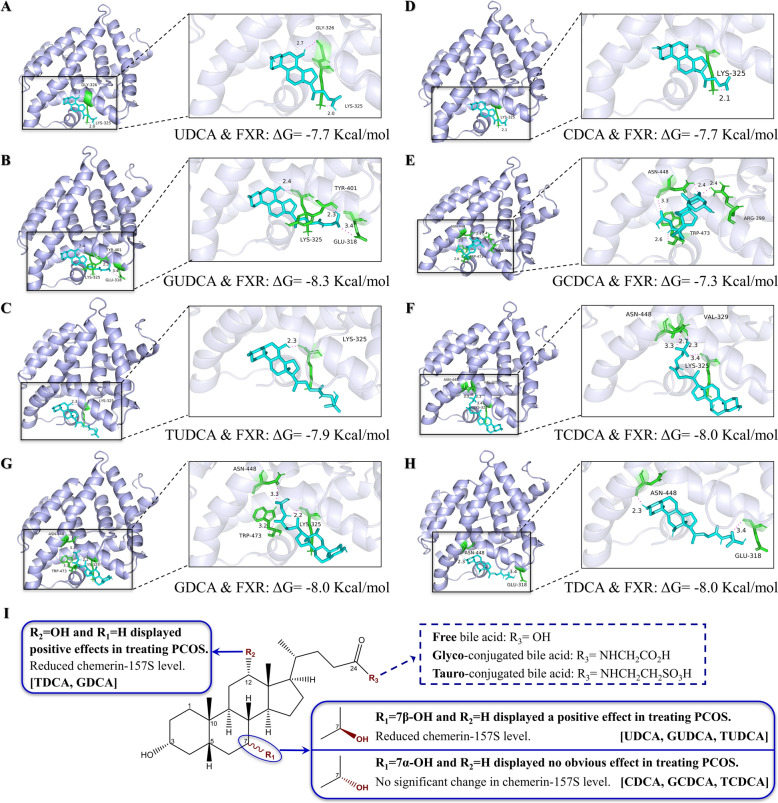
Methods: Morphological index evaluation, histopathological examination, and hormonal profiling were employed to assess the therapeutic effects of eight bile acids. A targeted proteomics was utilized to characterize and quantify highly homologous chemerin isoforms in rat serum. Network pharmacology analysis was conducted to identify potential targets and molecular mechanisms involved. Molecular docking was performed to evaluate the affinity between bile acids and farnesoid X receptor (FXR).

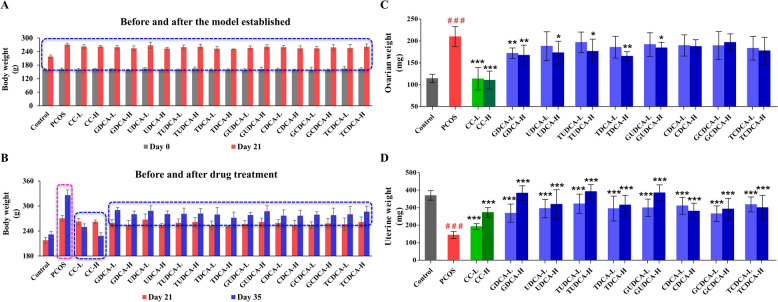
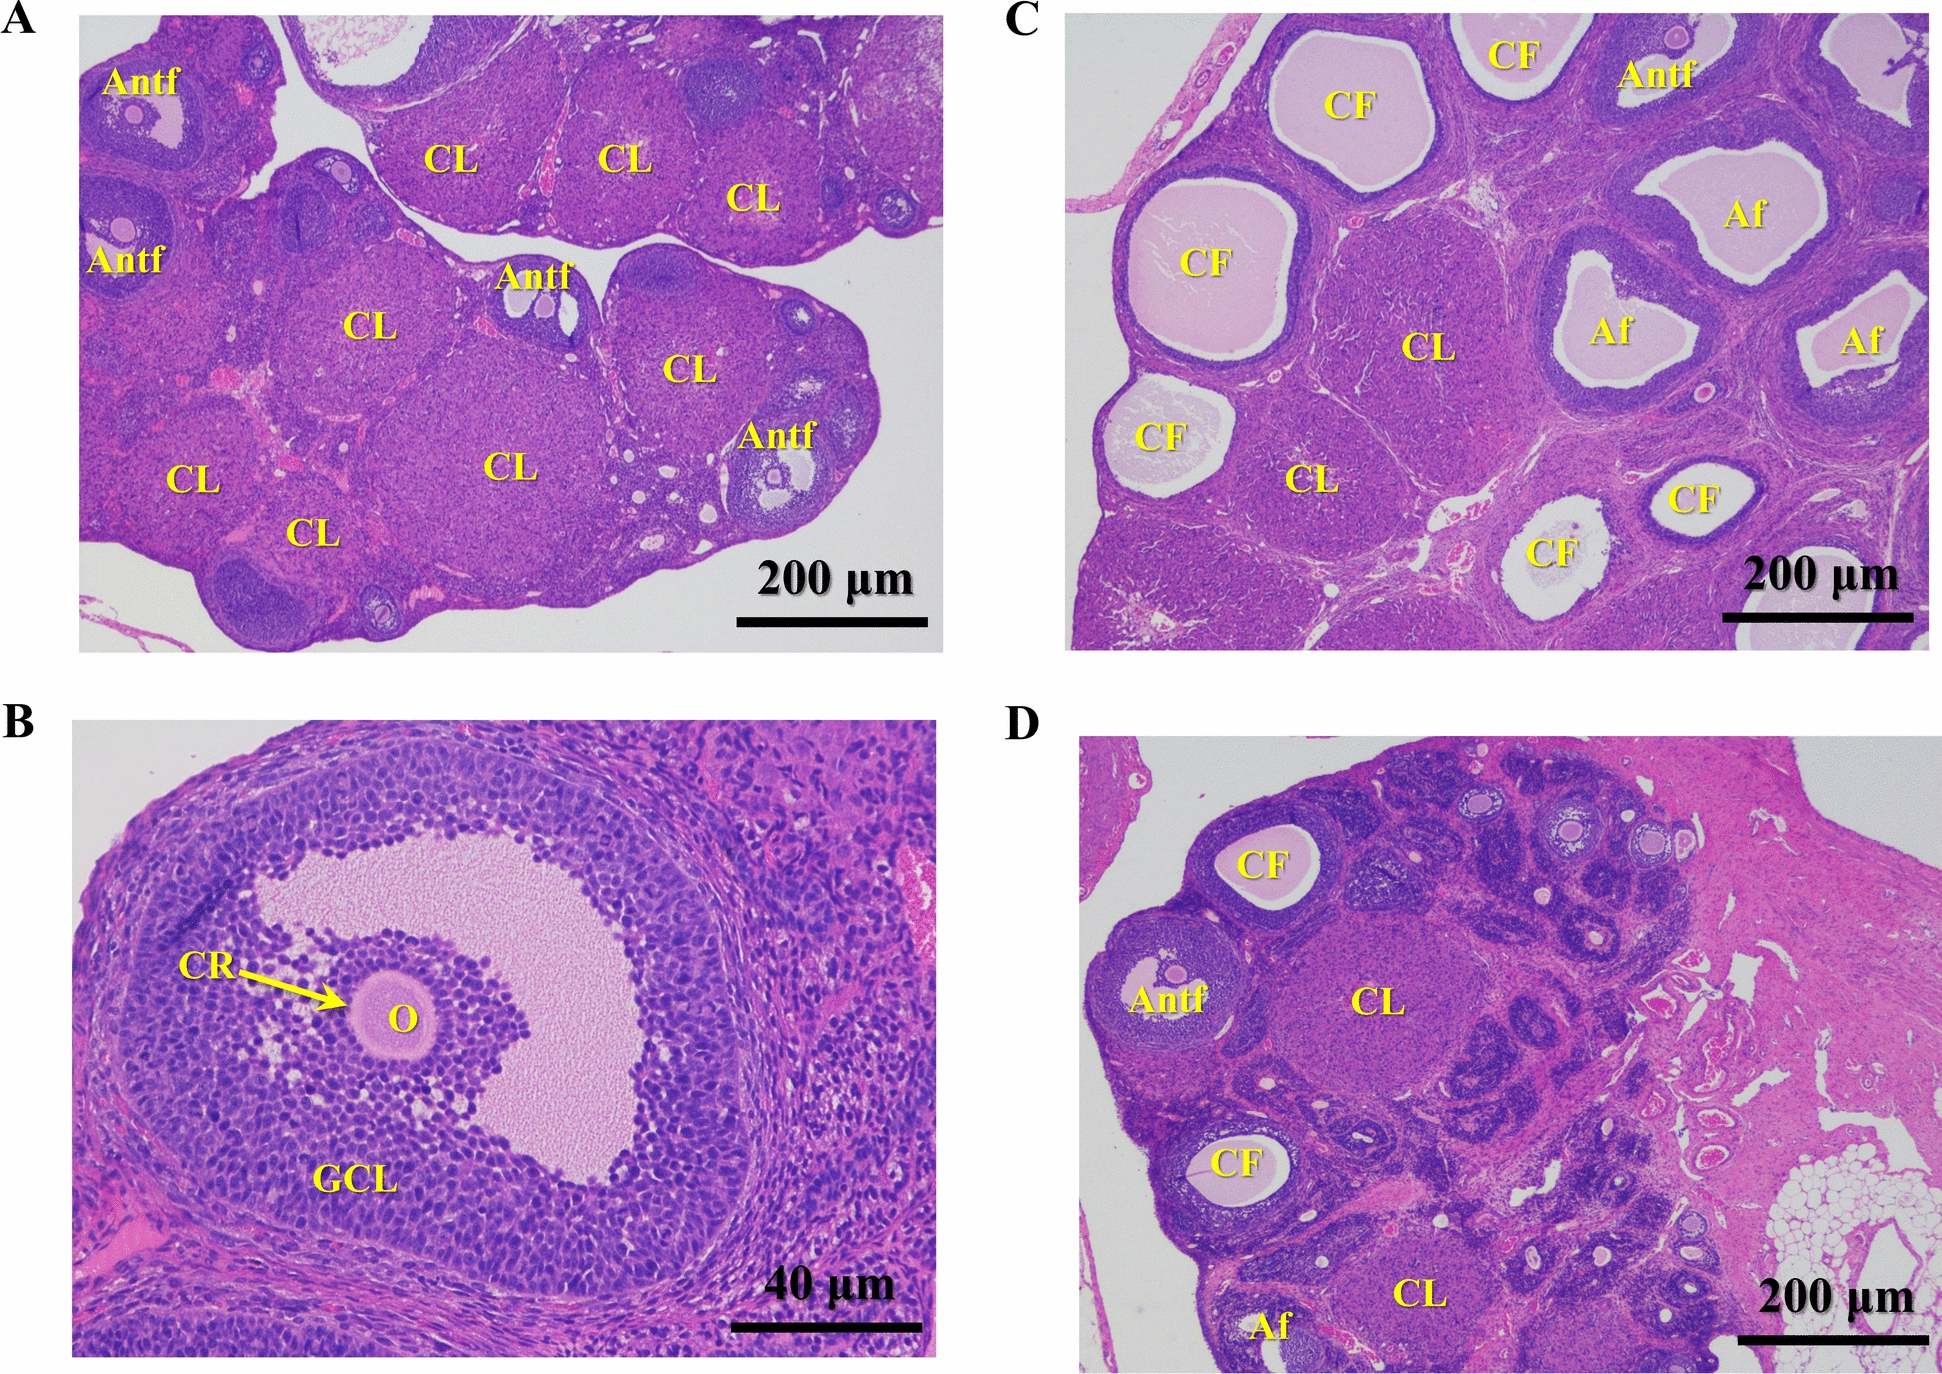
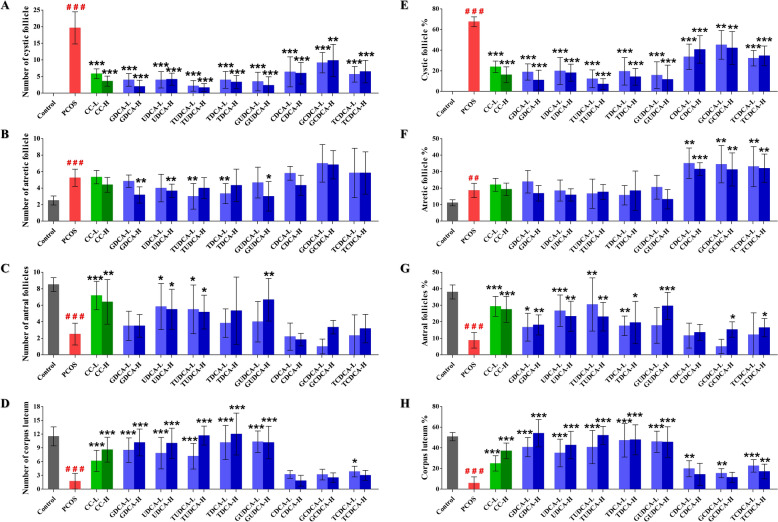
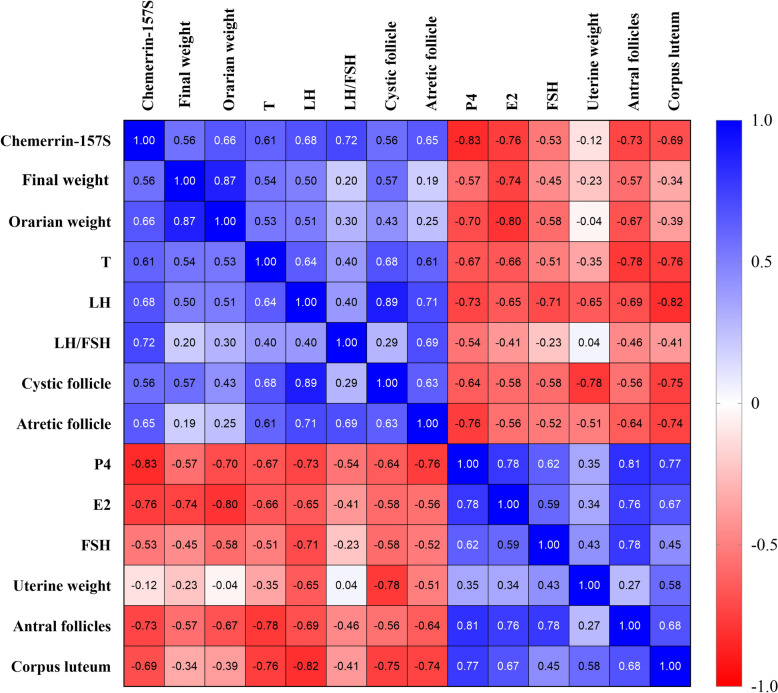
Results: Five of the eight bile acids markedly restored morphological indices, histopathological manifestations, hormonal imbalances, and chemerin isoform dysregulation. Notably, the therapeutic effects of TDCA and GUDCA on PCOS were reported for the first time. As the severity of the disease decreased, chemerin-157S was negatively correlated with progesterone (P4), estradiol (E2), antral follicles, and corpus luteum, respectively. Several chemerin-associated pathways have been identified via network pharmacology analysis. Additionally, a 7β-hydroxy group carried on the steroid skeleton of bile acids has been found to exhibit positive therapeutic efficacy in PCOS.

Conclusions: Downregulating chemerin levels via specific bile acids may be a promising therapeutic strategy for PCOS patients.

Keywords: Bile acids; Chemerin isoforms; LC/dynamic MRM-MS; Polycystic Ovarian Syndrome (PCOS); Structure–activity relationships.


Conflict of interest statement

Declarations. Ethics approval and consent to participate: All procedures were approved by the Animal Care Committee on the Ethics of Animal Experiments of the Institute of Analysis, Guangdong Academy of Sciences (NACC) with the licence of SYXK (Guangdong) 2019-0201 for the care and use of animals. Consent for publication: All the authors have agreed to publish this work in Chinese Medicine. Competing interests: The authors declare that they have no competing interests.

Figures

Fig. 1
Fig. 1
A schematic representation of the animal experiment. This schematic diagram illustrates the experimental timeline and treatment groups for investigating the effects of various bile acids on PCOS rats. The study lasted 35 days and was divided into two phases: an initial 21-day modelling phase with letrozole to induce PCOS, followed by a 14-day treatment phase with different therapeutic agents. This study assesses several endpoints, including body weight, ovarian and uterine weights, histopathological analysis of ovarian morphology, hormonal profiles (testosterone, estradiol, progesterone, luteinizing hormone, follicle-stimulating hormone, and their ratios), and chemerin protein isoforms
Fig. 2
Fig. 2
Effects of different bile acid treatments on body, ovarian and uterine weights in a rat model of PCOS (n = 6 rats/group). A Shows body weights before (Day 0) and after (Day 21) the establishment of the PCOS model. The dashed blue box highlights specific groups for comparison. B Illustrates body weights before (Day 21) and after (Day 35) drug treatment. The dashed blue boxe indicates groups with significant weight changes following treatment, and the dashed pink box indicates the weight change of the untreated PCOS group during this period. C Displays ovarian weights across different groups, with statistical significance markers indicating differences between groups. D Shows uterine weights across the same groups, also with statistical significance markers highlighting differences. All data are presented as the mean ± standard deviation (SD), and statistical significance is denoted by asterisks (*) and hashes (#). Hashes (#): Indicate significant differences between the PCOS group and the control group (#, P < 0.05; ##, P < 0.01; ###, P < 0.001); Asterisks (*): Indicate significant differences between treatment groups and the PCOS group (*, P < 0.05; **, P < 0.01; ***, P < 0.001)
Fig. 3
Fig. 3
Morphological changes in rat ovarian tissues from the control, PCOS, and CC groups. This set of images presents histopathological sections of ovarian tissue, stained with hematoxylin–eosin (H&E). A At 40× magnification, images of ovarian tissue from the control group show multiple corpora lutea (CL) and antral follicles (Antf). The scale bar represents 200 μm. B At 200× magnification, image of an antral follicle structure in the control group, illustrating the oocyte (O), corona radiate (CR) and granulosa cell layers (GCLs). The scale bar represents 40 μm. C At 40× magnification view of ovarian tissue from the PCOS group, which exhibited numerous cystic follicles (CFs), atretic follicles (Afs), CLs and Antfs. The scale bar represents 200 μm. D At 40× magnification, images of ovarian tissue from the positive control group, showing the CL, Antf and Af. The scale bar represents 200 μm
Fig. 4
Fig. 4
Effects of bile acid treatments on ovarian histopathological parameters in PCOS. This figure presents the impact of various bile acid treatments on different ovarian histopathological parameters in a PCOS model. The eight subfigures (AH) depict measurements across different groups, including control, PCOS, and multiple treatment groups with low and high doses of different bile acids. A Number of cystic follicles: Shows the count of cystic follicles across groups; B Number of atretic follicles: Illustrates the count of atretic follicles; C Number of antral follicles: Displays the count of antral follicles; D Number of corpus luteum: Shows the count of corpus luteum across groups; E Cystic follicle percentage: Displays the percentage of cystic follicles in all parameters; F Atretic follicle percentage: Illustrates the percentage of atretic follicles in all parameters; G Antral follicle percentage: Displays the percentage of antral follicles in all parameters; H Corpus luteum percentage: Shows the percentage of corpus luteum in all parameters. All data are presented as the mean ± standard deviation (SD), and statistical significance is denoted by asterisks (*) and hashes (#). Hashes (#): Indicate significant differences between the PCOS group and the control group (#, P < 0.05; ##, P < 0.01; ###, P < 0.001); Asterisks (*): Indicate significant differences between treatment groups and the PCOS group (*, P < 0.05; **, P < 0.01; ***, P < 0.001)
Fig. 5
Fig. 5
Comparative histopathological analysis of ovarian tissues in the control, PCOS and treatment groups. This figure presents a series of histopathological images of ovarian tissue from different experimental groups, with two representative samples listed for each group. Each image is stained with hematoxylin and eosin (H&E) to visualize the ovarian structure and cellular details. All images are captured at 40 × magnification, with scale bars representing 200 μm. The histopathological changes, such as follicular development and cyst formation, can be compared across the different treatment groups to assess the effects of each bile acid on PCOS pathology
Fig. 6
Fig. 6
Effects of different bile acid treatments on hormonal profiles in rats with PCOS. This figure presents the hormonal profiles of various groups, including the control, PCOS, and different bile acid treatment groups, at low and high doses. The six subfigures (A-F) depict different hormonal measurements. A Shows the concentration of testosterone (T, ng/mL); B Illustrates the concentration of luteinizing hormone (LH, ng/mL) across groups; C Displays the ratio of luteinizing hormone to follicle-stimulating hormone (LH/FSH); D Shows the concentration of estradiol (E2, pg/mL); E Illustrates the concentration of follicle-stimulating hormone (FSH, ng/mL); F Displays the concentration of progesterone (P4, ng/mL). All data are presented as the mean ± standard deviation (SD), and statistical significance is denoted by asterisks (*) and hashes (#). Hashes (#): Indicate significant differences between the PCOS group and the control group (#, P < 0.05; ##, P < 0.01; ###, P < 0.001); Asterisks (*): Indicate significant differences between treatment groups and the PCOS group (*, P < 0.05; **, P < 0.01; ***, P < 0.001)
Fig. 7
Fig. 7
Comparative analysis of chemerin isoform levels in the rats in each group (n = 6 rats/group). This figure presents the chemerin isoform levels of various groups, including control, PCOS, and different bile acid treatment groups, at low and high doses. A Chemerin-158R (ng/mL); B Chemerin-157S (ng/mL); C Chemerin-156F (ng/mL); D Chemerin-155A (ng/mL); E Chemerin-154F (ng/mL); F Chemerin-153Q (ng/mL). All data are presented as the mean ± standard deviation (SD), and statistical significance is denoted by asterisks (*) and hashes (#). Hashes (#): Indicate significant differences between the PCOS group and the control group (#, P < 0.05; ##, P < 0.01; ###, P < 0.001); Asterisks (*): Indicate significant differences between treatment groups and the PCOS group (*, P < 0.05; **, P < 0.01; ***, P < 0.001)
Fig. 8
Fig. 8
Correlation heatmaps of various biological parameters associated with PCOS. This heatmap illustrates the Pearson correlation coefficients among various biological parameters in this study. Each cell represents the correlation coefficient (r) between one parameter and the corresponding parameter. The color gradient ranges from red (negative correlation) to blue (positive correlation), with the intensity indicating the strength of the correlation
Fig. 9
Fig. 9
Network pharmacology analysis of bile acids for the treatment of PCOS. A Venn diagram of bile acid targets and PCOS targets: The blue circle represents the targets of bile acids, and the orange circle represents the targets of PCOS, and the intersection of the two circles represents the targets of bile acids for PCOS. B PPI network of related targets: The nodes represent potential therapeutic targets of bile acids against PCOS. The larger the node is, the higher the target degree and the greater the number of connections to other nodes. PPI = protein–protein interaction. C The top 17 KEGG-enriched pathways: This bubble chart presents various signalling pathways involved in PCOS. Each bubble represents a signalling pathway, with the size of the bubble corresponding to the gene ratio (number of involved genes over total pathway genes) and the color indicating the significance level based on the − log10 (P-value). D Integrated molecular interaction map: This comprehensive map integrates data from the previous panels (AC), showing the intricate network of interactions between bile acids, targets, and signalling pathways associated with PCOS. It provides a holistic view of the underlying molecular mechanisms of this disease. The targets section links bile acids and signalling pathways related to PCOS, where each blue diamond node represents a gene or protein. The deeper the color of the node, the greater its degree value, indicating that the gene or protein is of greater significance
Fig. 10
Fig. 10
Molecular docking of bile acids with FXR and the structure–activity relationship of bile acids in the treatment of PCOS. AH Molecular docking simulations illustrating the binding of various bile acids to FXR, along with their corresponding binding free energies (ΔG) in Kcal/mol. Each figure shows the 3D structure of FXR with the docked bile acid in the binding site, highlighting key interactions. A UDCA with FXR: ΔG = − 7.7 kcal/mol; B GUDCA with FXR: ΔG = -8.3 kcal/mol; C TUDCA with FXR: ΔG = − 7.9 kcal/mol; D CDCA with FXR: ΔG = -7.7 kcal/mol; E GCDDCA with FXR: ΔG = − 7.3 kcal/mol; F TCDDCA with FXR: ΔG = -8.0 kcal/mol; G GDCA with FXR: ΔG = − 8.0 kcal/mol; H TDCA with FXR: ΔG = -8.0 kcal/mol. I The figure illustrates how different substituents (R1, R2, and R3) on the bile acid structure influence their therapeutic effects on PCOS and their impact on chemerin-157S levels. Bile acids with R₂ = OH and R₁ = H (e.g., TDCA, GDCA) exhibit positive therapeutic effects on PCOS and decrease chemerin-157S levels. Those with R₁ = 7β-OH and R₂ = H (e.g., UDCA, GUDCA, TUDCA) also have positive effects, whereas bile acids with R₁ = 7α-OH and R₂ = H (e.g., CDCA, GCDDCA, TCDDCA) do not show significant effects on PCOS or chemerin-157S levels. Bile acids can be conjugated with either glycine or taurine, usually at the carbon-24 position (R3 = NHCH2CO2H or NHCH2CH2SO3H)

Similar articles

References

    1. Deans R. Polycystic ovary syndrome in adolescence. Med Sci (Basel). 2019;7(10):101. - PMC - PubMed
    1. Walter K. What is polycystic ovary syndrome? JAMA. 2022;327(3):294. - PubMed
    1. Ganie MA, Vasudevan V, Wani IA, Baba MS, Arif T, Rashid A. Epidemiology, pathogenesis, genetics & management of polycystic ovary syndrome in India. Indian J Med Res. 2019;150(4):333–44. - PMC - PubMed
    1. Glueck CJ, Goldenberg N. Characteristics of obesity in polycystic ovary syndrome: etiology, treatment, and genetics. Metabolism. 2019;92:108–20. - PubMed
    1. Franks S. Polycystic ovary syndrome in adolescents. Int J Obes (Lond). 2008;32(7):1035–41. - PubMed

LinkOut - more resources