. 2025 Apr 3;23(1):395.
doi: 10.1186/s12967-024-05913-1.

SOX4 accelerates intervertebral disc degeneration via EZH2/NRF2 pathway in response to mitochondrial ROS-dependent NLRP3 inflammasome activation in nucleus pulposus cells

Affiliations

SOX4 accelerates intervertebral disc degeneration via EZH2/NRF2 pathway in response to mitochondrial ROS-dependent NLRP3 inflammasome activation in nucleus pulposus cells

Wenzhi Zhao et al. J Transl Med. .

Abstract

Objective: The transcription factor SRY-related HMG-box 4 (SOX4) has been implicated in intervertebral disc diseases. This study aimed to investigate the role of SOX4 in intervertebral disc degeneration (IDD) and explore the underlying molecular mechanisms.

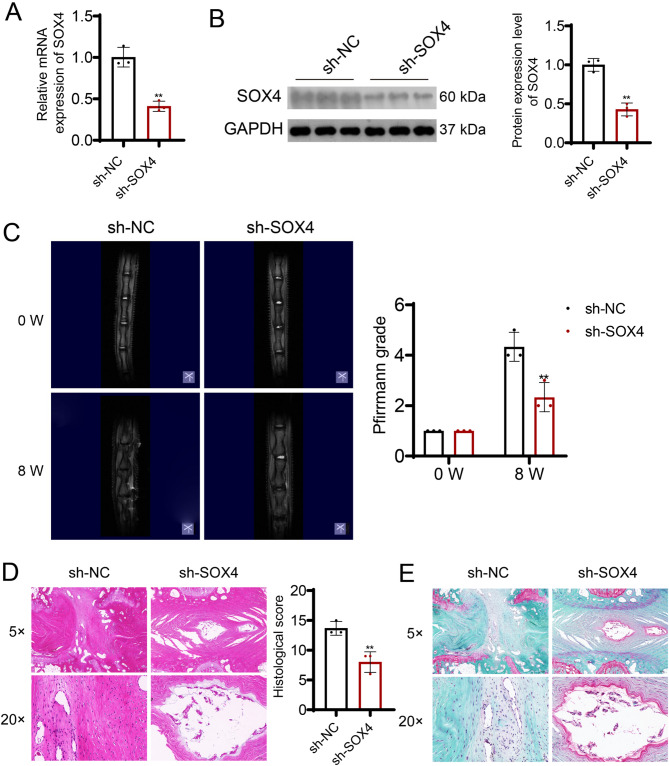
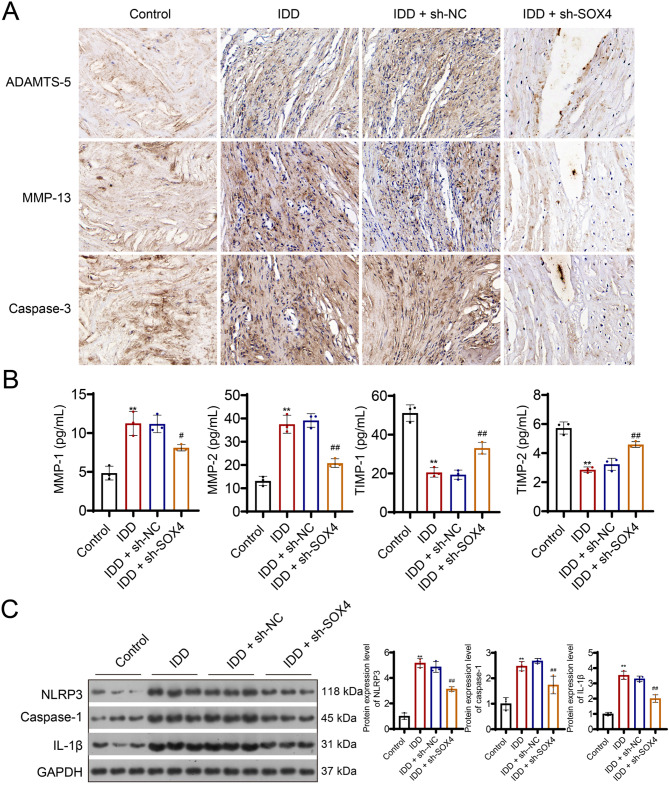
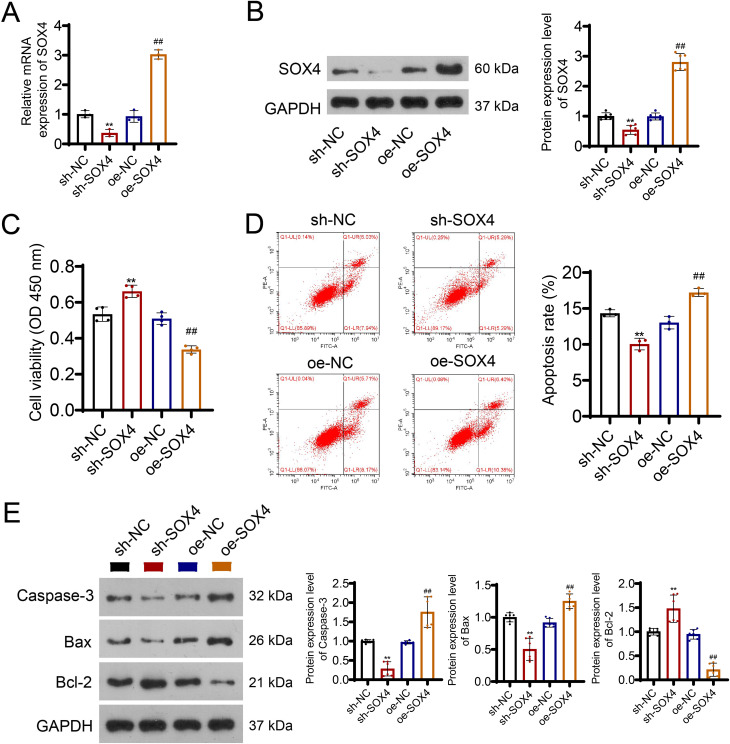
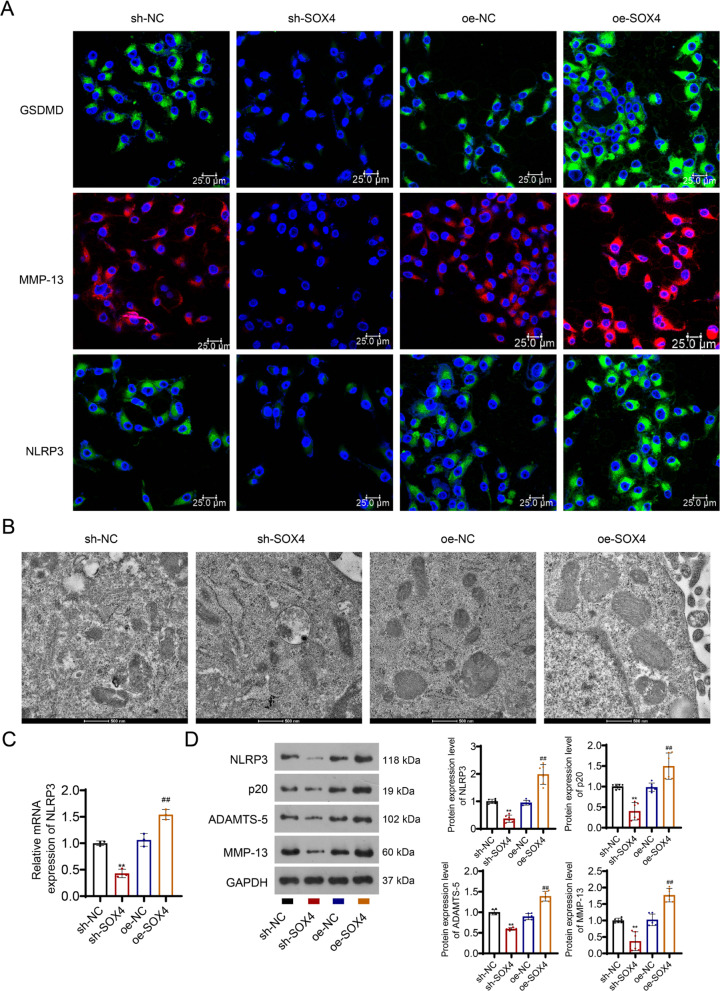
Methods: We established an IDD rat model via surgery and analyzed SOX4 expression using qRT-PCR and Western blotting. Histological evaluation, immunohistochemistry, and Safranin O staining assessed IDD progression. In vitro, an IDD cellular model was constructed using IL-1β-stimulated nucleus pulposus (NP) cells. SOX4 knockdown and overexpression experiments in NP cells examined SOX4 effects on ECM degradation, NLRP3-mediated pyroptosis, and mitochondrial ROS-dependent NLRP3 inflammasome activation. The involvement of the EZH2/NRF2 pathway in SOX4-mediated NLRP3 activation was also examined.

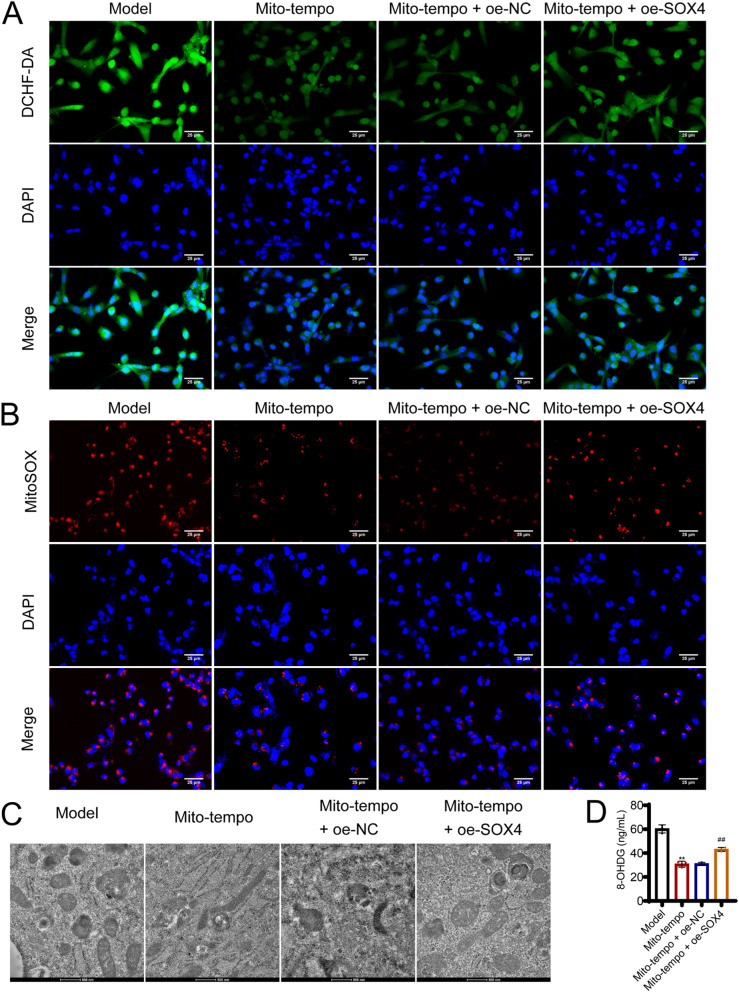
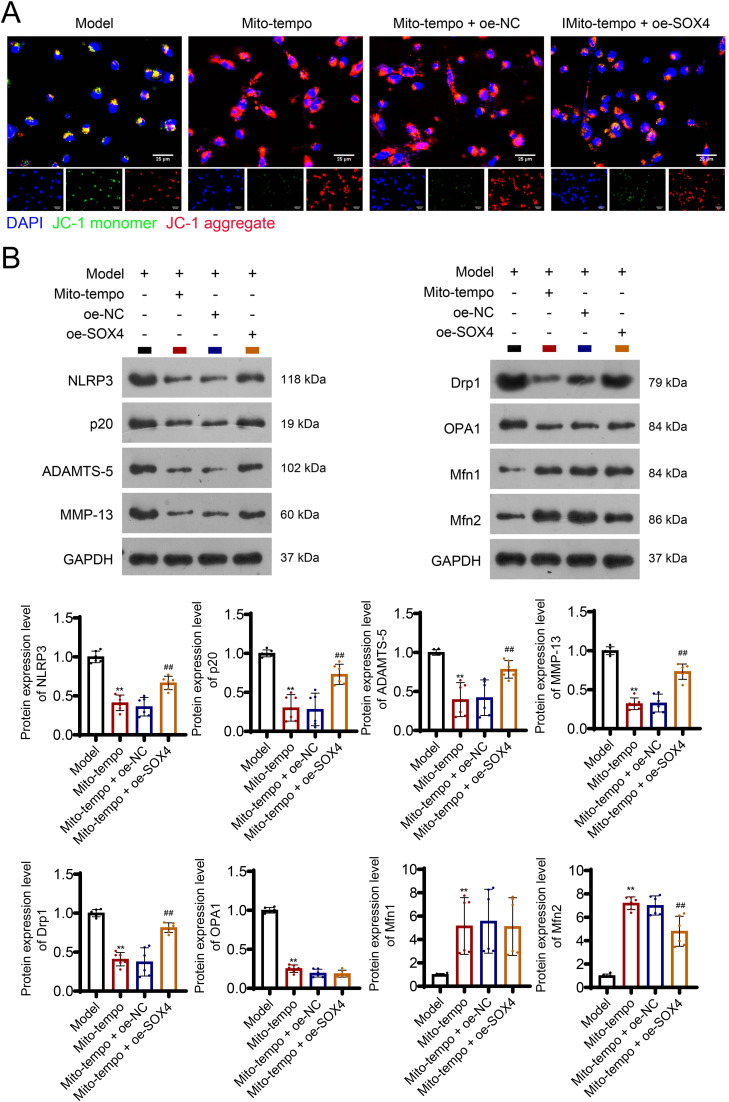
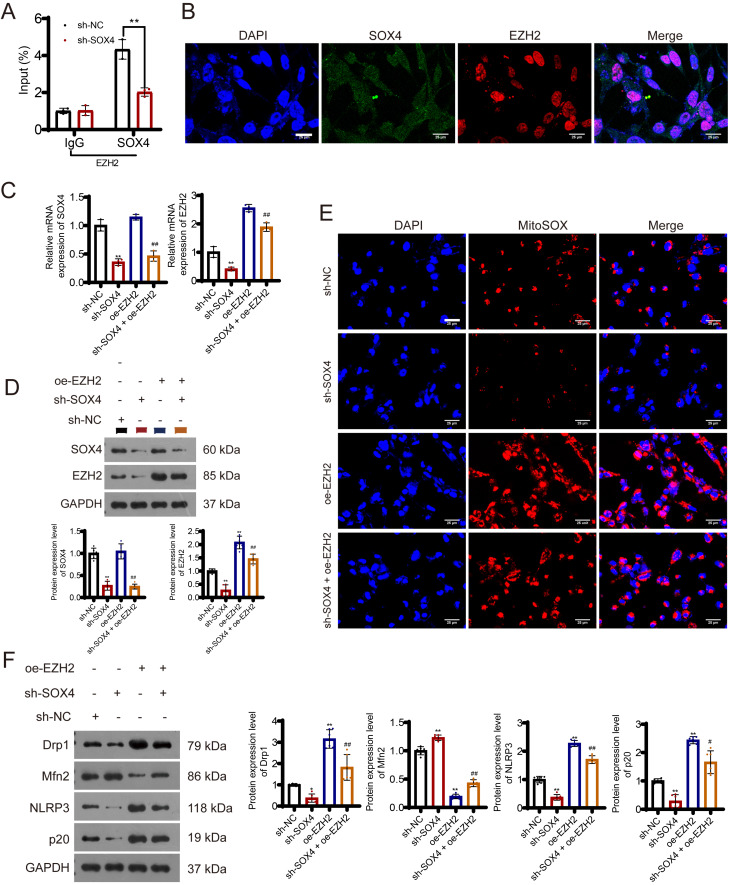
Results: SOX4 expression was significantly increased in IDD rats and promoted IDD progression. Knockdown of SOX4 inhibited ECM degradation and NLRP3-mediated pyroptosis in NP cells. In vitro experiments showed that SOX4 promoted ECM degradation by upregulating MMPs and ADAMTS-5 expression, and suppressed collagen II and aggrecan synthesis. SOX4 knockdown inhibited NLRP3-mediated pyroptosis, while overexpression accelerated it in NP cells. Additionally, SOX4 was found to exacerbate mitochondrial ROS-dependent NLRP3 inflammasome activation in NP cells. Further investigation revealed that SOX4 enhanced NLRP3 inflammasome activation by upregulating EZH2 expression and modulating the EZH2/NRF2 pathway, with EZH2 inhibition attenuating SOX4-induced NLRP3 activation.

Conclusion: Our findings suggest that SOX4 accelerates IDD progression by promoting NLRP3 inflammasome activation via modulating the EZH2/NRF2 pathway, leading to NP cell pyroptosis and ECM degradation. Targeting SOX4 may represent a potential therapeutic strategy for treating IDD.

Keywords: EZH2/NRF2 pathway; Extracellular matrix degradation; Intervertebral disc degeneration; NLRP3 inflammasome activation; Pyroptosis; SRY-related HMG-box 4.


Conflict of interest statement

Declarations. Ethics approval and consent to participate: This study was performed in line with the principles of the Declaration of Helsinki. Approval was granted by the Ethics Committee of Yangzhou University (No. 202306014). Consent for publication: Not applicable. Conflict of interest: The authors declare no conflict of interest.

Figures

Fig. 1
Fig. 1
SOX4 expression is increased in intervertebral disc degeneration (IDD) rats and promotes IDD progression. (AB) Quantitative real-time PCR (qRT-PCR) and Western blot analysis showing the expression of SOX4 in the sh-SOX4 and sh-NC groups. (C) T2-weighted MRI and Pfirrmann grading at 8 weeks post-surgery for the sh-SOX4 and sh-NC groups. (DE) HE staining and safranin O staining of nucleus pulposus (NP) tissue at week 8 post-surgery in the sh-SOX4 and sh-NC groups; magnification: 5× and 20×. **P < 0.01 versus the sh-NC group
Fig. 2
Fig. 2
Knockdown of SOX4 inhibits ECM degradation and NLRP3-mediated pyroptosis in IDD rats. (A) Immunohistochemical staining of ADAMTS-5, MMP-13, and caspase-3 in NP tissues from the IDD, control, IDD + sh-SOX4, and IDD + sh-NC groups; scale bar: 20 μm. (B) ELISA analysis of the expression of MMP-1, MMP-2, TIMP-1, and TIMP-2 in NP cell supernatants. (C) Western blot analysis indicating the protein expression of NLRP3, caspase-1, and IL-1β in NP tissues from the IDD, control, IDD + sh-SOX4, and IDD + sh-NC groups. **P < 0.01 versus the control group; #P < 0.05 and ##P < 0.01 versus the IDD + sh-NC group
Fig. 3
Fig. 3
Evaluation of apoptosis in IL-1β-stimulated NP cells with SOX4 knockdown and overexpression. (A-B) Detection of SOX4 expression in NP cells using qRT-PCR and Western blotting. (C) Cell viability test (CCK-8) showing the effect of SOX4 knockdown and overexpression in IL-1β-stimulated NP cells. (D) Flow cytometry analysis of cell apoptosis in IL-1β-stimulated NP cells after knockdown and overexpression of SOX4. (E) Western blot analysis of apoptosis markers (caspase-3, Bcl-2, and Bax) in IL-1β-induced NP cells after sh-SOX4 and oe-SOX4 transfection. **P < 0.01 versus the sh-NC group; ##P < 0.01 versus the oe-NC group
Fig. 4
Fig. 4
SOX4 exacerbates NLRP3 inflammasome activation in NP cells. (A) Immunofluorescence analysis to assess the expression of GSDMD (pyroptosis marker), MMP13, and NLRP3 in IL-1β-treated NP cells with SOX4 knockdown and overexpression; scale bar: 25 μm. (B) Transmission Electron Microscopy (TEM) images showing the mitochondrial morphology in NP cells with SOX4 knockdown and overexpression; scale bar: 500 nm. (CD) qRT-PCR or Western blot analysis of NLRP3 inflammasome activation proteins (NLPR3 and p20), ADAMTS-5, and MMP-13 in IL-1β-induced NP cells with SOX4 knockdown and overexpression. **P < 0.01 versus the sh-NC group; ##P < 0.01 versus the oe-NC group
Fig. 5
Fig. 5
SOX4 overexpression induces the mitochondrial damage in NP cells. (A) The H2DCF-DA assay analyzed the intracellular ROS levels of NP cells following Mito-tempo treatment and/or SOX4 overexpression; scale bar: 25 μm. (B) MitoSOX Red staining demonstrating mitochondrial ROS levels in NP cells; scale bar: 25 μm. (C) TEM images displaying mitochondrial morphology in NP cells; scale bar: 100 nm. (D) Levels of 8-OHdG in NP cells were measured by ELISA. **P < 0.01 versus the model group; ##P < 0.01 versus the Mito-tempo + oe-NC group
Fig. 6
Fig. 6
SOX4 overexpression induces the mitochondrial damage in NP cells by promoting NLRP3 inflammasome activation. (A) JC-1 assay results displaying the mitochondrial membrane potential in NP cells pre-treated with Mito-tempo and/or oe-SOX4/NC transfection; scale bar: 25 μm. (B) Western blot analysis indicating the protein expression of NLPR3, p20, ADAMTS-5, MMP-13, and mitochondrial morphology-related proteins (Drp1, OPA1, Mfn1/2) following Mito-tempo treatment and/or SOX4 overexpression. **P < 0.01 versus the model group; ##P < 0.01 versus the Mito-tempo + oe-NC group
Fig. 7
Fig. 7
SOX4 promotes NLRP3 inflammasome activation in NP cells through upregulating EZH2 expression. (A) NP cells were infected with indicated sh-NC or sh-SOX4. Cells were collected for ChIP-qRT-PCR analysis using the IgG or SOX4 antibody in NP cells. (B) Immunofluorescence analysis displaying co-localization of SOX4 and EZH2 in the nucleus of NP cells; scale bar: 25 μm. (CD) qRT-PCR and Western blot analysis demonstrating the expression of SOX4 and EZH2 after oe-EZH2 and/or sh-SOX4 transfection in IL-1β-induced NP cells. (E) MitoSOX Red staining showing mitochondrial ROS production in NP cells after oe-EZH2 and/or sh-SOX4 transfection; scale bar: 25 μm. (F) Western blot analysis indicating the protein expression of NLRP3, p20, Drp1, and Mfn2 following oe-EZH2 and/or sh-SOX4 transfection. *P < 0.05 and **P < 0.01 versus the sh-NC group; #P < 0.05 and ##P < 0.01 versus the oe-EZH2 group
Fig. 8
Fig. 8
SOX4 enhances NLRP3 inflammasome activation in NP cells via the EZH2/Nrf2 pathway. (AB) qRT-PCR and Western blot analysis showing the expression of SOX4, EZH2, and Nrf2 in NP cells after treatment with ML385 and/or sh-SOX4. (C) CCK8 assay results demonstrating cell viability after treatment with ML385 and/or sh-SOX4. (D) Levels of 8-OHdG in NP cells were measured by ELISA. (E) JC-1 assay indicating the mitochondrial membrane potential after treatment with ML385 and/or sh-SOX4; scale bar: 25 μm. (F) DCFH-DA probe showing ROS levels in NP cells after treatment with ML385 and/or sh-SOX4; scale bar: 25 μm. (G) Western blot analysis of NLPR3, p20, Drp1, OPA1, Mfn1, and Mfn2 protein expression in NP cells following treatment with ML385 and/or sh-SOX4. *P < 0.05 and **P < 0.01 versus the Model group; #P < 0.05 and ##P < 0.01 versus the ML385 + sh-SOX4 group
Fig. 9
Fig. 9
A schematic diagram illustrating the mechanism of SOX4 in intervertebral disc degeneration

Similar articles

Cited by

References

    1. Zhang GZ, et al. NF-κB signalling pathways in nucleus pulposus cell function and intervertebral disc degeneration. Cell Prolif. 2021;54(7):e13057. - PMC - PubMed
    1. Wang J, et al. The Regulatory Effect of MicroRNA-101-3p on Disc Degeneration by the STC1/VEGF/MAPK pathway. Oxid Med Cell Longev. 2021;2021:p1073458. - PMC - PubMed
    1. Gao S, et al. A potential target gene CD63 for different degrees of intervertebral disc degeneration. Sci Rep. 2022;12(1):957. - PMC - PubMed
    1. Liao C-R, et al. Advanced oxidation protein products increase TNF-α and IL-1β expression in chondrocytes via NADPH oxidase 4 and accelerate cartilage degeneration in osteoarthritis progression. Redox Biol. 2020;28:101306–101306. - PMC - PubMed
    1. Guo HY, et al. Emerging evidence on noncoding-RNA regulatory machinery in intervertebral disc degeneration: a narrative review. Arthritis Res Ther. 2020;22(1):270. - PMC - PubMed

MeSH terms

LinkOut - more resources