. 2025 Mar 28;197(4):kiaf133.
doi: 10.1093/plphys/kiaf133.

Nodule organogenesis in Medicago truncatula requires local stage-specific auxin biosynthesis and transport

Affiliations

Nodule organogenesis in Medicago truncatula requires local stage-specific auxin biosynthesis and transport

Ting Ting Xiao et al. Plant Physiol. .

Abstract

The importance of auxin in plant organ development, including root nodule formation, is well known. The spatiotemporal distribution pattern of auxin during nodule development has been illustrated using auxin reporter constructs. However, our understanding of how this pattern is established and maintained remains elusive. Here, we studied how the auxin gradient is associated with the spatiotemporal expression patterns of known auxin biosynthesis and transport genes at different stages of nodule development in Medicago (Medicago truncatula). In addition, we examined the Medicago PIN-FORMED10 (MtPIN10) expression pattern and polar positioning on the cell membrane during nodule primordium development to investigate auxin flux. RNA interference and the application of auxin biosynthesis inhibitors were used to demonstrate the importance of auxin biosynthesis and transport at the initial stages of nodulation. Our results show that upon rhizobium inoculation before the first cell divisions, a specific subset of Medicago YUCCA (MtYUC) and MtPIN genes, as well as Medicago LIKE AUXIN RESISTANT2 (MtLAX2), are expressed in the pericycle and contribute to the creation of an auxin maximum. Overall, we demonstrate that the dynamic spatiotemporal expression of both MtYUC and MtPIN genes results in specific auxin outputs during the different stages of nodule primordia and nodule meristem formation.


Conflict of interest statement

Conflict of interest statement. None declared.

Figures

Figure 1.
Figure 1.
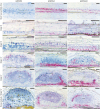
DR5::GUS expression dynamics during the different stages of nodule primordium development in Medicago (cv R108). Longitudinal plastic sections (10 mm) of spot-inoculated root segments counterstained with ruthenium red. Stage 0 (between 12 and 24 hpi), DR5 is activated in pericycle cells preceding their division. Stage I (∼24 hpi), first anticlinal pericycle divisions have occurred; the DR5::GUS signal extends to the cortical cell layers prior to their activation. Stage II (∼30 hpi), anticlinal divisions extend to cortex layers 3, 4, and 5; broad DR5 activity is detected in the entire nodule primordia. Stage III (∼48 hpi), periclinal cell divisions in cortex layers 4 and 5; DR5 is highly expressed in actively dividing cortical cells of these layers. Stage IV (∼72 hpi), periclinal cell divisions in cortex layer 3; DR5 signal extends to the third cortical cell layer. Stage V (between 72 and 96 hpi), cells derived from the C3 layer actively divide to form the future nodule meristem; DR5 activity is highest in these cells. Pericycle, endodermis, and cortex layers 4 and 5 have stopped dividing and DR5 activity is no longer detected in the center of these cell layers. Stage VI (>96 hpi), vasculature bundles are formed, nodule meristem becomes active, and DR5 activity is restricted to the nodule vasculature, nodule meristem, and infected cells directly adjacent to it. For each time point, 10 to 15 spot-inoculated root segments were sectioned. Most representative images for each stage were selected to be shown. C3-C5, cortical cell layers; en, endodermis; pc, pericycle; scale bars 75 μm.
Figure 2.
Figure 2.
The spatiotemporal expression dynamics of Medicago YUCCAs (MtYUCs) in the root susceptible zone and during nodule primordium formation. Representative images of RNA in situ hybridizations with MtYUC1, MtYUC2, or MtYUC8 probe sets on longitudinal sections of root segments and nodule primordia at different stages of development. Magenta dots are hybridization signals. C3-C5, cortical cell layers; en, endodermis; pc, pericycle; scale bars 75 μm.
Figure 3.
Figure 3.
The role of auxin biosynthesis during nodulation. A and B) The measurement of auxin (IAA) in 3 zones of roots (root tip, susceptible zone, differentiation zone) after 3 h mock or 10 µM 4-PPBo application, bars represent averages, picomole•gram FW−1 (pmol•g FW−1) ± standard error, dots show individual data points per sample, and different letters indicate significant differences with P < 0.05 according to ANOVA and Tukey post hoc test (n = 4). C and D) The effect of 24 h 10 µM PPBo application on rhizobia induced specific auxin (IAA) accumulation in the root susceptible zone, bars represent averages, pmol•g FW−1, ±standard error, dots show individual data points per sample, and different letters indicate significant differences with P < 0.05 according to ANOVA and Tukey post hoc test (n = 4). A and C) Scale bars 2 mm. C) Arrowheads indicate spot application site. E) The effect of pharmacological YUCCA inhibition by 10 µM PPBo on the nodulation efficiency of rhizobia spot applications, bars represent combined averages of 4 independent experiments each containing >10 roots, ±standard error, P < 0.05 according to Student's t-test, total n > 40. F) Number of nodules formed on 35Spro::YUC1/2/8i (35S::YUCi) transgenic roots compared to EV control roots, bars represent averages, ±standard error, dots show individual data points per transgenic root, and different letters indicate significant differences with P < 0.05 according to ANOVA and Tukey post hoc test (n > 25). G) Number of nodules formed on ENOD40pro::YUC1/2/8i (E40::YUCi) transgenic roots compared to EV control roots, bars represent averages, ±standard error, dots show individual data points per transgenic root, and different letters indicate significant differences with P < 0.05 according to ANOVA and Tukey post hoc test (n > 13).
Figure 4.
Figure 4.
The effect of pharmacological inhibition of MtYUCCA on nodule initiation. A) Percentage of Sm2011-spotted roots showing mitotic reactivation of cortical cells in the 0 µM (mock) or 10 µM 4-PPBo at 72 or 96 h post spot application. Bars represent averages, ± standard error, P < 0.05 according to Student's t-test, n = 20. B to D) Representative images of the Medicago roots after spot inoculation: B) a mock-treated +Sm2011 for 72 h, C) a 10 µM PPBo-treated +Sm2011 for 72 h, and D) a 10 µM PPBo-treated Sm2011 for 96 h. E) Average length of pericycle cells in the root susceptible zone at the application site without (−Sm2011) or with (+Sm2011) Sm2011 spot application in the absence (mock) or presence (PPBo) of 10 µM PPBo. Bars represent averages, ±standard error, dots show the length of individual pericycle cells, and different letters indicate significant differences with P < 0.05 according to ANOVA and Tukey post hoc test (n > 100). F to I) Representative images of the Medicago root susceptible zone at 24 hpi; the blue staining marks the nodule primordium initiation in pENOD11pro::GUS stable transgenic A17 line. F) A 24 h mock-treated −Sm2011, G) a 24 h mock-treated +Sm2011, H) a 24 h 10 µM PPBo-treated −Sm2011, and I) a 24 h 10 µM PPBo-treated +Sm2011. C3-C5, cortical cell layers; en, endodermis; pc, pericycle; scale bars 100 μm.
Figure 5.
Figure 5.
The spatiotemporal expression dynamics of Medicago PIN-FORMED (MtPINs) in the root susceptible zone and during nodule primordium formation. Representative images of RNA in situ hybridizations with MtPIN2, MtPIN4, or MtPIN10 probe sets on longitudinal sections of root segments and nodule primordia at different stages of development. Magenta dots are hybridization signals. In addition, for the MtPIN2 transcript detection at Stages 0 and III, 2-plex RNA in situ was used that included a Medicago NUCLEAR FACTOR Y, SUBUNIT A1 (MtNF-YA1) probe set Type 6 as a marker for nodule primordium initiation (light blue hybridization signals). C3-C5, cortical cell layers; en, endodermis; pc, pericycle; scale bars 75 μm.
Figure 6.
Figure 6.
Medicago PIN-FORMED10 (MtPIN10) localization during Medicago nodule primordium formation. Stage 0, MtPIN10-GFP is detected in pericycle cells, partially orientated toward the cortex (arrowheads). Stage I, MtPIN10-GFP is extended to the endodermis (arrowheads). Stage II, MtPIN10-GFP levels are increased in cortical cells with no apparent polarity. Stage III, MtPIN10-GFP is present in pericycle only at low levels. High MtPIN10-GFP levels are detected in dividing cortical cells with no clear polarity. MtPIN10-GFP is also detected in the root vasculature positioned on the plasma membranes toward the root tip. Stage IV, MtPIN10-GFP is positioned toward the center of the primordia in the cells located at the primordium periphery and no clear polarity is visible in the cells located at the center of the primordium. Stage V/VI, MtPIN10-GFP is hardly detectable in the central part of the primordia, at the periphery, in developing nodule vasculature cells, it is positioned toward the (future) nodule meristem. C3-C5, cortical cell layers; en, endodermis; pc, pericycle; scale bars, 75 mm.
Figure 7.
Figure 7.
The role of auxin transport during nodulation in Medicago. A) The number of nodules formed on roots of Medicago pin-formed10 (Mtpin10-1) compared to wild type (R108). Bars represent averages, ±standard error, dots show nodules per individual root, no significant differences with P > 0.05 according to Student's t-test (n > 13). B) The number of nodules formed on ENOD40pro::PIN2/4/10i (E40::PINi) transgenic roots compared to EV control roots, bars represent averages, ±standard error, dots show individual data points per transgenic root, and different letters indicate significant differences with P < 0.05 according to ANOVA and Tukey post hoc test (n > 30). C) The number of nodules formed on ENOD12pro::PIN2/4/10i (E12::PINi) transgenic roots compared to EV control roots, bars represent averages, ±standard error, dots show individual data points per transgenic root, and different letters indicate significant differences with P < 0.05 according to ANOVA and Tukey post hoc test (n > 20). D to F) Representative images of D) an EV control nodule containing a fully developed nodule meristem, E) an E12:PINi nodule with a short and underdeveloped meristem, and F) an E12:PINi nodule without a meristem. D to F) m, meristem; scale bars, 100 µm.
Figure 8.
Figure 8.
The effect of N-1-NPA application at the hypocotyl–root junction on root development and nodulation. A) Schematic representation of the experimental design including location of application of either 0 µM NPA (mock) or 50 µM NPA 24 h prior to Sm2011 spot application. B) Averaged root growth (mm•24h−1) at 8 dpi. C) The average number of lateral roots per plant. D) Percentage of spot-inoculated roots that formed a nodule on the inoculation site. Bars represent averages, ±standard error, dots show average data points per plate, and different letters indicate significant differences with P < 0.05 according to ANOVA and Tukey post hoc test (n > 20).

Similar articles

Cited by

References

    1. Allen EK, Allen ON, Newman AS. Pseudonodulation of leguminous plants induced by 2-bromo-3,5- dichlorobenzoic acid. Am J Bot. 1953:40(6):429–435. 10.1002/j.1537-2197.1953.tb06502.x - DOI
    1. Benková E, Michniewicz M, Sauer M, Teichmann T, Seifertová D, Jürgens G, Friml J. Local, efflux-dependent auxin gradients as a common module for plant organ formation. Cell. 2003:115(5):591–602. 10.1016/S0092-8674(03)00924-3 - DOI - PubMed
    1. Bennett MJ, Marchant A, Green HG, May ST, Ward SP, Millner PA, Walker AR, Schulz B, Feldmann KA. Arabidopsis AUX1 gene: a permease-like regulator of root gravitropism. Science. 1996:273(5277):948–950. 10.1126/science.273.5277.948 - DOI - PubMed
    1. Bhalerao RP, Eklöf J, Ljung K, Marchant A, Bennett M, Sandberg G. Shoot-derived auxin is essential for early lateral root emergence in Arabidopsis seedlings. Plant J Cell Mol Biol. 2002:29(3):325–332. 10.1046/j.0960-7412.2001.01217.x - DOI - PubMed
    1. Biedroń M, Banasiak A. Auxin-mediated regulation of vascular patterning in Arabidopsis thaliana leaves. Plant Cell Rep. 2018:37(9):1215–1229. 10.1007/s00299-018-2319-0 - DOI - PMC - PubMed

MeSH terms

LinkOut - more resources