. 2025 Apr 2;7(2):zcaf011.
doi: 10.1093/narcan/zcaf011. eCollection 2025 Jun.

SRSF2 overexpression induces transcription-/replication-dependent DNA double-strand breaks and interferes with DNA repair pathways to promote lung tumor progression

Affiliations

SRSF2 overexpression induces transcription-/replication-dependent DNA double-strand breaks and interferes with DNA repair pathways to promote lung tumor progression

Manal Khalife et al. NAR Cancer. .

Abstract

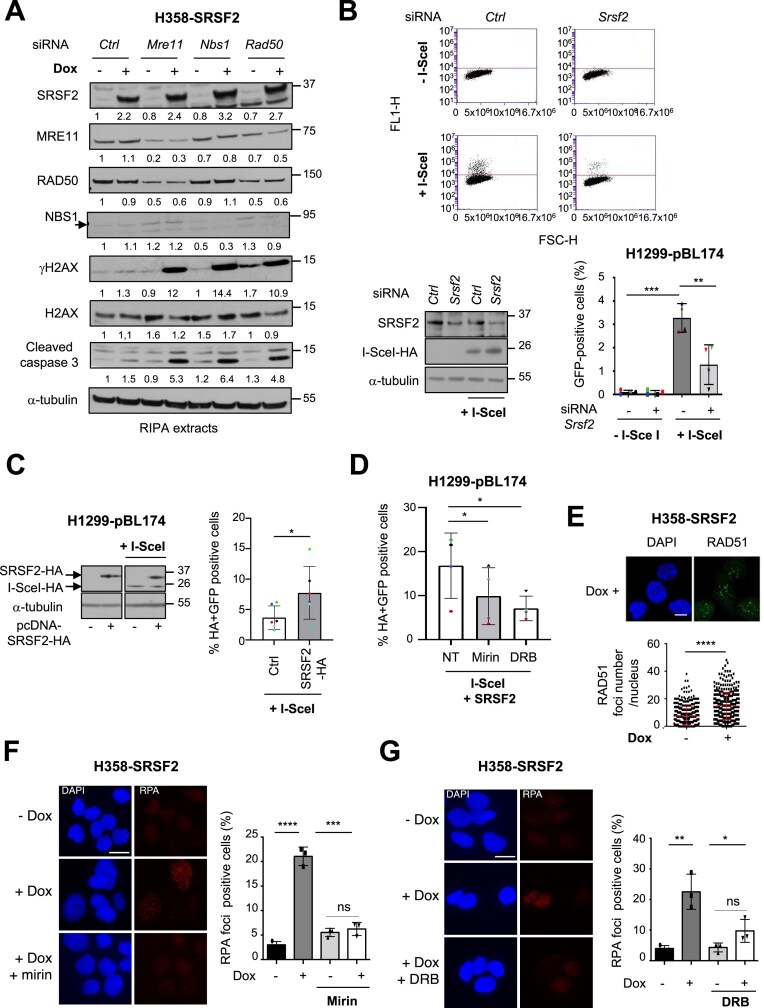
SRSF2 (serine/arginine-rich splicing factor 2) is a critical regulator of pre-messenger RNA splicing, which also plays noncanonical functions in transcription initiation and elongation. Although elevated levels of SRSF2 are associated with advanced stages of lung adenocarcinoma (LUAD), the mechanisms connecting SRSF2 to lung tumor progression remain unknown. We show that SRSF2 overexpression increases global transcription and replicative stress in LUAD cells, which correlates with the production of DNA damage, notably double-strand breaks (DSBs), likely resulting from conflicts between transcription and replication. Moreover, SRSF2 regulates DNA repair pathways by promoting homologous recombination and inhibiting nonhomologous end joining. Mechanistically, SRSF2 interacts with and enhances MRE11 (meiotic recombination 11) recruitment to chromatin, while downregulating 53BP1 messenger RNA and protein levels. Both events are likely contributing to SRSF2-mediated DNA repair process rerouting. Lastly, we show that SRSF2 and MRE11 expression is commonly elevated in LUAD and predicts poor outcome of patients. Altogether, our results identify a mechanism by which SRSF2 overexpression promotes lung cancer progression through a fine control of both DSB production and repair. Finally, we show that SRSF2 knockdown impairs late repair of ionizing radiation-induced DSBs, suggesting a more global function of SRSF2 in DSB repair by homologous recombination.


Conflict of interest statement

None declared.

Figures

Graphical Abstract
Graphical Abstract
Figure 1.
Figure 1.
SRSF2 overexpression induces DSBs. (A–D) H358-SRSF2-inducible cells were cultured (+) or not (−) with doxycycline (Dox) (1 μg/ml) for 24 h (A, C) or for the indicated times (B, D). In some experiments, H358-SRSF2 cells were cultured in presence of HU (2 or 4 mM) for 24 h. (A) Representative immunoblots of indicated proteins. n = 3. Numbers represent densitometric quantification of specific protein signal normalized to α-tubulin signal. (B) Left panel: Representative immunoblots of indicated proteins. Right panel: Densitometric quantification (mean ± SD) of the γH2AX:H2AX ratio normalized to α-tubulin signal. n = 3. Paired t-test. *P< .05, ***P< .001. (C) Left panel: Representative immunostainings of γH2AX foci. DAPI was used to counterstain the nucleus. Scale bar = 10 μm. Middle panels: Quantification of γH2AX foci number/nucleus and percentage of cells with ≥10 foci/nucleus (mean ± SD). Right panel: γH2AX foci area/nucleus (mean ± SD). n = 2 biological replicates performed in triplicate. Unpaired t-test, *P< .05, ****P< .0001. (D) Detection of DSBs by neutral comet assay. Left panel: Representative pictures of nuclei. Right panel: Quantification of neutral comet tail moments. Mean ± SD. n = 3. Unpaired t-test, ****P< .0001, *P< .05. (E) Upper panel: PLA for the detection of the closed proximity between endogenous SRSF2 and γH2AX proteins in A549 cells. mSRSF2: PLA with mouse anti-SRSF2 antibody only as a negative control. mSRSF2/rSRSF2: PLA with mouse and rabbit anti-SRSF2 antibodies as a positive control. SRSF2/γH2AX: PLA with mouse anti-SRSF2 and rabbit anti-γH2AX antibodies. Scale bar = 10 μm. Lower panel: Quantification of SRSF2 and γH2AX PLA interactions/nucleus from four (mSRSF2) or three (mSRSF2/rSRSF2; SRSF2/γH2AX) independent experiments (n = 50–60 cells/condition). Mean ± SD. Unpaired t-test, *P< .05, ns: not significant. (F) SRSF2 and γH2AX PLA interactions in A549 cells treated (+) or not (−) with 50 μM cisplatin for 24 h. Left panel: Representative images. Scale bar = 10 μm. Right panel: Quantification of the number of PLA interactions/nucleus. Mean is indicated. n = 2. Unpaired t-test. ***P< .01. In all immunoblot data, α-tubulin was used as a loading control.
Figure 2.
Figure 2.
SRSF2 overexpression induces replication-dependent DSBs. H358-SRSF2 cells were cultured with (+) or without (−) doxycycline (Dox) (1 μg/ml) for 24 h (A–F) or 48 h (E). (A) Upper panels: Representative experiment of FACS analysis of BrdU- and 7-AAD-A-positive cells. Lower panel: Quantification of the cell cycle distribution (%). Mean ± SD, n = 5. Paired t-test, **P< .01, ns: not significant. (B) H358-SRSF2 cells were sequentially labelled with CldU and IdU and DNA fibers were prepared. CldU and IdU were detected using specific antibodies. Upper panels: Representative IF images showing CldU- and IdU-positive tracks. Scale bar = 5 μm. Lower panel: Lengths (μm) of IdU-positive replication tracks in control cells (−Dox, n = 107) and SRSF2-overexpressing cells (+Dox, n = 101). Mean ± SD. Mann–Whitney t-test, ***P< .001. (C) iPOND experiment for the detection of PCNA or RPA70 protein at nascent replication forks by immunoblotting. Left panel: Representative immunoblots. Histone H3 was used as a control of equal DNA amount. No click: Negative control. Right panels: Densitometric quantification of PCNA and RPA70 normalized to input. Mean ± SD. t-test, **P< .01, ***P< .001. (D) Upper panel: Representative images of IF staining of EdU and γH2AX. DAPI was used to counterstain the nucleus. Scale bar = 10 μm. Lower panel: Quantification of γH2AX foci number/nucleus in EdU-positive or -negative cells. Mean. n = 3. Unpaired t-test, *P< .05, ***P< .001, ns: not significant. (E) Representative immunoblots of SRSF2 and γH2AX in H358-SRSF2 cells cultured with or without palbociclib (2 μM) for the indicated times. Actin was used as a loading control. Right panel: Quantification (mean ± SD) of γH2AX level. n = 4. Mann–Whitney t-test, *P< .05. (F) Left panel: Immunostaining of γH2AX in H358-SRSF2 cells cultured with or without doxycycline (1 μg/ml) for 24 h in the presence or absence (control) of PHA767491 or roscovitin (10 μM each) for 2 h before staining. DAPI was used to counterstain nuclei. Scale bar = 10 μm. Right panel: Distribution of γH2AX (mean ± SD) fluorescence intensity in each condition. n = 3. Mann–Whitney t-test, ****P< .0001, ns: not significant.
Figure 3.
Figure 3.
SRSF2-induced DSBs depend on transcription. (A–E) H358-SRSF2 cells were cultured in the presence (+Dox) or absence (−Dox) of doxycycline (1 μg/ml). (A) Click-iT RNA assay in which EU incorporation was used to detect nascent RNA synthesis. DRB (50 μM) or α-amanitin (10 μg/ml) was added for 6 h following 42-h doxycycline treatment. Left panels: Representative images of EU staining. DAPI was used to counterstain the nucleus. Scale bar = 10 μm. Right panel: Quantification of Alexa-488 intensity/nucleus. Mean ± SD. n = 3 for dox−/dox+ conditions and n = 2 for DRB/α-amanitin conditions. Mann–Whitney t-test, *P< .05, ****P< .0001, ns: not significant. (B) Click-iT RNA combined with PCNA immunostaining to detect cells in non-S phase and S phase and cultured or not with doxycycline (1 μg/ml) for 24 h. Left panels: Representative images of EU and PCNA stainings. DAPI was used to counterstain the nucleus. Right panel: Quantification of EU intensity/nucleus in nucleoplasm only (excluding nucleoli staining). Median of two independent experiments (color coded). Mann–Whitney t-test. ***P< .001, ****P< .0001, ns: not significant. (C, D) DRB was added or not for 6 h following 18-h doxycycline treatment. (C) Upper panels: Representative illustrations of γH2AX immunofluorescent staining. DAPI was used to counterstain nuclei. Scale bar = 10 μm. Lower panel: Number of γH2AX foci/nucleus. n = 3. Mann–Whitney t-test, ****P< .0001, **P< .01, ns: not significant. (D) Upper panel: Representative immunoblots of indicated proteins. α-Tubulin was used as a loading control. Lower panel: Relative γH2AX:E2AX ratio according to α-tubulin signal. Ratio obtained in non-induced conditions was arbitrarily assigned the value 1. Mean ± SD. n = 4. Paired t-test, *P< .05, ns: not significant. (E) RNA/DNA hybrid slot blot of genomic DNA ± RNAse H from H358-SRSF2 cells cultured with doxycycline (DOX) for the indicated times. Upper panel: Representative slot blot. dsDNA: Loading control. Lower panel: Values are normalized to dsDNA (means ± SEM; n = 3). Two-tailed unpaired t-test, ****P< .0001, **P< .01, ns: not significant.
Figure 4.
Figure 4.
SRSF2 interacts with and increases MRE11 recruitment to chromatin. (A, B) Representative immunoblots of indicated proteins in WCEs (A, left panel) or chromatin-enriched fractions (B) from H358-SRSF2 cells cultured in the presence (+) or absence (−) of doxycycline (1 μg/ml) for 48 h. (A) Right panel: Relative quantification of MRE11/RAD50/NBS1 protein level normalized to α-tubulin. Ratio in uninduced condition was arbitrarily assigned the value 1. Mean ± SD. n = 3. Paired t-test, *P< .05, ns: not significant. (B) A representative experiment out of three is illustrated. Numbers represent the quantification of densitometric signals according to histone H3 signal. (C) Representative immunoblots of indicated proteins in A549 or H1299 cells transfected for 72 h either with control (Ctrl) or Srsf2 siRNA in chromatin-enriched fractions (upper panels) and WCEs. Numbers represent the quantification of the densitometric signals according to histone H3 signal. n = 3. (D) Co-IP of SRSF2-HA or SRSF2(P95H)-HA with MRE11, RAD50, or NBS1 proteins in A549 cells transiently transfected for 24 h with pcDNA3.1 (Ctrl), pcDN3.1-SRSF2-HA, or pcDNA3.1-SRSF2(P95H)-HA plasmid. Input represents 10% of the immunoprecipitates. A representative experiment out of three is presented. (E) Biolayer interferometry using recombinant MRE11 as a bait and in vitro transcribed/translated pcDNA3.1 (lysate), SRSF2-HA (SRSF2), or SRSF2(P95H)-HA (SRSF2-P95H) plasmid. Upper panel: Western blotting of in vitro transcribed/translated recombinant proteins using anti-HA antibody. Ctrl: pcDNA3.1. (F) Upper panel: PLA for the detection of endogenous SRSF2 and MRE11 interaction in A549 cells. Ctrl – (negative control): PLA with mouse anti-SRSF2 antibody only. Scale bar = 10 μm. Lower panel: Quantification (mean ± SD) of the number of PLA spots/nucleus. n = 3 performed in duplicate (30–40 cells/condition). Mann–Whitney t-test, **P< .01. (G) Representative immunoblots of indicated proteins in chromatin-enriched or RIPA extracts from A549 cells transiently transfected for 24 h with the indicated constructs. n = 2. (H) Upper panels: PLA for the detection of endogenous SRSF2 and MRE11 interaction in A549 cells treated or not (NT) with DRB (50 μM) for 6 h. Ctrl – (negative control): PLA with mouse anti-SRSF2 antibody only. SRSF2/MRE11: PLA with mouse anti-SRSF2 and rabbit anti-MRE11 antibodies. Scale bar = 10 μm. Lower panel: Quantification (mean ± SD) of the number of PLA spots/nucleus. n = 3 performed in duplicate (30–40 cells/condition). Mann–Whitney t-test, **P< .01. In data, α-tubulin, and histone H3 were used as loading controls for whole cell and chromatin-enriched fractions, respectively.
Figure 5.
Figure 5.
SRSF2 promotes DNA repair by HR. (A) H358-SRSF2 cells were transfected with mismatch (ctrl), mre11, nbs1, or rad50 siRNA for 48 h and treated (+) or not (−) with doxycycline (Dox) (1 μg/ml) for additional 24 h. Representative immunoblots of indicated proteins are shown. Numbers represent densitometric quantification of specific protein signal normalized to α-tubulin signal. n = 3. (B–D) Quantification of DSB-induced HR in H1299 clones stably expressing the pDR-GFP (pBL174) plasmid. When these cells are transfected with the pBL133 plasmid encoding the I-SceI restriction enzyme, efficient recombination restores a functional GFP-coding sequence. (B) Quantification of DSB-induced HR in H1299-pBL174 cells transfected with control (Ctrl) or Srsf2 siRNAs and either pcDNA3.1 (−I-SceI) or pBL133 (+I-SceI). Upper panels: Representative FL1-H versus FSC-H dot plots of GFP-positive (FL1-H +) and –negative (FL1-H −) cells. Lower left panel: Western blotting of SRSF2 and I-SceI-HA. Lower right panel: Percentage of GFP-positive cells. n = 4. Unpaired t-test, ***P< .001, **P< .01. (C) Quantification of DSB-induced HR in H1299-pBL174 cells co-transfected with pBL133 (+I-SceI) and either pcDNA3.1 (Ctrl) or pcDNA3.1-SRSF2-HA. Left panel: Western blotting of HA-tagged SRSF2 and I-SceI proteins. Right panel: Percentage of HA-/GFP-positive transfected cells determined by flow cytometry. n = 6. Paired t-test, *P< .05. (D) Quantification of DSB-induced HR in H1299-pBL174 cells co-transfected with pBL133 (+I-SceI) together with pcDNA3.1-SRSF2-HA (SRSF2) and treated or not (NT) with mirin (40 μM) or DRB (50 μM). Percentage of HA-/GFP-positive transfected cells was determined by flow cytometry. n = 4. Paired t-test, *P< .05. (E) H358-SRSF2 clones were cultured with (+) or without (−) doxycycline (Dox) (1 μg/ml) for 24 h. Upper panels: Representative images of RAD51 immunostaining. DAPI was used to counterstain nuclei. Scale bar = 10 μm. Lower panel: Quantification of the number of RAD51 foci/nucleus. Mean ± SD. n = 3. Mann–Whitney t-test, ****P< .0001. (F, G) H358-SRSF2 cells were cultured with (+) or without (−) doxycycline (Dox) (1 μg/ml) for 48 h in the presence or absence of mirin (40 μM, 24 h co-treatment, panel F) or DRB (50 μM, 6 h co-treatment, panel G). Left panels: Representative images of RPA IF. Scale bar = 20 μm. Right panels: Quantification (mean ± SD) of RPA-positive cells (%) in each condition. n = 3. Unpaired t-test, ****P< .0001, ***P <. 001, **P< .01, *P< .05, ns: not significant. All data, α-Tubulin was used as a loading control.
Figure 6.
Figure 6.
SRSF2 inhibits Nonhomologous End Joining (c-NHEJ) which correlates with down-regulation of 53BP1 protein level. (A, B) A549-pBL230 clones were transfected with control (Ctrl) or Srsf2 siRNAs for 24 h and then transfected with pcDNA3.1 or pBL133 plasmid for 4 additional days. (A) Representative dot plots of CD4-positive transfected cells in two different clones using flow cytometry. (B) Percentage of CD4-positive recombinant cells in control or Srsf2 knockdown cells. Mean ± SD. n = 9. Mann–Whitney t-test, ***P < .001. (C) A549 or H1299 cells were transfected with Ctrl or Srsf2 siRNA for 72 h. Representative immunoblots of indicated proteins in WCEs. n = 3. α-Tubulin or Ku80 was used as a loading control. Numbers represent densitometric quantification of specific protein signal normalized to α-tubulin or Ku80 signal. (D) Left panel: Representative immunoblots of indicated proteins in H358-SRSF2 cells cultured with or without doxycycline (1 μg/ml) for indicated times. α-Tubulin was used as a loading control. Right panel: Relative 53BP1/α-tubulin ratios are represented in comparison to the untreated condition which was arbitrarily assigned to 1. n = 3. Unpaired t-test, **P< .01. (E-H) H358-SRSF2-inducible cells were cultured or not for 24 h in the presence or absence of doxycycline (1 μg/ml). In some experiments, mirin (40 μM) was added. (E) Upper panel: Representative images of 53BP1 immunostaining. Scale bar = 10 μm. Lower panel: Quantification of 53BP1 foci/nucleus with values obtained in none-induced cells being arbitrarily assigned to 100%. Mean ± SD. n = 3. Unpaired t-test, **P< .01. (F) 53BP1 mRNA level (fold change ± SD compared with control). n = 4. Unpaired t-test, *P< .05. (G, H) H358-SRSF2 cells were cultured with (+) or without (−) doxycycline (Dox) (1 μg/ml) for 24 h and co-treated or not with mirin (40 μM) as indicated. (G) Left panels: Representative images of SRSF2 and 53BP1 immunostainings. DAPI was used to counterstain the nucleus. Scale bar = 10 μm. Right panel: Quantification (mean ± SD) of 53BP1-positive cells (%) defined as cells with >5 foci/nucleus. n = 3 (50–60 nuclei/condition/experiment). Unpaired t-test, *p< .05, **p< .01, ***p< .001. (H) Left panels: Representative immunoblots of indicated proteins. α-Tubulin was used as a loading control. n = 3. Right panel: Relative level of 53BP1 protein according to α-tubulin signal. Values obtained in noninduced conditions were arbitrarily assigned to 1. Unpaired t-test, **P< .01, ns: not significant.
Figure 7.
Figure 7.
High level of both Srsf2 and Mre11 mRNAs correlates with poor prognosis in stage I LUAD patients. (A) Left panels: Representative MRE11 immunostainings from paraffin-embedded sections of LUAD patients. Immunoscores are indicated for each case. Right panel: Distribution of IHC scores of MRE11 and SRSF2 in NSCLC patients. (B) Spearman correlation between SRSF2 and MRE11 immunoscores. (C) Normalized Srsf2 (upper panel) and Mre11 (lower panel) mRNA levels [log2(FPKM-UQ + 1)] in LUAD patients and matched normal lung tissues retrieved from the TCGA (n = 524 for primary LUAD tumors and n = 59 for matched normal tissues) using UCSC Xena platform. P-values were calculated using an unpaired t-test. (D) Relationship between normalized Srsf2 and Mre11 (upper panel) or 53BP1 (lower panel) mRNA levels in normal lung tissues and LUAD patients. Spearman correlation. (E) Kaplan–Meier univariate survival analysis of early stage (pTNM I) LUAD patients from TCGA displaying high level of Srsf2 mRNA (up to median, n = 134) and either high (>75th percentile, 4th quartile, n = 45) or low/medium (<75th percentile, 1st–3rd quartiles, n = 89) Mre11 mRNA levels. Log-rank test.
Figure 8.
Figure 8.
SRSF2 regulates DSB repair in response to IR in lung cancer cells. (A) H358 and A549 cells were irradiated at indicated doses. SRSF2 protein level was assessed by immunoblot in whole protein extracts 24 h after irradiation. Upper panels: Representative SRSF2 immunoblots. α-Tubulin was used as a loading control. Lower panels: SRSF2 relative level according to α-tubulin densitometric signal. Values obtained in nonirradiated cells were arbitrarily fixed to 1. n = 4. Anova one-way, ns: not significant. (B, C) A549 and H1299 cells were transfected with Ctrl siRNA or siRNA against SRSF2 for 72 h and submitted or not to 3 Gy irradiation. γH2AX nuclear foci were quantified at indicated times after recovery. Upper panels: SRSF2 representative immunoblots for knockdown efficiency. Middle panels: Representative immunostainings of γH2AX foci at indicated times after recovery. DAPI was used to counterstain the nucleus. Lower panels: Quantification of the number of γH2AX foci/nucleus in cells transfected with either Ctrl or Srsf2 siRNA at indicated times. Median is indicated. n = 3. Unpaired t-test, ****P< .0001.
Figure 9.
Figure 9.
Model for SRSF2-induced lung tumor progression. High level of SRSF2 induces a global transcriptional increase in LUAD cells. This leads to enhanced replicative stress and DNA DSBs, likely as a result of conflicts between transcription and replication machineries. SRSF2 also controls DSB repair. SRSF2 inhibits c-NHEJ that correlates with a decrease of 53BP1 mRNA and protein levels. Conversely, a cross talk between SRSF2 and MRE11 proteins, which are both commonly increased in LUAD patients and are found in closed proximity in LUAD cells, increases DSB repair by HR. We propose that a high level of SRSF2, along with MRE11, tightly controls the balance between DSB production and repair helping to maintain genome instability below a threshold compatible with tumor cell survival, and thus, contributing to lung tumor progression.

References

    1. Pan Q, Shai O, Lee LJ et al. . Deep surveying of alternative splicing complexity in the human transcriptome by high-throughput sequencing. Nat Genet. 2008; 40:1413–5.10.1038/ng.259. - DOI - PubMed
    1. Bradley RK, Anczukow O RNA splicing dysregulation and the hallmarks of cancer. Nat Rev Cancer. 2023; 23:135–55.10.1038/s41568-022-00541-7. - DOI - PMC - PubMed
    1. Anczukow O, Allain FH, Angarola BL et al. . Steering research on mRNA splicing in cancer towards clinical translation. Nat Rev Cancer. 2024; 24:887–905.10.1038/s41568-024-00750-2. - DOI - PMC - PubMed
    1. Zhang Q, Ai Y, Abdel-Wahab O Molecular impact of mutations in RNA splicing factors in cancer. Mol Cell. 2024; 84:3667–80.10.1016/j.molcel.2024.07.019. - DOI - PMC - PubMed
    1. Urbanski LM, Leclair N, Anczukow O Alternative-splicing defects in cancer: splicing regulators and their downstream targets, guiding the way to novel cancer therapeutics. WIREs RNA. 2018; 9:e1476.10.1002/wrna.1476. - DOI - PMC - PubMed

MeSH terms

Substances