. 2025 Mar 20:16:1477929.
doi: 10.3389/fimmu.2025.1477929. eCollection 2025.

Hexokinase2-engineered T cells display increased anti-tumor function

Affiliations

Hexokinase2-engineered T cells display increased anti-tumor function

Raphaëlle Toledano Zur et al. Front Immunol. .

Abstract

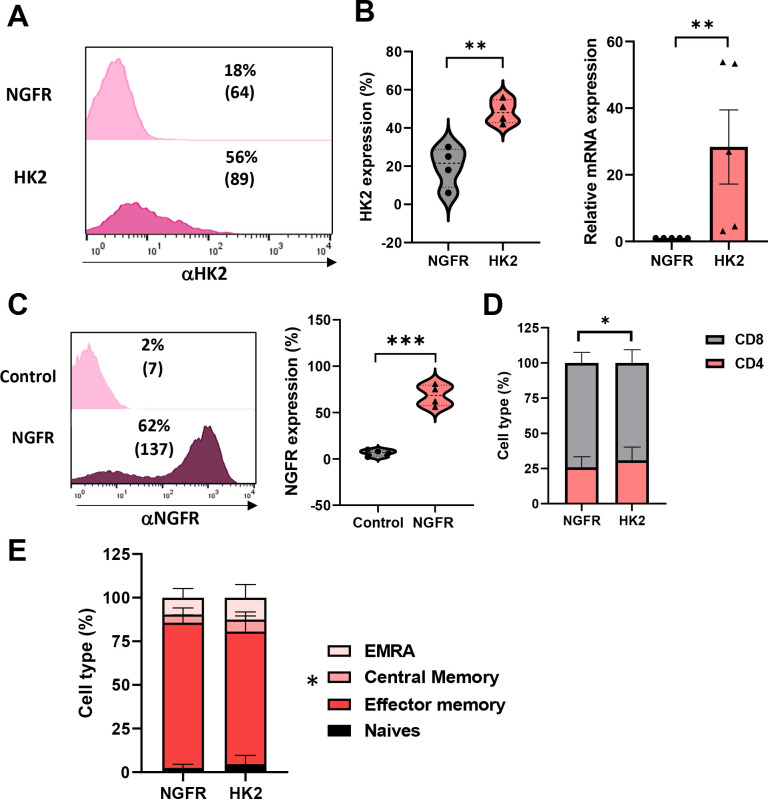
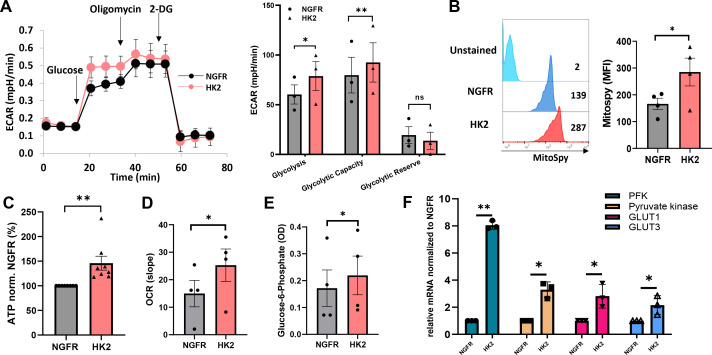
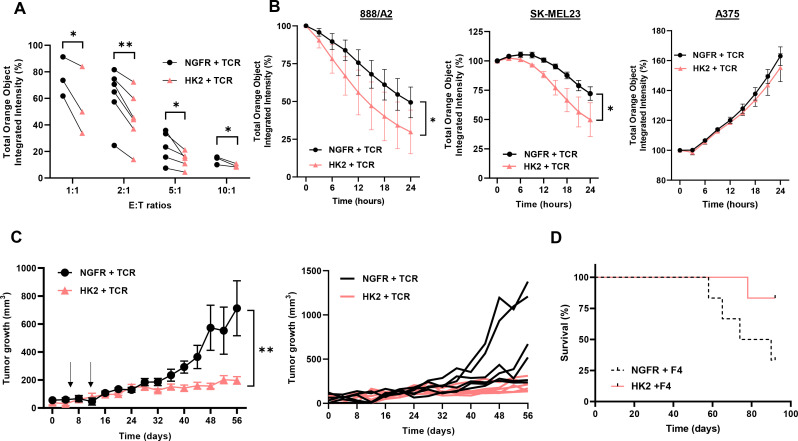
Background: T cells face significant metabolic challenges in the tumor microenvironment (TME), where cancer cells monopolize critical nutrients like glucose and amino acids. This metabolic competition supports tumor growth while impairing T-cell anti-tumor responses, partly by reducing glycolytic function. Hexokinase 2 (HK2), a key enzyme in glycolysis, plays a pivotal role in maintaining T-cell functionality.

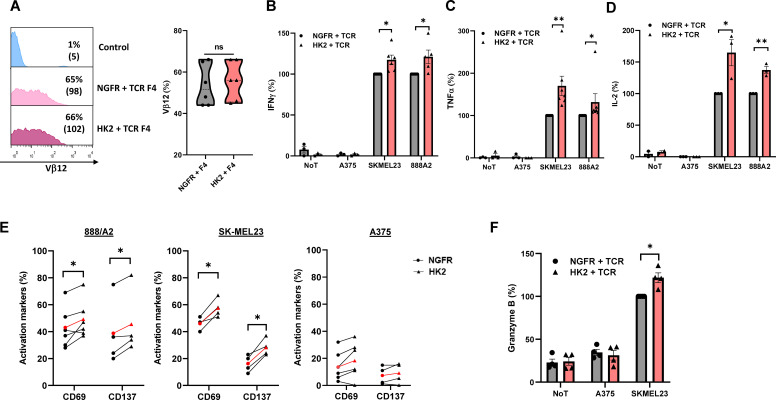
Methods: To enhance T-cell function, primary human T cells were genetically engineered to overexpress HK2 alongside a tumor-specific receptor. These engineered T cells were tested in vitro and in vivo to evaluate their metabolic and therapeutic efficacy.

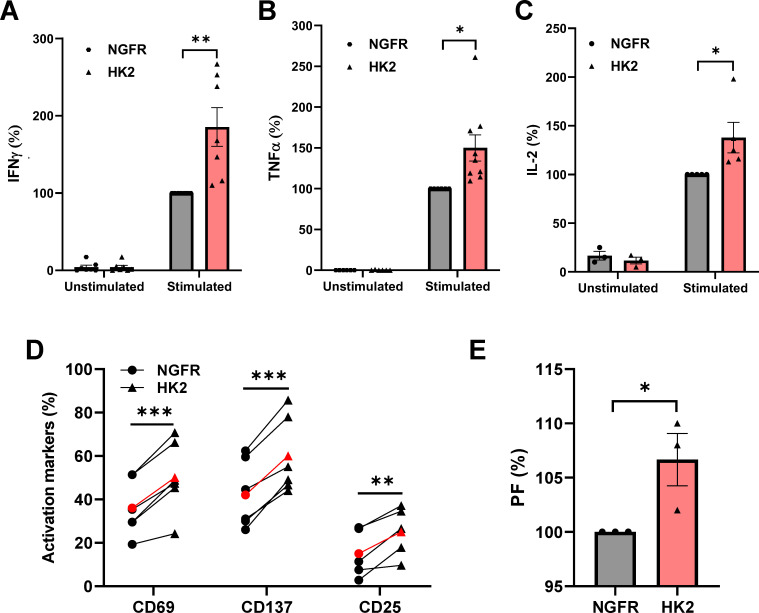
Results: HK2-engineered T cells exhibited increased glycolytic capacity, leading to enhanced cytokine secretion, activation marker expression, and metabolic activity compared to controls. In vivo studies using a human tumor xenograft model demonstrated the superior therapeutic efficacy of HK2-engineered T cells, including delayed tumor growth and improved survival.

Conclusion: HK2 overexpression improves T-cell metabolic fitness and functionality in hostile TMEs, offering a promising foundation for the development of next-generation immunotherapies targeting T-cell metabolism.

Keywords: T-cells; TCR; cellular immunotherapy; hexokinase 2; immunometabolism.


Conflict of interest statement

CC and RZ are inventors on a submitted PCT Application No. PCT/IL2023/050248 related to this study. The remaining authors declare that the research was conducted in the absence of any commercial or financial relationships that could be construed as a potential conflict of interest. The author(s) declared that they were an editorial board member of Frontiers, at the time of submission. This had no impact on the peer review process and the final decision.

Figures

Figure 1
Figure 1
Human T cells can be engineered to express high levels of HK2. (A–C) Human PBLs were transduced with a retroviral vector encoding HK2 or NGFR. 72 h after transduction, transgene expression was measured by flow cytometry using antibodies specific for HK2 or NGFR. The left panel is a representative result, and the right panel presents the mean+SEM of n=4 (C) RNA from HK2 transduced T cells was extracted and reverse-transcribed. HK2 transcript expression was measured by qPCR and normalized to control. These results are presented as mean+SEM of n=5. (D) The CD4/CD8 ratio of transduced cells was determined by flow cytometry. These results are representative of n=8 independent experiments. (E) The memory phenotype of transduced cells was determined by flow cytometry based on CD45RO and CCR7 expression. EM - Effector memory (CD45RO+/CCR7-), CM - central memory (CD45RO+/CCR7+), EMRA - terminally differentiated effector memory cells re-expressing CD45RA (CD45RO-/CCR7-) or naïve cell population (CD45RO+/CCR7+). These results are presented as the mean+SEM of n=6. ∗: p < 0.05, ∗∗: p<0.01, ∗∗∗: p < 0.001.
Figure 2
Figure 2
HK2 overexpression can improve glycolysis and metabolic fitness. (A) Evaluation of T cell metabolic function using the Seahorse extracellular flux analyzer. Extracellular acidification rate (indicated as ECAR) was measured. The left panel shows a representative experiment and the right panel depicts the mean+SEM of n=3 (**: p<0.01, *: p<0.05 and ns – not significant). (B) Mitochondrial mass was measured by FC, gated on NGFR+ population using MitoSpy green. The left panel is a representative a result and the right panel is the mean + SEM of n=4 independent experiments with 4 different donors. The difference between HK2 and NGFR (control) was found statistically significant as indicated (*p<0.05, calculated using a Student’s paired t-test). (C) ATP was measured using the CellTiter-Glo® 2.0 Cell Viability Assay reagent that was added to 1x10⁵ T cells in a 96-well plate. The ATP expression levels were normalized to NGFR. These results are representative of n=8. (D) Extracellular Oxygen Consumption Assay was measured kinetically for 2 hours by time-resolved fluorescence (TR-F). The mean+SEM of the slope is shown. (E) Glucose-6-Phosphate was measured by colorimetry at 450 nm. The mean + SEM of the optical density (OD) is shown. (A–E) These results are performed with at least 3 different donors and the difference between HK2 and NGFR (control) was found statistically significant as indicated (*p<0.05, calculated using a Student’s paired t-test). (F) RNA from HK2 or NGFR (control) transduced T cells was extracted and reverse-transcribed. PFK, Pyruvate kinase, GLUT1 and GLUT3 transcript expression was measured by qPCR and normalized to control. These results are presented as mean+SEM of n=3.
Figure 3
Figure 3
HK2 forced expression enhances cytokine secretion and upregulates activation markers in engineered-T cells. (A–C) Primary human T cells were transduced with either NGFR vector (control) or HK2 and were stimulated with plate-bound OKT3. IFNγ (A), TNFα (B) and IL-2 (C) were secreted in the culture supernatant and measured by ELISA. These results represent the mean+SEM and normalized to control NGFR (with an average secretion of 3.1 ng/mL, 2.6 ng/mL and 0.95 ng/mL for IFNγ, TNFα and IL-2 respectively). (D) CD69, CD137, and CD25 expression was measured by flow cytometry, gated on the CD8+ population. The mean of n>5 is represented by a red line. (E) T cells were labeled with CFSE and stimulated with an anti-CD3 antibody for 4 days. The PF (proliferation factor = MFI day 10/MFI day 14 normalized to NGFR (control) is shown. These results were obtained in n=3 experiments. (A–E) These results are performed with at least 3 different donors and the difference between HK2 and NGFR (control) was found statistically significant as indicated (*p<0.05, calculated using a Student’s paired t-test). ∗: p < 0.05, ∗∗: p<0.01, ∗∗∗: p < 0.001.
Figure 4
Figure 4
HK2 can improve the anti-tumor function of TCR T cells. (A) Human PBLs were transduced with a MART1-specific TCR. After 24 h, the cultures were split and transduced with either HK2 or NGFR. 72 h after transduction, TCR F4 expression was measured by FC using a specific antibody (Vβ12). The left panel is a representative result, and the right panel presents the mean+SEM of n=6. (B–D) Following overnight co-culture with melanoma cell lines, IFNγ (B), TNFα (C) and IL-2 (D) secreted in the culture supernatant were measured by ELISA. These results are the mean+SEM of n>3 and normalized to control (NGFR+TCR with reference concentrations ranging between 5.9-11 ng/ml for IFNγ, 6.6-17.4 ng/ml for TNFα, and 0.23-0.5 ng/ml for IL2). (E) CD69 and CD137 expression levels were measured by FC, gated on the CD8+ population following overnight co-culture with melanoma cell lines. These results were obtained in n>3 independent experiments. (F) Following an overnight co-culture with SKMEL23 cell line, granzyme B secreted in the culture supernatant were measured by ELISA. These results were obtained in n=4 (A–F) These results are performed with at least 3 different donors and the difference between HK2 and NGFR (control) was found statistically significant as indicated (*p<0.05, calculated using a Student’s paired t-test). ∗∗: p<0.01, ns: not significant.
Figure 5
Figure 5
HK2 improves T cell anti-tumor function in vitro and in vivo. (A) NGFR + TCR and HK2 + TCR engineered T-cells were co-cultured with tumor cells (888A2) at different E:T (Effector : Target) ratio and incubated in an Incucyte apparatus. mCherry+ live cell population was followed over time and normalized to time=0. These results are the mean+SEM of n>3 independent experiments performed with at least 3 different donors. The difference between NGFR vector (control) and HK2 was found statistically significant as indicated (*p<0.05 and **p<0.01 calculated using a Student’s paired t-test). (B) Representative experiments are shown in co-culture, with 888A2, SKMEL23 and A375 (negative control) melanoma cell lines at 1:1 E:T ratio. (C) NSG mice were inoculated with 2x10⁶ 888A2 tumor cells. Then, 5x10⁶ of NGFR + TCR or HK2 + TCR-engineered T cells were IV injected in mice, one week and two weeks after tumor establishment (indicated by arrows). Tumor growth was measured in a blinded fashion using a caliper. Curves for the tumor growth average (n=6) and spider plots of the tumor volumes are shown. The difference between NGFR vector (control) and HK2 was found statistically significant as indicated (calculated using a Student’s paired t-test). (D) The survival of the respective groups is represented by a Kaplan-Meier curve (p=0.07, calculated using a Log-Rank test).

Similar articles

References

    1. Ribas A, Wolchok JD. Cancer immunotherapy using checkpoint blockade. Science. (2018) 359:1350–5. doi: 10.1126/science.aar4060 - DOI - PMC - PubMed
    1. Finck AV, Blanchard T, Roselle CP, Golinelli G, June CH. Engineered cellular immunotherapies in cancer and beyond. Nat Med. (2022) 28:678–89. doi: 10.1038/s41591-022-01765-8 - DOI - PMC - PubMed
    1. Zur RT, Adler G, Shamalov K, Tal Y, Ankri C, Cohen CJ. Adoptive T-cell immunotherapy: perfecting self-defenses. Exp Suppl. (2022) 113:253–94. doi: 10.1007/978-3-030-91311-3_9 - DOI - PubMed
    1. Sterner RC, Sterner RM. CAR-T cell therapy: current limitations and potential strategies. Blood Cancer J. (2021) 11:69. doi: 10.1038/s41408-021-00459-7 - DOI - PMC - PubMed
    1. Baker DJ, Arany Z, Baur JA, Epstein JA, June CH. CAR T therapy beyond cancer: the evolution of a living drug. Nature. (2023) 619:707–15. doi: 10.1038/s41586-023-06243-w - DOI - PubMed

MeSH terms

LinkOut - more resources