. 2025 Mar 20:16:1461041.
doi: 10.3389/fimmu.2025.1461041. eCollection 2025.

Autoantibodies to apolipoprotein A-I in hepatitis C virus infection: a role in disease progression?

Affiliations

Autoantibodies to apolipoprotein A-I in hepatitis C virus infection: a role in disease progression?

Simon H Bridge et al. Front Immunol. .

Abstract

Background: Chronic HCV (CHC) infection is associated with autoimmunity. IgG autoantibodies to apolipoprotein A-I (AAA-I) predict all-cause mortality. We evaluated AAA-I in CHC patients and in those who were not viraemic, either because of spontaneous resolution (SR) of infection or HCV clearance following sustained virological response (SVR) after interferon therapy. We limited the study to HCV genotypes 1 and 3, the dominant HCV genotypes circulating in the UK.

Methods: Serum samples from 126 CHC patients and 114 nonviraemic individuals (25 SR and 89 SVR) were assayed for AAA-I and lipoproteins. AUC was calculated for AAA-I and HDL-related parameters and used to predict cirrhosis. Fibronectin (FN) and FN-mRNA were measured in human hepatic stellate cells (LX-2) in the presence or absence of AAA-I.

Results: AAA-I was found in 47% of patients with CHC, 37% of SVR patients, and 16% of SR individuals (CHC vs. SR, p = 0.004). AAA-I levels in CHC patients were higher in those with cirrhosis (p = 0.0003). The AUC for AAA-I, apoA-I, and HDL-C in predicting cirrhosis was 0.72 (p < 0.001), 0.65 (p = 0.01), and 0.64 (p = 0.02). After 48 h in the presence of AAA-I, LX-2 cells showed an 80% increase in FN-mRNA compared to the LX-2/IgG control (p = 0.028) and higher levels of FN (p = 0.0016).

Conclusions: CHC is often associated with AAA-I, and these can persist after SVR. AAA-I is a robust predictor of cirrhosis in CHC infection. LX-2 cells exposed to AAA-I showed increased FN. Further studies are warranted to define the role of AAA-I in promoting not only viral persistence but also fibrosis.

Keywords: apolipoprotein A-I; autoantibodies; cirrhosis; disease progression; hepatitis C virus (HCV).


Conflict of interest statement

The authors declare that the research was conducted in the absence of any commercial or financial relationships that could be construed as a potential conflict of interest. The author(s) declared that they were an editorial board member of Frontiers, at the time of submission. This had no impact on the peer review process and the final decision.

Figures
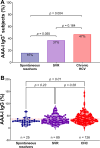
Figure 1
Figure 1
Comparison of AAA-I responses in the study cohort. (A) Percentage of AAA-I+ subjects in each group: 4/25 (16%) in the SR group, 33/89 (37%) in the SVR group, and 59/126 (47%) in the CHC group. For proportional comparisons, p values were calculated using Fisher’s exact tests. (B) Violin plots showing AAA-I levels in SR, CHC, and SVR groups. For statistical differences, p values were calculated using a Kruskal–Wallis ANOVA test with Dunn’s correction for multiple comparisons.
Figure 2
Figure 2
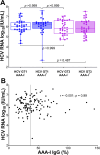
The relationship between AAA-I and HCV RNA viral loads. (A) Boxplots showing the impact of AAA-I on HCV viral loads in HCV GT1 and GT3 infections, with significance determined by the Kruskal–Wallis ANOVA test with Dunn’s correction for multiple comparisons. (B) Scatterplot showing the strength and significance of the association between HCV viral load and AAA-I levels; r and p-values were calculated using a Spearman rank correlation test. The dashed line at 37% indicates AAA-I positivity.
Figure 3
Figure 3
AAA-I levels in patients with cirrhosis compared to those without cirrhosis. Violin plots show the difference between AAA-I levels in individuals without cirrhosis (n = 199) and those with cirrhosis (n = 41), with proportions of 30.3% vs. 46.0%. Statistical significance was determined using the Mann–Whitney U test (p < 0.001).
Figure 4
Figure 4
Comparison of AAA-I, AAA-I/ApoA-I ratio, and HDL-related parameters in chronic HCV patients with and without cirrhosis. (A) AAA-I (%), 31.46% vs. 48.15%; Mann–Whitney U test, p = 0.0003. (B) AAA-I/ApoA-I ratio, 20.2 vs. 35.2; Mann–Whitney U test, p = 0.0001. (C) Apolipoprotein A-I, 1.53 g/L vs. 1.36 g/L; unpaired t-test, p = 0.0115. (D) HDL-C, 1.20 mmol/L vs. 1.00 mmol/L; Mann–Whitney U test, p = 0.0205.
Figure 5
Figure 5
Receiver operating characteristic curve analysis evaluating the predictive robustness of AAA-I, AAA-I/ApoA-I ratio, and HDL-related parameters for cirrhosis in chronic HCV patients. (A) AAA-I; AUC: 0.716, p < 0.001. (B) AAA-I/ApoA-I ratio; AUC: 0.730, p < 0.001. (C) Apolipoprotein A-I; AUC: 0.652, p = 0.01. (D) HDL-C; AUC: 0.640, p = 0.02.
Figure 6
Figure 6
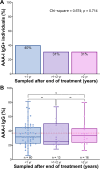
Durability of the AAA-I response following interferon-based treatment. Samples were stratified into three groups after interferon-based treatment: (1) < 1 year after treatment (median sampling time was 0.5 years), (2) > 1 but < 2 years after treatment (median sampling time was 1.1 years after treatment) and (3) > 2 years after treatment (median sampling time was 3.9 years after treatment). (A) Comparison of AAA-I seropositive individuals at each sampling time point following IFN therapy cessation. Significance was determined using a Chi-square test; 40% vs. 31% vs. 31%, p = 0.714. (B) Comparison of AAA-I levels at each sampling time point following antiviral therapy. Significance was assessed using the Kruskal–Wallis ANOVA test with Dunn’s correction for multiple comparisons. No significant differences were observed.
Figure 7
Figure 7
Evaluating the impact of AAA-I on LX-2 cells. (A) Fibronectin mRNA quantification in cells cultured in the presence/absence of AAA-I. (B) After 48 and 72 h, LX-2 cells cultured in the presence of AAA-I showed significantly increased concentrations of fibronectin compared to LX-2 cells alone and the LX-2/IgG control.
Figure 8
Figure 8
A schematic showing the diversity of HCV lipoviral particles and subviral particles found in the blood of patients with chronic HCV infection. HCV particles in the blood of infected patients are heterogeneous in size, density, and infectivity. There are more than a thousand-fold more nucleocapsid-free subviral particles containing apolipoprotein A-I than infectious apoA-I-containing lipoviral particles. Exposure to these viral and subviral particles may lead to autoreactivity.

References

    1. Sharma C, Bayry J. High risk of autoimmune diseases after COVID-19. Nat Rev Rheumatol. (2023) 19:399–400. doi: 10.1038/s41584-023-00964-y - DOI - PMC - PubMed
    1. Manns MP, Rambusch EG. Autoimmunity and extrahepatic manifestations in hepatitis C virus infection. J Hepatol. (1999) 31 Suppl 1:39–42. doi: 10.1016/s0168-8278(99)80372-9 - DOI - PubMed
    1. Bartenschlager R, Baumert TF, Bukh J, Houghton M, Lemon SM, Lindenbach BD, et al. . Critical challenges and emerging opportunities in hepatitis C virus research in an era of potent antiviral therapy: Considerations for scientists and funding agencies. Virus Res. (2018) 248:53–62. doi: 10.1016/j.virusres.2018.02.016 - DOI - PubMed
    1. Dhiman RK, Premkumar M. Hepatitis C virus elimination by 2030: conquering mount improbable. Clin Liver Dis (Hoboken). (2020) 16:254–61. doi: 10.1002/cld.978 - DOI - PMC - PubMed
    1. Hamill V, Wong S, Benselin J, Krajden M, Hayes PC, Mutimer D, et al. . Mortality rates among patients successfully treated for hepatitis C in the era of interferon-free antivirals: population based cohort study. BMJ. (2023) 382:e074001. doi: 10.1136/bmj-2022-074001 - DOI - PMC - PubMed

LinkOut - more resources