

Fluorescence based live cell imaging identifies exon 14 skipped hepatocyte growth factor receptor (MET) degraders
- PMID: 40182503
- PMCID: PMC11967169
- DOI: 10.1039/d5ra01441g
Fluorescence based live cell imaging identifies exon 14 skipped hepatocyte growth factor receptor (MET) degraders
Abstract
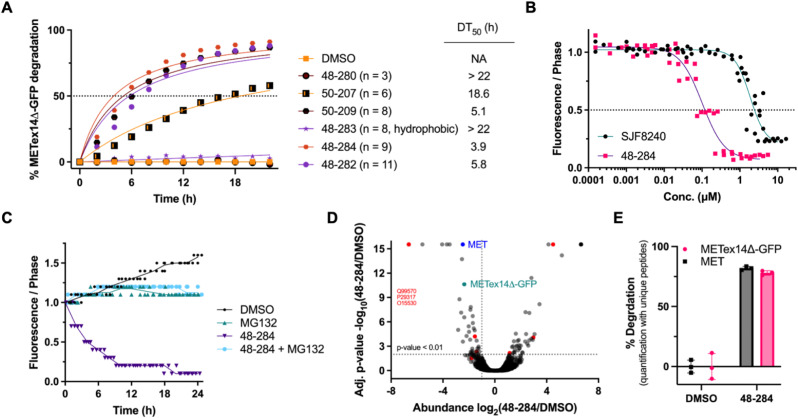
Despite ongoing efforts to employ structure-based methods to discover targeted protein degraders (TPD), the prevailing strategy continues to be the synthesis of a focused set of heterobifunctional compounds and screening them for target protein degradation. Here we used a fluorescence based live cell imaging screen to identify degraders that target exon 14 skipped hepatocyte growth factor receptor (MET). MET is a known oncogenic driver. MET exon 14 skipping mutations (METex14Δ) are found in lung cancers and result in the loss of a degron that is required for E3-ligase recognition and subsequent ubiquitination, prolonging the half-life and oncogenicity of MET. Since proteolysis targeting chimeras (PROTACs) are heterobifunctional molecules that promote target degradation by the proteosome, we sought to restore degradation of MET lost with METex14Δ using a MET-targeting PROTAC. We generated a library of sixty PROTACs of which 37 used the MET inhibitor capmatinib as the protein of interest targeting ligand. We screened this PROTAC library for targeted degradation of METex14Δ-GFP using live cell imaging. We benchmarked the MET-targeting PROTACs to that of a previously reported MET-targeting PROTAC, SJF8240. Curve fitting live cell imaging data affords determination of time required to degrade 50% of the target protein (DT50), which was used in determining structure activity relationships. A promising candidate, 48-284, identified from the screen, exhibited classic PROTAC characteristics, was >15-fold more potent than SJF8240, had fewer off targets compared to SJF8240, and degraded MET in multiple cell lines.
This journal is © The Royal Society of Chemistry.
Conflict of interest statement
J. R. M., L. Y., M. B., A. N., and A. S. M. are listed as inventors on PCT Int. Appl. (2023), WO2023249994A1.
Figures


Update of
-
Fluorescence based live cell imaging identifies exon 14 skipped hepatocyte growth factor receptor (MET) degraders.bioRxiv [Preprint]. 2024 Nov 25:2024.11.22.624922. doi: 10.1101/2024.11.22.624922. bioRxiv. 2024. Update in: RSC Adv. 2025 Apr 3;15(13):10419-10425. doi: 10.1039/d5ra01441g. PMID: 39651287 Free PMC article. Updated. Preprint.
Similar articles
-
Fluorescence based live cell imaging identifies exon 14 skipped hepatocyte growth factor receptor (MET) degraders.bioRxiv [Preprint]. 2024 Nov 25:2024.11.22.624922. doi: 10.1101/2024.11.22.624922. bioRxiv. 2024. Update in: RSC Adv. 2025 Apr 3;15(13):10419-10425. doi: 10.1039/d5ra01441g. PMID: 39651287 Free PMC article. Updated. Preprint.
-
PROteolysis TArgeting Chimera (PROTAC) Estrogen Receptor Degraders for Treatment of Estrogen Receptor-Positive Advanced Breast Cancer.Target Oncol. 2025 May;20(3):431-444. doi: 10.1007/s11523-025-01137-5. Epub 2025 May 6. Target Oncol. 2025. PMID: 40327300 Free PMC article. Review.
-
Interventions for promoting habitual exercise in people living with and beyond cancer.Cochrane Database Syst Rev. 2018 Sep 19;9(9):CD010192. doi: 10.1002/14651858.CD010192.pub3. Cochrane Database Syst Rev. 2018. PMID: 30229557 Free PMC article.
-
Nivolumab for adults with Hodgkin's lymphoma (a rapid review using the software RobotReviewer).Cochrane Database Syst Rev. 2018 Jul 12;7(7):CD012556. doi: 10.1002/14651858.CD012556.pub2. Cochrane Database Syst Rev. 2018. PMID: 30001476 Free PMC article.
-
A New Measure of Quantified Social Health Is Associated With Levels of Discomfort, Capability, and Mental and General Health Among Patients Seeking Musculoskeletal Specialty Care.Clin Orthop Relat Res. 2025 Apr 1;483(4):647-663. doi: 10.1097/CORR.0000000000003394. Epub 2025 Feb 5. Clin Orthop Relat Res. 2025. PMID: 39915110
References
-
- Paik P. K. Felip E. Veillon R. Sakai H. Cortot A. B. Garassino M. C. Mazieres J. Viteri S. Senellart H. Van Meerbeeck J. Raskin J. Reinmuth N. Conte P. Kowalski D. Cho B. C. Patel J. D. Horn L. Griesinger F. Han J. Y. Kim Y. C. Chang G. C. Tsai C. L. Yang J. C. Chen Y. M. Smit E. F. van der Wekken A. J. Kato T. Juraeva D. Stroh C. Bruns R. Straub J. Johne A. Scheele J. Heymach J. V. Le X. N. Engl. J. Med. 2020;383:931–943. - PMC - PubMed
-
- Wolf J. Seto T. Han J. Y. Reguart N. Garon E. B. Groen H. J. M. Tan D. S. W. Hida T. de Jonge M. Orlov S. V. Smit E. F. Souquet P. J. Vansteenkiste J. Hochmair M. Felip E. Nishio M. Thomas M. Ohashi K. Toyozawa R. Overbeck T. R. de Marinis F. Kim T. M. Laack E. Robeva A. Le Mouhaer S. Waldron-Lynch M. Sankaran B. Balbin O. A. Cui X. Giovannini M. Akimov M. Heist R. S. N. Engl. J. Med. 2020;383:944–957. - PubMed
-
- Kong-Beltran M. Seshagiri S. Zha J. Zhu W. Bhawe K. Mendoza N. Holcomb T. Pujara K. Stinson J. Fu L. Severin C. Rangell L. Schwall R. Amler L. Wickramasinghe D. Yauch R. Cancer Res. 2006;66:283–289. - PubMed
Grants and funding
LinkOut - more resources
Full Text Sources
Miscellaneous