. 2025 Mar 13:16:1550208.
doi: 10.3389/fphar.2025.1550208. eCollection 2025.

A bibliometric and visualized analysis of extracellular vesicles in degenerative musculoskeletal diseases (from 2006 to 2024)

Affiliations

A bibliometric and visualized analysis of extracellular vesicles in degenerative musculoskeletal diseases (from 2006 to 2024)

Jun-Jie Yang et al. Front Pharmacol. .

Abstract

Background: With the rapid development of extracellular vesicles (EVs) in regenerative medicine research, they have become a promising new direction in the mechanistic, diagnosis and treatment studies of degenerative musculoskeletal diseases (DMDs), and has attracted increasing attention. However, there is currently a lack of comprehensive and objective summary analysis to help researchers quickly and conveniently understand the development trajectory and future trends of this field.

Method: This study collected articles and reviews published from 2006 to 2024 on EVs in DMDs from the Web of Science database. Bibliometric and visual analysis was conducted using several tools, including Microsoft Excel Office, VOSviewer, CiteSpace, Pajek, and R packages.

Results: 1,182 publications were included in the analysis from 2006 to 2024. Notably, there was a rapid increase in the number of publications starting in 2016, suggesting that this field remains in a developmental stage. Co-authorship analysis revealed that China ranked first in terms of publications, whereas the United States led in citations. The journal with the highest number of publications was International Journal of Molecular Sciences (INT J MOL SCI). The most prolific authors were Ragni, E with 23 publications, while the most cited author was Toh, WS. Additionally, nine of the top 10 institutions were from China, with Shanghai Jiao Tong University leading in the number of publications. The most cited article was "MSC exosomes mediate cartilage repair by enhancing proliferation, attenuating apoptosis and modulating immune reactivity", authored by Zhang, S, and published in BIOMATERIALS in 2018.

Conclusion: This study, through bibliometric and visual analysis, clearly illustrates the collaborative relationships among countries, authors, institutions, and journals, providing valuable insights for researchers seeking academic collaboration opportunities. Moreover, the analysis of keywords and citations allows researchers to better understand key research hotspots and frontiers in this field, and points toward promising directions for future research. The growing interest in EV research in DMDs over recent years indicates increasing attention and a dynamic progression in this field.

Keywords: bibliometric analysis; cell-free therapy; degenerative musculoskeletal diseases; extracellular vesicles; senescence.


Conflict of interest statement

The authors declare that the research was conducted in the absence of any commercial or financial relationships that could be construed as a potential conflict of interest.

Figures

FIGURE 1
FIGURE 1
Flowchart of literature search and selection.
FIGURE 2
FIGURE 2
(A) Annual and cumulative publications from 2006 to 2024, and the trend line of annual publications. It should be noted that the articles we analyzed were published up to 23 October 2024, so the publications of this year are incomplete and lower compared to the previous year, but the prediction still shows an upward trend. (B) Annual and cumulative citations from 2006 to 2024, and the trend line of annual citations.
FIGURE 3
FIGURE 3
(A) Countries/regions network visualization. (B) Countries/regions overlay visualization. The size of the nodes also represents the publications of each country, and the color of the nodes reflects the average time of publication. (C) The chord diagram for countries/regions partnership. The United States has significantly fewer publications than China but has stronger cooperation with other countries and a higher Total link strength. (D) Top 10 countries with the strongest citation bursts.
FIGURE 4
FIGURE 4
(A) Keyword network visualization. Circles and labels form the nodes, and the size of the node represents the frequency of the keyword, the higher the frequency, the larger the node. (B) Analysis of Keyword Clustering. The lines between the nodes represent the association strength between keywords. The color of the nodes represents their clusters, with different colors representing different clusters, divided into five clusters based on different research directions. (C) Temporal overlay visualization of the keyword co-occurrence network. The position of the nodes reflects the first appearance year of the corresponding keywords, the size of the nodes reflects the frequency of keyword occurrences, and the annual ring color reflects all years of keyword occurrence. The zoomed-in image shows the keywords that have emerged in the past 2 years. (D) Top 10 keywords with the strongest citation bursts.
FIGURE 5
FIGURE 5
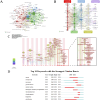
(A) Analysis of the network of references by citespace. Each node corresponds to each cited reference. The lines between nodes represent co-citation relationships. Various colors from purple to red represent different years, with the time range from 2006 to 2024. (B) The clustered network map of co-cited references. Different colors represent different clusters, which reflect the strength of association between articles. (C) Bubble chart of the top 10 cited references. The size and color of the bubbles intuitively show the citations of the articles and their trends over the years. (D) Top 10 references with the strongest citation bursts.
FIGURE 6
FIGURE 6
(A) journal network visualization. The size of the nodes represents the number of publications of the journals, and the colors represent different clusters. (B) Analyses of research subject areas. Different colors represent different fields. (C) The overlay of dual-map journals. The map is divided into two parts: the left side shows the distribution of the citing journals. The right side provides the distribution of the cited journals, which can be considered the research foundation for the former. The dots represent different journals, different colors represent the fields of interest shared by journals in the same cluster, and the ellipses represent the number of publications and the ratio of authors to publications for a journal. The length of the ellipses represents the number of authors, and the width represents the number of publications.
FIGURE 7
FIGURE 7
(A) Author network visualization. (B) Author overlay visualization. The size of circles in the network represents the publications of authors. The thickness of lines between circles represents the strength of collaboration among authors. The label view reflects the average publication year of authors based on the darkness of circle colors. (C) Author Co-citation Analysis by VOSviewer. Co-citation analysis refers to multiple authors’ articles being cited in the same literature. The size of circles reflects the citation count of authors. Lines represent co-citation relationships, and the thickness of lines can indicate the frequency of co-citation. A higher frequency of co-citation between two authors may indicate that their research areas or topics are closely related. If the two authors have different academic backgrounds, it can reflect the interdisciplinary research potential of this field. (D) Top 10 authors with the strongest citation bursts.
FIGURE 8
FIGURE 8
(A) institution network visualization. (B) Institution density visualization by VOSviewer.

References

    1. Abramoff B., Caldera F. E. (2020). Osteoarthritis: pathology, diagnosis, and treatment options. Med. Clin. North Am. 104 (2), 293–311. 10.1016/j.mcna.2019.10.007 - DOI - PubMed
    1. Aria M., Cuccurullo C. (2017). bibliometrix: an R-tool for comprehensive science mapping analysis. J. Inf. 11 (4), 959–975. 10.1016/j.joi.2017.08.007 - DOI
    1. Barreiro K., Dwivedi O. P., Leparc G., Rolser M., Delic D., Forsblom C., et al. (2020). Comparison of urinary extracellular vesicle isolation methods for transcriptomic biomarker research in diabetic kidney disease. J. Extracell. Vesicles 10 (2), e12038. 10.1002/jev2.12038 - DOI - PMC - PubMed
    1. Camino T., Lago-Baameiro N., Bravo S. B., Molares-Vila A., Sueiro A., Couto I., et al. (2022). Human obese white adipose tissue sheds depot-specific extracellular vesicles and reveals candidate biomarkers for monitoring obesity and its comorbidities. Transl. Res. 239, 85–102. 10.1016/j.trsl.2021.01.006 - DOI - PubMed
    1. Cao Y., Ruan J., Kang J., Nie X., Lan W., Ruan G., et al. (2024). Extracellular vesicles in infrapatellar fat pad from osteoarthritis patients impair cartilage metabolism and induce senescence. Adv. Sci. (Weinh) 11 (3), e2303614. 10.1002/advs.202303614 - DOI - PMC - PubMed

LinkOut - more resources