. 2025 Apr 8;122(14):e2418783122.
doi: 10.1073/pnas.2418783122. Epub 2025 Apr 4.

A disease-specific convergence of host and Epstein-Barr virus genetics in multiple sclerosis

Affiliations

A disease-specific convergence of host and Epstein-Barr virus genetics in multiple sclerosis

Rosella Mechelli et al. Proc Natl Acad Sci U S A. .

Abstract

Recent sero-epidemiological studies have strengthened the hypothesis that Epstein-Barr virus (EBV) may be a causal factor in multiple sclerosis (MS). Given the complexity of the EBV-host interaction, various mechanisms may be responsible for the disease pathogenesis. Furthermore, it remains unclear whether this is a disease-specific process. Here, we showed that genes encoding EBV interactors are enriched in loci associated with MS but not with other diseases and in prioritized therapeutic targets. Analyses of MS blood and brain transcriptomes confirmed a dysregulation of MS-associated EBV interactors affecting the CD40 pathway. Such interactors were strongly enriched in binding sites for the EBV nuclear antigen 2 (EBNA2) viral transcriptional regulator, often in colocalization with CCCTC binding factor (CTCF) and RNA Polymerase II Subunit A (POLR2A). EBNA2 was expressed in the MS brain. The 1.2 EBNA2 allele downregulated the expression of the CD40 MS-associated gene analogously to the CD40 MS-risk variant. Finally, we showed that the 1.2 EBNA2 allele associates with the risk of MS. This study delineates how host and viral genetic variability converge in MS-specific pathogenetic mechanisms.

Keywords: Epstein–Barr virus; autoimmunity; multiple sclerosis.


Conflict of interest statement

Competing interests statement:M.S. and G.R. hold a patent on EBNA2 alleles in multiple sclerosis (IT1417523 EP2981625).

Figures
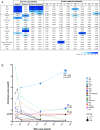
Fig. 1.
Fig. 1.
Enrichment analysis of interactomes in GWAS. (A) Heatmap represents the interactomes and related strength of associations with diseases. The statistically relevant associations are indicated in blue, with a color gradient from white (P > 0.05) to blue (P < 0.01). (B) Enrichment of interactomes in MS GWAS 2019, considering different thresholds of SNP P-value of association with MS (x axis). ChD = Crohn disease; RA = rheumatoid arthritis; CD = celiac disease; T1D = type 1 diabetes; T2D = type 2 diabetes; HT = hypertension; BD = bipolar disorder; CAD = coronary artery disease; AHR = Aryl hydrocarbon receptor; AIRE = autoimmune regulator; BioGRID = Biological General Repository for Interaction Datasets; CMV = Cytomegalovirus; EBV = Epstein–Barr virus; HBV = Hepatitis B virus; HCV = Hepatitis C virus; HDACs = Histone deacetylases; HHV8 = Human Herpesvirus 8; HIV; H1N1 = Influenza A virus; hu-IFN = human innate immunity interactome for type I interferon; Human-miRNA targets = gene targets for human miRNA; Inflammasome = multiprotein complex responsible for activation of inflammatory processes and pyroptosis; JCV = JC virus; SIRT1 = Sirtuin 1; SIRT7 = Sirtuin 7; VIRORF = Virus Open Reading Frame; VDR = vitamin D receptor.
Fig. 2.
Fig. 2.
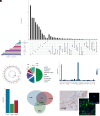
Genomic distribution of the candidate interactome SNPs and protein binding enrichment near MS-associated SNPs. (A) The UpsetPlot displays the number of MS-AIG for each interactome of origin (x axis) and the intersections between gene sets with the respective size (y axis) (see also SI Appendix, Table S2). (B) The circos plot shows the genomic distribution of the SNPs obtained from the candidate interactome analysis. The outer circle shows the chromosomes with related cytobands. The underlying gray lines indicate the physical position of the corresponding 741 MS-AIG (each line may represent up to 25 genes). The red and blue lines in the inner circles indicate the −log(P value) for each SNP respectively from GWAS 2011 and GWAS 2013 (scaled from 0 to 20, which truncates the signal in several regions). (C) The pie chart represents the distribution of SNPs in different regions of the human genome, showing an enrichment in intronic and downstream/upstream regions. (D) The bar plot displays the number of SNPs bound by a given protein obtained from different cell types (vertical axis) and the top 30 transcription factors enriched on MS-associated SNPs; color scale is related to the number of cell types. (E) The bar plot shows the number of SNPs colocalizing with EBNA2, CTCF, and POLR2A binding sites. (F) The Venn graph displays the overlap of SNPs bound by CTCF, EBNA2, and POLR2A. (G) The image displays EBNA2 expressed by CD79a+ B cells in the leptomeninges of postmortem progressive MS cases in the presence of a substantial number of meningeal CD20+ B cells. In the Upper Right Inset are shown EBNA2+ nuclei. NMD = Nonsense-mediated mRNA decay; 3′UTR = three prime untranslated region.
Fig. 3.
Fig. 3.
CD40 signaling analysis. (A) The top 10 pathways obtained from the analysis of the MS-AIG. The lower P-value (−log Pvalue) means higher relevance of the genes within the pathway datasets. (B) The CD40 protein level analyzed in MS-spLCLs (n = 13) and HD-spLCLs (n = 8) is downregulated in MS-spLCLs at unpaired t-test (*P = 0.04). (C) The CD40 protein level stratified according to the gender, CD40 protein is underexpressed in females of the MS group (F-MS) compared to males (M-MS, *P = 0.049) and compared to the females of the control group (F-HD; **P = 0.006). (D) The CD80 protein level is comparable between MS-spLCLs and HD-spLCLs. (E) The CD80 protein level stratified according to the gender, CD80 protein is underexpressed in F-MS compared to the F-HD (**P = 0.0037). (F and G) A correlation between CD40 and CD80 protein levels was evaluated by a simple linear regression analysis (Spearman correlation) in MS (r2= 0.43, P = 0.016; F) and in HD (r2= 0.32, P = 0.16; G). Gray areas represent the CI, and the straight lines represent the correlation slope. The protein levels are represented as median fluorescence intensity. Data analysis was performed using the unpaired t-test F = female; M = male. (H and I) The effect of the EBV strain (spLCL vs. B95.8LCL) and CD80 levels on CD40 protein expression in MS patients (n = 5; H) and controls (n = 4; I) were analyzed by a mixed-effect multiple linear regression model, setting subjects as random effect, and cell line context and CD80 levels as fixed effects. (J) CD40 protein levels analyzed in spLCL carrying the MS-associated 1.2 EBNA2 allele and in B95.8LCL. CD40 is reduced in spLCL with 1.2 EBNA2 (n = 8) respect to those infected by EBNA2 B95.8 (n = 10; *P = 0.013). (K) Representative images of western blot probed for CD40, EBNA2, and ß-actin (internal controls) on U2OS cell lysate. (L) The expression of CD40, normalized to the level of mock condition, and EBNA2 (both calculated over the internal control) in U2OS transfected with 1.2 EBNA2 (CD40, n = 2; EBNA2, n = 3) and with EBNA2 B95.8 (CD40, n = 3; EBNA2, n = 2, *P = 0.025). The data are expressed as mean ± SEM analyzed by the unpaired t-test.
Fig. 4.
Fig. 4.
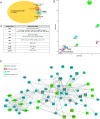
Enrichment of MS-AIG in prioritized therapeutic targets and therapeutic module construction. (A) Overlap between MS-AIG and Priority Index genes for MS (Fisher’s exact test, P-value after adjusting using the Benjamini–Hochberg method, OR: odds ratio). (B) The chart shows the enrichment of MS-AIG in the top 150 Priority index positions for MS by interactome of origin. The x axis shows the odds ratio, the y axis shows the −log(P value), and dot size is proportional to the number of items. (C) The table includes the prioritized genes by interactome of origin. (D) Illustration of the therapeutic module, made of prioritized MS-AIG and PI crosstalk genes for MS. As shown in the legend, the EBV interactome genes are displayed in green, while those related to the CD40 pathway are highlighted with an orange contour. Edge intensity is proportional to the PPI score.

References

    1. Jacobs B. M., et al. , Towards a global view of multiple sclerosis genetics. Nat. Rev. Neurol. 18, 613–623 (2022). - PubMed
    1. Bjornevik K., et al. , Longitudinal analysis reveals high prevalence of Epstein-Barr virus associated with multiple sclerosis. Science 375, 296–301 (2022). - PubMed
    1. Aloisi F., Giovannoni G., Salvetti M., Epstein-Barr virus as a cause of multiple sclerosis: Opportunities for prevention and therapy. Lancet Neurol. 22, 338–349 (2023). - PubMed
    1. Cortese M., et al. , Serologic response to the Epstein Barr virus peptidome and the risk of multiple sclerosis. JAMA Neurol. 81, 515–524 (2024). - PMC - PubMed
    1. Tengvall K., et al. , Molecular mimicry between Anoctamin 2 and Epstein-Barr virus nuclear antigen 1 associates with multiple sclerosis risk. Proc. Natl. Acad. Sci. U.S.A. 116, 16955–16960 (2019). - PMC - PubMed

MeSH terms

LinkOut - more resources