. 2025 Apr 4;21(4):e1013003.
doi: 10.1371/journal.ppat.1013003. eCollection 2025 Apr.

Intact HIV DNA decays in children with and without complete viral load suppression

Affiliations

Intact HIV DNA decays in children with and without complete viral load suppression

Daniel B Reeves et al. PLoS Pathog. .

Abstract

To inform cure in children living with HIV (CWH), we elucidated the dynamics and mechanisms underlying HIV persistence during antiretroviral therapy (ART). In 120 Kenyan CWH who initiated ART between 1-12 months of age, 55 had durable viral load suppression, and 65 experienced ART interruptions. We measured plasma HIV RNA levels, CD4+ T cell count, and levels of intact and defective HIV DNA proviruses via the cross-subtype intact proviral DNA assay (CS-IPDA). By modeling data from the durably suppressed subset, we found that during early ART (year 0-1 on ART), plasma RNA levels decayed rapidly and biphasically and intact and defective HIV DNA decayed with mean 3 and 9 month half-lives, respectively. After viral suppression was achieved (years 1-8 on ART), intact HIV DNA decay slowed to a mean 22 month half-life, whilst defective HIV DNA no longer decayed. In five CWH, we found individual CD4+ TCRβ clones wax and wane, but average kinetics resembled those of defective DNA and CD4 count, suggesting that differential decay of intact HIV DNA arises from selective pressures overlaying normal CD4+ T cell kinetics. Finally, by modeling HIV RNA and DNA in CWH with treatment interruptions, we linked temporary viremia to transient rises in HIV DNA, but long-term intact reservoirs were not strongly influenced, suggesting brief treatment interruptions may not significantly increase HIV reservoirs in children.


Conflict of interest statement

The authors have declared that no competing interests exist.

Figures

Fig 1
Fig 1. OPH cohort data and study design.
A) Overall cohort comprises 120 Kenyan children who acquired HIV near birth and received early ART. B) HIV-1 subtype from 106 participants sequenced via pol. C) Histogram of ART initiation age colored to show balance of male and female children. D) Longitudinal measurement timing is noted for viral load (log10 HIV RNA copies/mL) and CD4 count (cells/µL) as approximately every 6 months for all participants. Intact and defective HIV DNA using the CS-IPDA assay were measured at 7 time points and number of participants sampled at each time point are noted. Immune markers (N=30 children) were measured at the HIV DNA time points. Non-naïve TCRβ sequencing (N=5 children) was performed at two long-term ART time points. E) Viral loads for the suppressed and viremic subsets of OPH participants, stratified based on whether viral load dropped below 1000 copies/mL within the first year of ART and stayed below 3000 copies/mL thereafter.
Fig 2
Fig 2. Modeled kinetics in suppressed subset.
A) For viral load, CD4 count, and intact and defective HIV DNA, exponential population nonlinear mixed effects modeling (pNLME) fit to data separated by early (<1 year, left) and long-term (>1 year, right) ART. Note months vs years in x-axes. Dashed lines indicate individual trajectories with dots at observed time points. Bold lines indicate pNLME population mean. B) Estimated population means (dots) and 95% confidence intervals (CI, lines) for each data type. Phases were defined as the first 0-2 months, 2-12 months for HIV RNA and 0-1 year for HIV DNA, and 1-8 years on ART. Axes are split by no decay (or very stable kinetics) such that half-lives and doubling times can be presented. Arrows on CI indicate overlap with no decay. Comparisons indicate 1-sided Z-test. C) Simulation summary of mean (line) and 95% CI (shading) kinetics relative to baseline level for each data type.
Fig 3
Fig 3. Comparison of HIV kinetics to immune marker dynamics and CD4+ T cell clone dynamics.
A) Kinetics of immune markers measured in 30 OPH participants. B) Baseline GzB and IL15 (at ART initiation) associated with very early viral load (<2 months) and early (<1 year) intact decay, respectively. Line/shading is linear regression and 95% CI. Spearman correlation coefficients and p-values are noted but are not significant after multiple comparisons correction (significance would require p<0.003). All comparisons shown in S7 Fig. C) Schematic of TCR sequencing after magnetic bead isolation of non-naive CD4+ T cells. D) Paired longitudinal nnTCRβ clone kinetics from five participants from clones observed at both timepoints (roughly 40 to 96 months after ART) after downsampling to lowest sample size across participants (Methods). E) Histogram of fold-changes from paired persistent clones. Colored lines match individuals in D. F) Mean (dot) and 95% CI (line) rate for nnTCRβ kinetic change rates compared against individual HIV DNA and CD4 count rates from the matching participants. Asterisks for 4 of 5 participant IDs denote intact HIV DNA rate is significantly faster than other rates as determined by no overlap in 95% CI. Intact proviruses tend to decline whereas the total is stable and expansion and contraction of typical TCR clones is balanced.
Fig 4
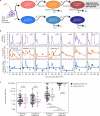
Fig 4. Modeled kinetics including viremia allow comparison with viremic and suppressed subset.
A) Model schematic to link HIV RNA viremia and creation of HIV DNA (Phase 2 and Phase 3 or shorter and longer-lived, Eq 1). B) Seven example model fits (all in S1 Data) where each column shows a participant, and the rows show HIV RNA and observed intact and defective HIV DNA (dots) vs model output of total HIV DNA (I1+I2+I3, solid line) and Phase 3 long-lived HIV DNA (I3, dashed line). C) Box plots of individual half-life estimates for intact and defective HIV DNA for Phase 2 and Phase 3 split by suppressed (N=55) and viremic (N=27) participants. P-values indicate one-sided Mann-Whitney U-Test.

References

    1. Goulder PJ, Lewin SR, Leitman EM. Paediatric HIV infection: the potential for cure. Nat Rev Immunol. 2016;16(4):259–71. doi: 10.1038/nri.2016.19 - DOI - PMC - PubMed
    1. Berendam SJ, Nelson AN, Goswami R, Persaud D, Haigwood NL, Chahroudi A, et al.. Pediatric HIV: the Potential of Immune Therapeutics to Achieve Viral Remission and Functional Cure. Curr HIV/AIDS Rep. 2020;17(3):237–48. doi: 10.1007/s11904-020-00495-1 - DOI - PMC - PubMed
    1. Benki-Nugent S, Eshelman C, Wamalwa D, Langat A, Tapia K, Okinyi HM, et al.. Correlates of age at attainment of developmental milestones in HIV-infected infants receiving early antiretroviral therapy. Pediatr Infect Dis J. 2015;34(1):55–61. doi: 10.1097/INF.0000000000000526 - DOI - PMC - PubMed
    1. Tagarro A, Domínguez-Rodríguez S, Cotton M, Otwombe K, Klein N, Lain MG, et al.. High mortality following early initiation of antiretroviral therapy in infants living with HIV from three African countries. EClinicalMedicine. 2024;73:102648. doi: 10.1016/j.eclinm.2024.102648 - DOI - PMC - PubMed
    1. Violari A, Cotton MF, Gibb DM, Babiker AG, Steyn J, Madhi SA, et al.. Early antiretroviral therapy and mortality among HIV-infected infants. N Engl J Med. 2008;359(21):2233–44. doi: 10.1056/NEJMoa0800971 - DOI - PMC - PubMed