. 2025 Apr 4;11(14):eadq1575.
doi: 10.1126/sciadv.adq1575. Epub 2025 Apr 4.

Atf3 controls transitioning in female mitochondrial cardiomyopathy as identified by spatial and single-cell transcriptomics

Affiliations

Atf3 controls transitioning in female mitochondrial cardiomyopathy as identified by spatial and single-cell transcriptomics

Tasneem Qaqorh et al. Sci Adv. .

Abstract

Oxidative phosphorylation defects result in now intractable mitochondrial diseases (MD) with cardiac involvement markedly affecting prognosis. The mechanisms underlying the transition from compensation to dysfunction in response to metabolic deficiency remain unclear. Here, we used spatially resolved transcriptomics and single-nucleus RNA sequencing (snRNA-seq) on the heart of a patient with mitochondrial cardiomyopathy (MCM), combined with an MCM mouse model with cardiac-specific Ndufs6 knockdown (FS6KD). Cardiomyocytes demonstrated the most heterogeneous expression landscape among cell types caused by metabolic perturbation, and pseudotime trajectory analysis revealed dynamic cellular states transitioning from compensation to severe compromise. This progression coincided with the transient up-regulation of a transcription factor, ATF3. Genetic ablation of Atf3 in FS6KD corroborated its pivotal role, effectively delaying cardiomyopathy progression in a female-specific manner. Our findings highlight a fate-determining role of ATF3 in female MCM progression and that the latest transcriptomic analysis will help decipher the mechanisms underlying MD progression.


Figures
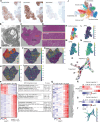
Fig. 1.
Fig. 1.. Cardiomyocytes of a patient with MCM demonstrated transitioning.
(A) Immunohistochemical assessment of RC complexes abundance on myocardium from the female 9-month MCM patient. Immunostaining with NDUFA9 antibody (complex I, top), SDHA antibody (complex II, middle), and COX4 antibody (complex IV, bottom. Scale bar, 200 μm. (B) Electron microscopy ultrastructure of abnormal cardiac mitochondria showing swelling and abnormal onion-like concentric membranes. Scale bar, 500 nm. (C and D) H&E staining of left ventricle showing three phenotypically heterogeneous regions of (D) mild (top; green box), advanced (middle; orange box), and severe (bottom; black box) tissue dysfunction areas. (E) Unsupervised clustering of expression profiles for spots (n = 488) onto the tissue section. (F to I) Expression features of (F) NPPB, (G) ATF3, (H) ATF4, and (I) ATF5 shown as spots. (J) UMAP plot of snRNA-seq data of cardiac cellular populations (n = 10,868) from the patient with MD colored by Leiden clusters and annotated. (K to N) UMAP plot of isolated cardiomyocytes (n = 3511) (K) colored by Leiden clusters. Expressions of (L) ATF3, (M) PPARGC1A, and (N) NPPB are shown on the UMAP. (O) ForceAtlas2 (FA2) scatterplot of PAGA trajectory from cardiomyocytes numbered by Leiden cellular states, showing two trajectories. (P to S) Heatmaps displaying (P) top up-regulated genes in the cellular states of trajectory 1 ranked by log2FC and associated top GO terms and (Q) expression levels of complex I and complex IV subunits and assembly factors extracted from trajectory 1, (R) ATF3 expression level changes in comparison to PPARGC1A and NPPB, and (S) NPPB along the trajectory 2 states. (T) NPPB expression shown as FA2 scatterplot.
Fig. 2.
Fig. 2.. Mouse MCM model shows earlier cardiomyocyte metabolic compensation.
(A and B) UMAP plot of the cardiac cellular populations in the integrated dataset. (A) Colored by Leiden clusters and annotated. (B) Colored by sample identity, FS6WT (green, n = 12,020), early FS6KD (blue, n = 12,516), and late FS6KD (orange, n = 7280). (C) Heatmap displaying knockdown efficiency per cell type. Relative average expression levels of Ndufs6 in cell types of early FS6KD against FS6WT. (D) UMAP plot of isolated cardiomyocytes (FS6WT: n = 2856, early FS6KD: n = 4273, late FS6KD: n = 1201) colored by sample identity with respective heatmaps displaying top up-regulated genes ranked by log2FC and associated enriched top GO terms. Fisher exact test was used to calculate P values for GO. (E and F) UMAP plot of isolated and subclustered cardiomyocytes. (E) Colored by Leiden clusters. (F) Colored by sample identity. (G) Ppargc1a expression shown as isolated cardiomyocyte UMAP feature. Small subcluster from early FS6KD was magnified and shown in the bottom highlighting decreased expression. (H) Nppb expression shown as isolated cardiomyocytes UMAP feature. Small subcluster from early FS6KD was magnified and shown in the bottom highlighting increased expression. (I) Ppargc1a expression shown as integrated dataset UMAP feature. Color intensity is increased in cellular populations corresponding to early FS6KD in all cell types. (J) Ppargc1a average expression per cell type per dataset. SMCs, smooth muscle cell.
Fig. 3.
Fig. 3.. Pseudotime trajectory analysis revealed Atf3 induction during transitioning.
(A and B) FA2 scatterplot of abstracted partition-based graph abstraction (PAGA) trajectory from isolated cardiomyocytes. (A) Colored by Leiden cellular states. (B) Colored by sample identity. (C) FA2 scatterplot of isolated PAGA trajectory from early FS6KD cardiomyocytes numbered by Leiden cellular states. (D and E) Ppargc1a (D) and Nppb (E) expression shown as FA2 scatterplot. (F) Heatmap displaying top up-regulated genes in the cellular states of early FS6KD cardiomyocyte trajectory ranked by log2FC and associated top GO terms. Fisher exact test was used to calculate P values for GO. (G) Heatmap displaying expression levels of TFs extracted from (F) ranked by log2FC. (H) Enlarged heatmap from (G) with log2FC values (top) and P values (bottom). Wilcoxon rank-sum test was used to calculate P values. (I) Atf3 expression shown as integrated dataset UMAP feature. Color intensity is increased in early FS6KD cardiomyocytes.
Fig. 4.
Fig. 4.. Atf3-expressing cardiomyocytes with repressed OXPHOS genes form cluster in the FS6KD heart.
(A) Cardiomyocytes nuclear localization of Atf3 in early FS6KD. Immunostaining with TnnI3 antibody (top), Atf3 antibody (middle), and an overlay image (bottom). Scale bars, 100 μm. A representative image was shown (n = 11 biological replicates and n > 3 technical replicates). (B) Expression and nuclear localization of Atf3 in FS6WT versus FS6KD of different ages. Immunostaining with Atf3 antibody in FS6WT (top), early FS6KD (middle), and middle FS6KD (bottom). Scale bars, 100 μm. (C) Quantitative analysis of Atf3-positive nuclei by immunostaining in FS6KD of different stages (early, middle, and late). Bars: Means ± SD. Dots: Each dot represents one mouse and average count (early n = 5, middle n = 3, and late n = 3 biological replicates and n > 3 technical replicates per group). Ordinary one-way analysis of variance (ANOVA) and Tukey’s test for multiple comparisons, statistical significance: ****P ≤ 0.0001; ns, not significant. (D) Atf3 expression cluster from [(A), middle]. Blue arrows point to nuclei with low Atf3 expression, and white arrows point to nuclei with high Atf3 expression. Scale bar, 100 μm. (E) Heatmap displaying DEGs extracted from photo-isolation chemistry ranked by log2FC and associated top GO terms, n = 3 biological replicates per group. Pairwise two-tailed t test was used to calculate P values for DEG selection, and Fisher exact test was used to calculate P values for GO. (F) Ppargc1a expression levels. Bars: Means ± SD. Dots: Individual subjects (n = 3 biological replicates per group). Pairwise two-tailed t test, statistical significance: *P ≤ 0.05.
Fig. 5.
Fig. 5.. ISR activation follows transient Atf3 induction in FS6KD cardiomyocytes.
(A and B) UMAP plot of the cardiac cellular populations in the integrated dataset. (A) Colored by Leiden clusters and annotated. (B) Colored by sample identity, early FS6KD (blue), middle FS6KD (orange), and late FS6KD (green). (C) UMAP plot of isolated cardiomyocytes colored by sample identity and associated top GO terms of middle FS6KD cardiomyocytes. Fisher exact test was used to calculate P values for GO. (D) Heatmap displaying expression levels of some Atfs and ISRmt genes extracted from DEG list ranked by log2FC. (E and F) Protein analysis of selected ISR-related proteins and enzymes. (E) Immunoblot analysis of eIF2α, phosphorylated eIF2α (p-eIF2α), Atf4, Mthfd2, and Shmt2 in heart lysates from early-stage (n = 4 biological replicates) and middle-stage (n = 3 biological replicates) mice and (F) quantification of p-eIF2α relative to eIF2α and Atf4, Mthfd2, and Shmt2 relative to WT (n = 3 biological replicates) normalized by loading control vinculin. Bars: Means ± SD. Dots: Individual subjects. Ordinary one-way ANOVA and Tukey’s test for multiple comparisons, statistical significance: **P ≤ 0.01. ATP, adenosine triphosphate.
Fig. 6.
Fig. 6.. Genetic ablation of Atf3 delayed the progression of heart failure in female FS6KD mice.
(A and B) Summarized echocardiographic measurements of Atf3−/−FS6WT, Atf3+/+FS6KD, and Atf3−/−FS6KD mice at early and middle stages. (A) EF and LVDd of female mice, early (n = 4, 11, and 11 biological replicates) and middle (3, 9, and 11 biological replicates). (B) EF and LVDd of male mice, early (n = 4, 9, and 14 biological replicates) and middle (3, 8, and 13 biological replicates). Two-way ANOVA and Tukey’s test for multiple comparisons, (C) Masson’s trichrome staining of hearts isolated from middle mice for fibrosis assessment. Field view of Atf3+/+FS6KD and Atf3−/−FS6KD. Scale bars, 500 μm. (D) Respective quantitative assessment summary of cardiac fibrosis area (n = 4 and 7 biological replicates and n > 3 technical replicates). Unpaired two-tailed Student’s t test. (E) Heatmap displaying DEGs extracted from RNA-seq of Atf3+/+FS6KD or Atf3−/−FS6KD hearts in middle ranked by log2FC and associated top GO terms (n = 4 biological replicates). Pairwise two-tailed t test was used to calculate P values for DEG selection and Fisher exact test to calculate P values for GO. (F and G) Protein analysis of selected ISR-related proteins and enzymes. (F) Immunoblot analysis of eIF2α, p-eIF2α, Atf4, and Mthfd2 in heart lysates from early and middle stages of Atf3+/+FS6KD and Atf3−/−FS6KD (n = 3 biological replicates each) and (G) quantification of p-eIF2α, Atf4, and Mthfd2 normalized by loading control vinculin. Ordinary one-way ANOVA and Tukey’s test for multiple comparisons. Bars: Means ± SD. Dots: Individual subjects. Statistical significance: *P ≤ 0.05, **P ≤ 0.01, ***P ≤ 0.001, and ****P ≤ 0.0001.

References

    1. Gorman G. S., Chinnery P. F., DiMauro S., Hirano M., Koga Y., McFarland R., Suomalainen A., Thorburn D. R., Zeviani M., Turnbull D. M., Mitochondrial diseases. Nat. Rev. Dis. Prim. 2, 16080 (2016). - PubMed
    1. Schlieben L. D., Prokisch H., The dimensions of primary mitochondrial disorders. Front. Cell Dev. Biol. 8, 600079 (2020). - PMC - PubMed
    1. Gorman G. S., Schaefer A. M., Ng Y., Gomez N., Blakely E. L., Alston C. L., Feeney C., Horvath R., Yu-Wai-Man P., Chinnery P. F., Taylor R. W., Turnbull D. M., McFarland R., Prevalence of nuclear and mitochondrial DNA mutations related to adult mitochondrial disease. Ann. Neurol. 77, 753–759 (2015). - PMC - PubMed
    1. Buajitti E., Rosella L. C., Zabzuni E., Trevor Young L., Andreazza A. C., Prevalence and health care costs of mitochondrial disease in Ontario, Canada: A population-based cohort study. PLOS ONE 17, e0265744 (2022). - PMC - PubMed
    1. Suomalainen A., Battersby B. J., Mitochondrial diseases: The contribution of organelle stress responses to pathology. Nat. Rev. Mol. Cell Biol. 19, 77–92 (2018). - PubMed

MeSH terms

Substances

LinkOut - more resources