. 2025 Apr 4;11(14):eadr6415.
doi: 10.1126/sciadv.adr6415. Epub 2025 Apr 4.

Retromer promotes the lysosomal turnover of mtDNA

Affiliations

Retromer promotes the lysosomal turnover of mtDNA

Parisa Kakanj et al. Sci Adv. .

Abstract

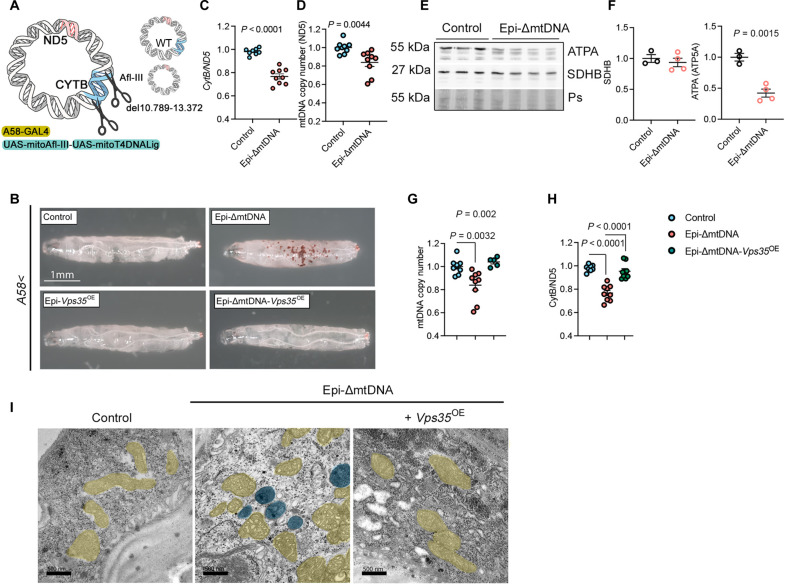
Mitochondrial DNA (mtDNA) is exposed to multiple insults produced by normal cellular function. Upon mtDNA replication stress, the mitochondrial genome transfers to endosomes for degradation. Using proximity biotinylation, we found that mtDNA stress leads to the rewiring of the mitochondrial proximity proteome, increasing mitochondria's association with lysosomal and vesicle-related proteins. Among these, the retromer complex, particularly VPS35, plays a pivotal role by extracting mitochondrial components. The retromer promotes the formation of mitochondrial-derived vesicles shuttled to lysosomes. The mtDNA, however, directly shuttles to a recycling organelle in a BAX-dependent manner. Moreover, using a Drosophila model carrying a long deletion on the mtDNA (ΔmtDNA), we found that ΔmtDNA activates a specific transcriptome profile to counteract mitochondrial damage. Here, Vps35 expression restores mtDNA homoplasmy and alleviates associated defects. Hence, we demonstrate the existence of a previously unknown quality control mechanism for the mitochondrial matrix and the essential role of lysosomes in mtDNA turnover to relieve mtDNA damage.


Figures

Fig. 1.
Fig. 1.. mtDNA damage follows a lysosomal-dependent degradation pathway.
(A) Confocal images of HeLa cells in the steady state and expressing TWNKK319E-mCherry (mtDNA stress) labeled with α-TOM20. (B) mtDNA copy number analysis in HeLa cells transiently transfected with TWNKK319E-mCherry. (C) Schematic representation of the SplitTurboID assay. The early endosomal marker RAB5C and the mitochondrial outer membrane protein SAMM50 were used to determine the proximity proteome of mitochondria and endosomes. Illustration from NIAID NIH BIOART Source. (D and E) Immunostaining of HeLa cells expressing (D) RAB5C-SplitNt-V5 and (E) SAMM50-SplitCt-HA labeled with α-RAB5 and α-V5 and α-TOM20 and α-HA, respectively. (F and G) Pathway enrichment analysis with Metascape showing GO terms for proteins differentially enriched (F) in the steady state and (G) after expression of TWNKK319E-mCherry. (H and I) Volcano plot showing proteins enriched after biotinylation and purification of cells expressing (H) SplitTurboID plasmids and (I) TWNKK319E-mCherry. Differentially expressed proteins compared with cells transduced only with SAMM50-SplitCt-HA (significant: q value < −0.05 and absolute log2 FC > 1) are highlighted in blue (steady state) or red (mtDNA stress) (n = 3 samples per group). P values were calculated using one-way ANOVA with Tukey correction for multiple comparisons. Scale bars, 10 μm. Data are presented as means ± SEM.
Fig. 2.
Fig. 2.. The retromer participates in the response to mtDNA replication stress by adapting the mitochondrial morphology.
(A and B) Immunostaining of HeLa cells expressing VPS29-GFP and (B) TWNKK319E-mCherry labeled with α-VPS35 and α-TOM20. (C) Manders’ correlation coefficient between TOM20 and VPS29. n = 3, 10 images per replicate. (D to I) Western blot analysis and quantification of retromer components upon [(D) and (E)] VPS26A, [(F) and (G)] VPS29, or [(H) and (I)] VPS35 KO. α-GAPDH or α-actin was used as a loading control. GAPDH, glyceraldehyde-3-phosphate dehydrogenase. (J to L) α-TOM20 immunostaining in (J) VPS35, (K) VPS29, and (L) VPS26 KO, in the steady state and expressing TWNKK319E-mCherry. (M to O) Quantification of mitochondrial morphology parameters. n = 3, >20 cells per replicate. (P) α-TOM20 immunostaining in VPS29 and VPS26A KO expressing TWNKK319E-mCherry and VPS35-GFP. P values were calculated using Student’s t test [(C), (E), (G), and (I)] and one-way ANOVA [(M) to (O)]. Scale bars, 10 μm. Data are presented as means ± SEM.
Fig. 3.
Fig. 3.. mtDNA replication stress and oxidation initiate the release of mitochondrial components.
(A) HeLa cells expressing VPS35-GFP and TWNKK319E-mCherry and labeled with the mitochondrial outer membrane marker α-TOM20 and mitochondrial matrix α-PDH. (B to D) Quantification of α-TOM20− and α-PDH+ foci [(B) and (C)] in control cells expressing the indicated plasmids and (D) in retromer deficient cells. n = 3, >15 cells per replicate. (E) Immunostaining of VPS29 KO cells expressing TWNKK319E-mCherry and labeled with α-TOM20− and α-PDH+ foci. (F) Fluorescence profile of 50-pixel line. The selected area is highlighted above the graph. (G and H) Immunostaining of α-TOM20 and α-PDH in cells treated with (G) 200 μM H2O2 4 hours or (H) grown in galactose medium overnight. (I) Quantification of α-TOM20− and α-PDH+ foci in H2O2 and galactose-treated cells. Where indicated, cells were treated with 10 μM chloroquine 4 hours before fixation to block lysosomal function (n = 3, >15 cells per replicate). TOM20−/PDH+ foci are encircled in magenta circles. P values were calculated using one-way ANOVA with Tukey correction for multiple comparisons. Scale bars, 10 μm. Data are presented as means ± SEM.
Fig. 4.
Fig. 4.. mtDNA replication stress triggers Bax-dependent mtDNA release.
(A) HeLa cells expressing TWNKK319E-mCherry and VPS35-GFP labeled with α-TOM20 and α-dsDNA or α-PDH. (B) Fluorescence profile of 50-pixel line labeled in (A). (C) qPCR quantification of ND1 and ND5 mtDNA genes in mitochondria-free cytosolic fractions (n = 3). (D to G) Analysis and quantification of cytosolic dsDNA foci upon mtDNA replication stress by immunostaining with α-TOM20 and α-dsDNA in [(D) and (E)] VPS35-GFP expressing cells and [(F) and (G)] Miro1 KO cells. (n = 3, >15 cells per replicate). (H) HeLa cells expressing mtDNA-Kaede and TWNKK319E-mCherry labeled with α-TOM20 and α-PDH. (I) Quantification of TOM20- Vesicles containing PDH, dsDNA or both (n = 3, >20 cells per replicate). (J and K) Analysis and quantification of the involvement of mitochondrial membrane pores in mtDNA release. Where indicated, 24 hours after transfection, cells were further treated 4 hours with 10 μM chloroquine, 25 μM VBIT-12 for VDAC1 inhibition, or 100 μM V5 peptide for the inhibition of BAX oligomerization (n = 3, >15 cells per replicate). TOM20−/PDH+ foci are encircled by magenta circles. TOM20−/dsDNA+ and TOM20−/mtDNA-Kaede+ foci are encircled by magenta circles. DMSO, dimethyl sulfoxide. P values were calculated using one-way ANOVA with Tukey correction for multiple comparisons [(C), (E), and (I)] and Student’s t test [(G) and (K)]. Scale bars, 10 μm, except for (H), 5 μm. Data are presented as means ± SEM.
Fig. 5.
Fig. 5.. mtDNA release occurs through direct transfer to a recycling organelle.
(A) CLEM of cells expressing TWNKK319E-mCherry and labeled with SYBR Gold and PK MitoDeep Red. Boxes labeled with (a) and (b) indicate the areas used for CLEM. (B and C) Volumetric reconstitution of electron tomographies of cytosolic mtDNA areas. The organelle containing dsDNA is shown in green, other recycling organelles in lilac, mitochondrial outer membrane in gray, and mitochondrial cristae in cyan. (D) TWNKK319E-mCherry cell further expressing VPS35-CFP. Boxes labeled with (c) and (d) indicate the areas used for CLEM. (E and F) Correlation of VPS35-CFP foci and (F) mtDNA exit site. (G and H) Volumetric reconstitution of electron tomographies in VPS35-CFP cells. In all cases, cells were treated with 10 μM chloroquine for 4 hours. For CLEM, all dyes were loaded for 1 hour before fixation. Scale bars, 500 nm for reconstituted tomograms [(B), (C), (G), and (H)], 1 μm [(E) and (F)], and 10 μm [(A) and (D)].
Fig. 6.
Fig. 6.. The small GTPase RAB10 promotes mitochondrial fragmentation and mtDNA degradation in lysosomes.
(A) Immunostaining of HeLa cells expressing the constitutive active protein RAB10Q68L-GFP labeled with α-VPS35. (B) Manders’ correlation coefficient between RAB10 and VPS35. (C and D) Confocal images of cells expressing WT RAB10-GFP, constitutive active RAB10Q68L-GFP, dominant negative RAB10T23N-GFP, in the steady state, and (D) expressing TWNKK319E-mCherry, labeled with α-TOM20. (E) Quantification of the mitochondrial morphology in RAB10 expressing cells (n = 3, >20 cells per replicate). (F and G) Cells expressing RAB10Q68L-GFP and (G) TWNKK319E-mCherry labeled with α-LAMP1 and α-dsDNA. Arrows depict RAB10-LAMP1-dsDNA foci. (H) Manders’ correlation coefficient between RAB10-GFP and LAMP1 and LAMP1 and dsDNA (n = 3, 10 images per replicate). (I) RAB10-GFP coimmunoprecipitation in the steady state and cells expressing TWNKK319E-mCherry with the lysosomal protein LAMP1. P values were calculated using one-way ANOVA with Tukey correction for multiple comparisons. Scale bars, 10 μm. Data are presented as means ± SEM.
Fig. 7.
Fig. 7.. VPS35 overexpression recovers mtDNA homoplasmy in Drosophila.
(A) Schematic representation of the approach to generate mtDNA deletion covering 2564 bp in larval epidermis. The restriction enzyme Afl III and the T4-DNA ligase directed to mitochondria were both expressed under the UAS promotor. A-58 Gal4 was used to drive the expression of the transgenes in the larval epidermis. WT, wild-type mtDNA. Illustration from NIAID NIH BIOART Source. (B) Bright-field images of transgenic L3 larvae used in this study. (C) CytB/ND5 ratio showing mtDNA heteroplasmy obtained by qPCR from total DNA extracts of L3 larvae (Control, n = 8; Epi-ΔmtDNA, n = 9). (D) mtDNA copy number quantification using ND5 gene and TUBB as a mitochondrial and nuclear gene, respectively (n = 9). (E and F) Western blot analysis (E) and quantification (F) of total protein extracts of L3 larvae for SDHB and ATPA. Ponceau S (Ps) was used as a loading control (Control, n = 3; Epi-ΔmtDNA, n = 4). (G and H) mtDNA copy number (G) and mtDNA heteroplasmy quantification (H) upon genetic manipulations (Control, n = 9; Epi-ΔmtDNA, n = 9; Epi-ΔmtDNA-Vps35OE, n = 9). (I) Electron microscopy images of larval epidermis. Mitochondria were pseudocolored in yellow and lysosomes in blue (dark content). Control refers to the A58Gal4/+ genotype (B) and specific UAS control in other quantifications. P values were calculated using the Student’s t test [(C), (D), and (F)] and one-way ANOVA with Tukey correction for multiple comparisons [(G) and (H)]. Scale bars, 1 mm (B) and 500 nm (I). Data are presented as means ± SEM.
Fig. 8.
Fig. 8.. VPS35 expression restores mitochondrial defects associated with ΔmtDNA.
(A) Venn diagram for genes differentially expressed (FDR of 5%) between control and Epi-ΔmtDNA shared through four differential expression methods (Limma-voom, EdgeR-QLF, EdgeR_LRT, and DESeq2) (n = 4 per genotype). (B) DAVID pathway enrichment analysis for genes differentially expressed. (C) Heatmap for log FC showing gene identities for the top four categories of differentially enriched pathways. (D) mRNA quantification of selected genes in Epi-ΔmtDNA and Epi-ΔmtDNA-Vps35OE larvae (n = 4 per genotype). Control refers to the A58-Gal4/+ genotype. P values were calculated using one-way ANOVA with Tukey correction for multiple comparisons. Data are presented as means ± SEM.
Fig. 9.
Fig. 9.. Proposed model for retromer function upon mtDNA stress.
The retromer enhances mitochondrial fragmentation and mtDNA turnover. mtDNA ejection occurs in a BAX-dependent manner, targeting RAB10-VPS35-positive lysosomes, and independent of MDVs. Stimulation of these pathways restores mitochondrial function and mitigates defects associated with mtDNA damage in vivo.

References

    1. Stewart J. B., Chinnery P. F., Extreme heterogeneity of human mitochondrial DNA from organelles to populations. Nat. Rev. Genet. 22, 106–118 (2021). - PubMed
    1. Sies H., Belousov V. V., Chandel N. S., Davies M. J., Jones D. P., Mann G. E., Murphy M. P., Yamamoto M., Winterbourn C., Defining roles of specific reactive oxygen species (ROS) in cell biology and physiology. Nat. Rev. Mol. Cell Biol. 23, 499–515 (2022). - PubMed
    1. Qian W., Van Houten B., Alterations in bioenergetics due to changes in mitochondrial DNA copy number. Methods 51, 452–457 (2010). - PubMed
    1. Torres-Gonzalez M., Gawlowski T., Kocalis H., Scott B. T., Dillmann W. H., Mitochondrial 8-oxoguanine glycosylase decreases mitochondrial fragmentation and improves mitochondrial function in H9C2 cells under oxidative stress conditions. Am. J. Physiol. Cell Physiol. 306, C221–C229 (2014). - PMC - PubMed
    1. Suomalainen A., Nunnari J., Mitochondria at the crossroads of health and disease. Cell 187, 2601–2627 (2024). - PubMed

LinkOut - more resources