. 2025 May:82:103611.
doi: 10.1016/j.redox.2025.103611. Epub 2025 Mar 24.

Absence of astrocytic ceruloplasmin reverses the senescence process with aging of learning and memory abilities

Affiliations

Absence of astrocytic ceruloplasmin reverses the senescence process with aging of learning and memory abilities

Zhong-Da Li et al. Redox Biol. 2025 May.

Abstract

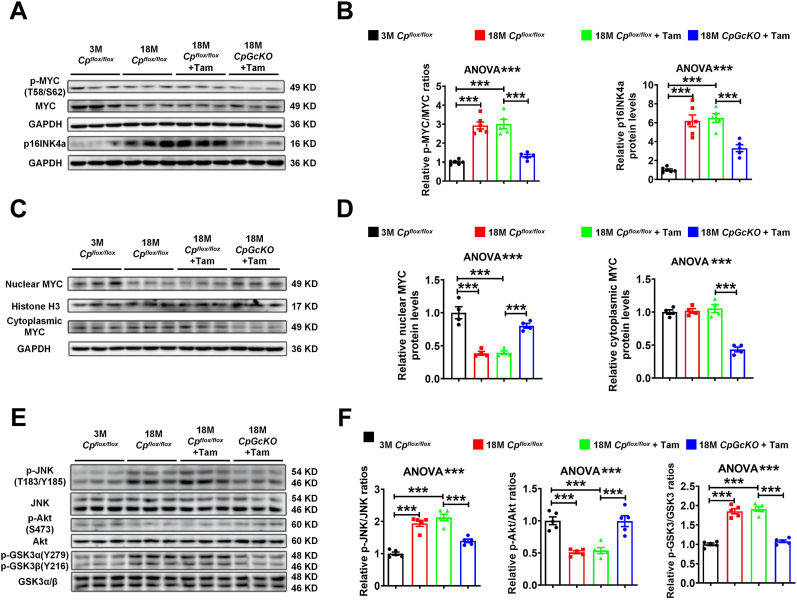
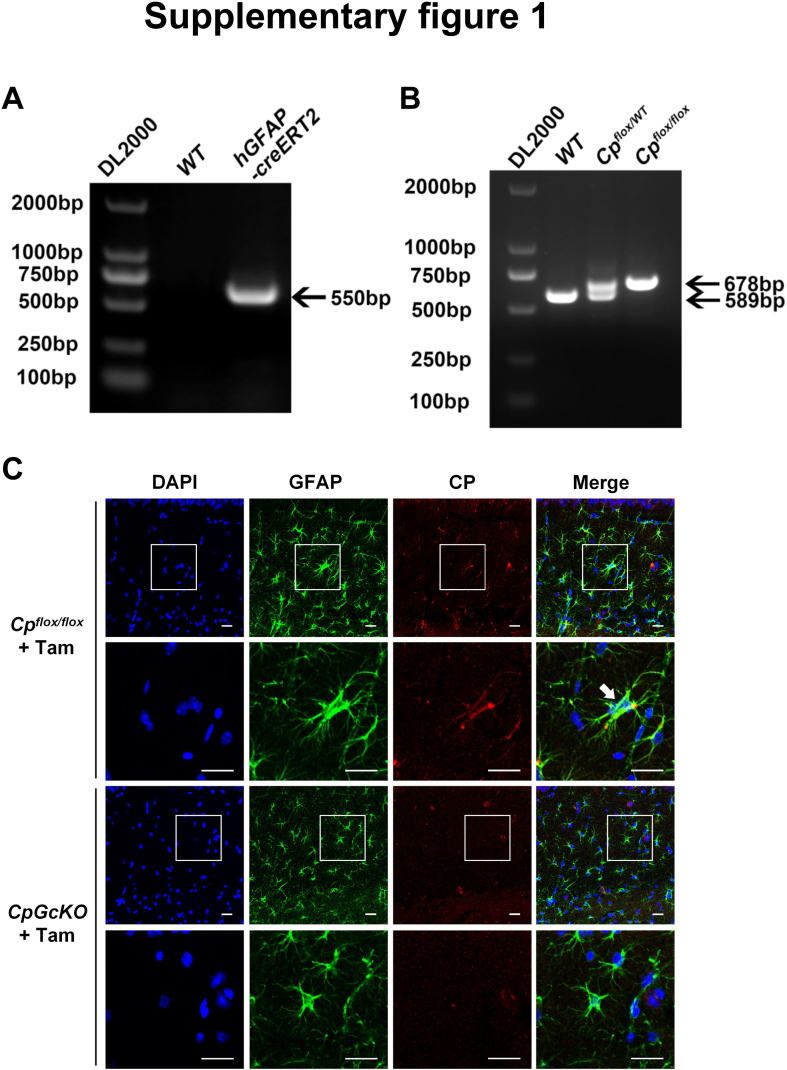
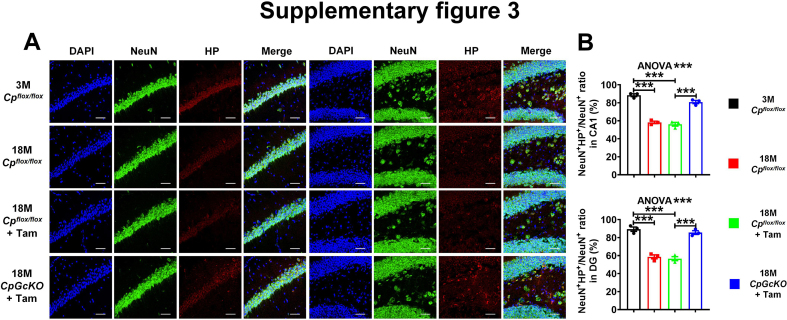
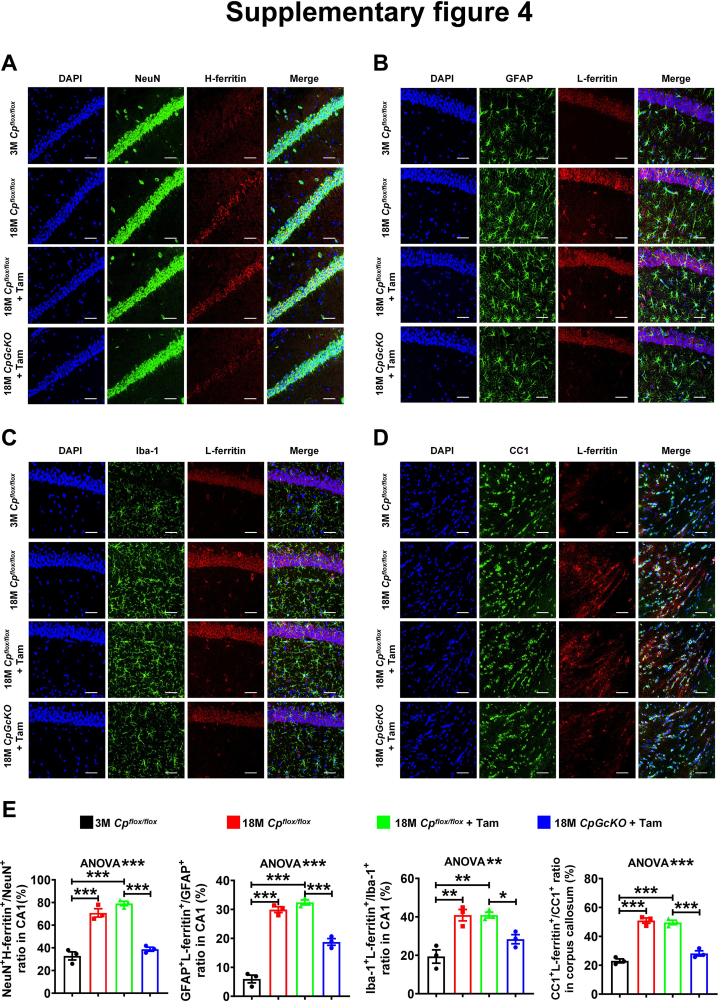
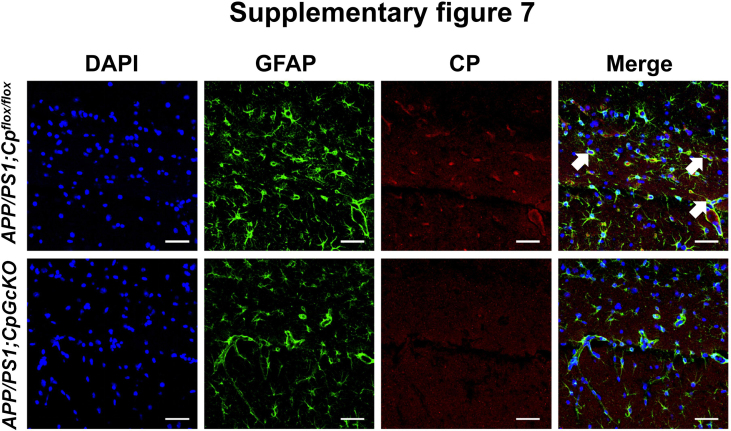
Ceruloplasmin (CP) is a multi-copper ferroxidase mainly synthesized by liver, secreted into the peripheral blood, playing a critical role in regulating the iron homeostasis. In the central nervous system (CNS), the CP expressed by astrocytes plays an important role in the transportation of iron from the blood across the blood-brain barrier (BBB) into the brain. Our previous study showed that conditional knockout of astrocytic CP with Cre-LoxP system (CpGfapcKO) not only improved the learning and memory abilities of elderly mice, but also impaired the learning and memory abilities of young mice. In order to further investigate the effects of CP on learning and memory with aging, we constructed mice model with tamoxifen-induced astrocyte specific knockout of CP, induced CP knockout at 12 months old, and observed the effects on mouse learning and memory at 18 months old. We were delighted to found that ablation of astrocytic CP by tamoxifen at 12 months old could similarly enhance the learning, memory and recognition abilities in 18-month-old mice. Iron deposition in the hippocampus associated with aging was mitigated, leading to a reduction in oxidative stress. The MAPK/JNK pathway exhibited attenuation, while the PI3K/Akt/GSK3 pathway showed enhancement. This combination is expected to result in the reduction of the phosphorylation level of MYC and the elevation of the nuclear translocation of MYC, which might then contribute to reduced cellular senescence. Additionally, the ROS/MAPK/Erk and ROS/MAPK/p38 pathways-dependent cell apoptosis in hippocampus was diminished. The hallmarks of Alzheimer's Disease (AD) were all significantly reduced. Ultimately, the alleviated cellular senescence along with the reduction in AD-related markers, coincided with an improvement in learning, memory, and recognition abilities. These findings further elucidated the role of CP in brain iron metabolism, offering a novel target and strategy for the prevention and treatment of neurodegenerative diseases, such as AD associated with aging.

Keywords: Alzheimer's disease; Astrocytes; Brain iron metabolism; Ceruloplasmin; Recognition; Senescence.


Conflict of interest statement

Declaration of competing interest The authors declare that they have no known competing financial interests or personal relationships that could have appeared to influence the work reported in this paper.

Figures

Fig. 1
Fig. 1
The CP gene expression was elevated with aging. (A) The expression data of the CP gene in the hippocampus among 20–39 y, 40–49 y, 50–59 y, 60–69 y and 70–79 y humans from GTEx data. The data were analyzed by Kruskal-Wallis test followed by Dunn's test (∗p < 0.05, ∗∗p < 0.01, ∗∗∗p < 0.001 vs. 20–39 y group). (B-D) Distribution and linear regression analysis of the hippocampal CP gene expression and the age of normal humans of total (B), female (C) and male (D) subjects (GEO: GSE28146, GSE29378, GSE36980, GSE48350 and GSE5281, ∗p < 0.05).
Fig. 2
Fig. 2
The hippocampal senescence was alleviated after tamoxifen-induced astrocytic CP knockout. (A) The reproduction and experiment of hGFAP-creERT2; Cpflox/flox mice. hGFAP-creERT2 transgenic mice were hybridized with Cpflox/flox mice, ultimately breeding mice possessing both hGFAP-creERT2 recombinase and Cpflox/flox (hGFAP-creERT2; Cpflox/flox mice) at least two generations later. At the age of 12 months, tamoxifen was injected intraperitoneally for 5 consecutive days (100 mg/kg) to induce astrocytic CP knockout, and the experiment was conducted at the age of 18 months (at this time, it is called 18 M CpGcKO + Tam mice). (B–C) Latency time (B) and distance (C) to the platform from the 1st day to the 5th day were recorded by MWM during the training trials (n = 10 for 3 M Cpflox/flox, 18 M Cpflox/flox and 18 M Cpflox/flox + Tam groups, n = 9 for 18 M CpGcKO + Tam group, and the data were analyzed by two-way ANOVA followed by the Bonferroni test. (D) After the training trails of 5 days, during the pole test at 6th day, the platform was removed and the frequency of the mice passed the area of hidden platform was recorded (n = 10 for 3 M Cpflox/flox, 18 M Cpflox/flox and 18 M Cpflox/flox + Tam groups, n = 9 for 18 M CpGcKO + Tam group). (E-F) The exploration time spent for the familiar and novel object (E) and the index of NOR (F) recorded by the NOR test (n = 8). (G) The hippocampal senescence detected by β-Galactosidase staining. Scale bar = 1 mm. (H) The levels of p16INK4a, p19ARF, p21Cip1, p15INK4b, p18INK4c, p19INK4d and p27Kip1 mRNAs in hippocampus measured by qPCR (n = 4). The data in charts (D), (F) and (H) were analyzed by one-way ANOVA followed by Fisher's LSD test (D, F) or Tukey's test (H), whereas the data in chart (E) were analyzed by paired two tailed t-test. All data are presented as the mean ± SEM, ∗p < 0.05, ∗∗p < 0.01, ∗∗∗p < 0.001, ns (no significant difference).
Fig. 3
Fig. 3
The Akt/GSK3/MYC/p16INK4a and MAPK/JNK/MYC/p16INK4a pathways were altered in aged mice after tamoxifen-induced astrocytic CP knockout. (A-B) p-MYC (T58/S62), MYC expression level and p16INK4a expression level in hippocampus measured by Western blot. The quantification of (A) was presented in graph (B) (n = 6 for 3 M Cpflox/flox and 18 M Cpflox/flox groups, n = 5 for 18 M Cpflox/flox + Tam and 18 M CpGcKO + Tam groups). (C-D) Nuclear and cytoplasmic MYC levels in hippocampus measured by Western blot. The quantification of (C) was presented in graph (D) (n = 4). (E-F) p-JNK (T183/Y185), p-Akt (S473) and p-GSK3α (Y279) + p-GSK3β (Y216) levels in hippocampus measured by Western blot. The quantification of (E) was presented in graph (F) (n = 5). All data were analyzed by one-way ANOVA followed by Tukey's test, and presented as the mean ± SEM, ∗∗∗p < 0.001.
Fig. 4
Fig. 4
The detection of iron metabolism in hippocampus of aged mice after tamoxifen-induced astrocytic CP knockout. (A-B) The levels of H-ferritin, L-ferritin, TfR1, FPN1, DMT1(+IRE), HP and DMT1(-IRE) in hippocampus detected by Western blot. Quantification of (A) are shown in chart (B) (n = 6 for 3 M Cpflox/flox and 18 M Cpflox/flox groups, n = 5 for 18 M Cpflox/flox + Tam and 18 M CpGcKO + Tam groups). (C) Iron contents and distribution in hippocampus measured by μ-XRF. All data were analyzed by one-way ANOVA followed by Tukey's test, and presented as the mean ± SEM, ∗∗∗p < 0.001, ns (no significant difference).
Fig. 5
Fig. 5
The levels of ferritin in neurons, astrocytes, microglia and oligodendrocytes in DG region of hippocampus of the aged mice after tamoxifen-induced astrocytic CP knockout. (A) The co-localization of NeuN and H-ferritin in DG of hippocampus. The ratio of NeuN+H-ferritin+ cells to the NeuN+ cells in DG of hippocampus (A) was shown in chart (E) (n = 4). (B) The co-localization of GFAP and L-ferritin in DG of hippocampus. The ratio of GFAP+L-ferritin+ cells to the GFAP+ cells in DG of hippocampus (B) was shown in chart (E) (n = 3). (C) The co-localization of Iba-1 and L-ferritin in DG of hippocampus. The ratio of Iba-1+L-ferritin+ cells to the Iba-1+ cells in DG of hippocampus (C) was shown in chart (E) (n = 3). (D) The co-localization of CC1 and L-ferritin in hippocampus. The ratio of CC1+L-ferritin+ cells to the CC1+ cells in hippocampus(D) was shown in chart (E) (n = 3). DAPI was used for nuclear staining. Scale bar = 50 μm. All data were analyzed by one-way ANOVA followed by Tukey's test, and presented as the mean ± SEM, ∗∗p < 0.01, ∗∗∗p < 0.001.
Fig. 6
Fig. 6
MAPK/Erk, MAPK/p38 pathways, cell apoptosis and ferroptosis-related protein measurement in hippocampus. (A-B) p-Erk1/2 (T202/Y204) level, p-p38 (T180/Y182) level, 4-HNE expression, ACSL4 expression, GPX4 expression and Cleaved-caspase3 level in hippocampus measured by Western blot. The quantification of (A) was presented in graph (B) (For Cleaved-caspase3, n = 5; for others, n = 3). (C-E) TUNEL staining in the CA1 (C) and DG (D) regions of hippocampus. The number of apoptotic cells was quantified and presented in graph (E) (n = 3). DAPI was used for nuclear staining. Scale bar = 50 μm. All data were analyzed by one-way ANOVA followed by Tukey's test, and presented as the mean ± SEM, ∗∗p < 0.01, ∗∗∗p < 0.001, ns (no significant difference).
Fig. 7
Fig. 7
The levels of APP, Aβ oligomers and Tau phosphorylation in hippocampus. (A) APP and Aβ oligomer levels in hippocampus, as measured by Western blot analysis. The quantification of the data shown in (A) was presented in the graphs in (D) (APP) and (E) (Aβ oligomers) (n = 4). (B) Tau phosphorylation (S396, T181 and S404) levels in hippocampus, as determined by Western blot analysis. The quantification of the data shown in (B) was presented in the graphs in (F–H) (n = 3). (C) Immunofluorescence staining of p-Tau (S396) in hippocampus. The quantification of the covered areas of p-Tau (S396) was shown in chart (I) (n = 3). DAPI was used for nuclear staining. Scale bar = 1 mm. All data were analyzed by one-way ANOVA followed by Tukey's test, and presented as the mean ± SEM, ∗p < 0.05, ∗∗p < 0.01, ∗∗∗p < 0.001.
Fig. 8
Fig. 8
The AD hallmarks were alleviated after tamoxifen-induced astrocytic CP knockout in APP/PS1 mice. (A) The strategy of APP/PS1; hGFAP-creERT2; Cpflox/flox mice breeding. hGFAP-creERT2 transgenic mice and Cpflox/flox mice were used for hybridization, and hGFAP-creERT2; Cpflox/WT mice were generated. At the same time, APP/PS1 transgenic mice and Cpflox/flox mice were also used for hybridization, and the APP/PS1; Cpflox/WT mice were generated. Then we used the hGFAP-creERT2; Cpflox/WT mice to hybridize with APP/PS1; Cpflox/WT mice, and the APP/PS1; hGFAP-creERT2; Cpflox/flox mice were obtained. At the age of 6 months, tamoxifen was injected intraperitoneally for 5 consecutive days (100 mg/kg) to induce astrocytic CP knockout, and the experiment was conducted at the age of 8 months (at this time, it is called APP/PS1; CpGcKO mice). (B–C) Latency time (B) and distance (C) to the platform from the 1st day to the 5th day were recorded by MWM (n = 7 per group). (D) After the training trails of 5 days, during the pole test at 6th day, the platform was removed and the frequency of the mice passed the area of hidden platform was recorded. (E-G) APP and Aβ oligomers levels in hippocampus measured by Western blot. The quantifications of (E) were presented in graph (F) and (G) (n = 3). (H, J) Immunofluorescence staining of Aβ in hippocampus, and the quantified data of the number of Aβ plaque in (H) were shown in (J) (n = 3), DAPI was used for nuclear staining. Scale bar = 1 mm. (I) Hippocampal iron contents and distribution measured by μ-XRF. The data were analyzed by two-way ANOVA followed by the Bonferroni test for (B, C), and one-way ANOVA followed by Fisher's LSD test for (D) or Tukey's test for (F, G, J). All data are presented as the mean ± SEM, ∗p < 0.05, ∗∗p < 0.01, ∗∗∗p < 0.001.
Fig. 9
Fig. 9
The detection of iron metabolism-related protein, Erk/apoptosis, p38/apoptosis, Akt/GSK3/MYC/p16INK4a and JNK/MYC/p16INK4a pathways in tamoxifen-induced astrocytic CP knockout in APP/PS1 mice. (A) The levels of hippocampal TfR1, FPN1, L-ferritin, DMT1(+IRE) and H-ferritin detected by Western blot. (B) Quantification of graph (A) (n = 3). (C) p-Erk1/2 (T202/Y204) level, p-p38 (T180/Y182) level, Bcl-2 expression, Bax expression, Cleaved-caspase3 level and 4-HNE expression in hippocampus measured by Western blot. (D) Quantification of graph (C) (n = 3). (E) p-JNK (T183/Y185) level, p-Akt (S473) level, p-GSK3α (Y279) + p-GSK3β (Y216) level, p-MYC (T58/S62) level and p16INK4a expression level in hippocampus measured by Western blot. (F) Quantification of graph (E) (n = 3). All data were analyzed by one-way ANOVA followed by Tukey's test, and presented as the mean ± SEM, ∗p < 0.05, ∗∗p < 0.01, ∗∗∗p < 0.001, ns (no significant difference).
Fig. 10
Fig. 10
Schematic diagram of the mechanism of tamoxifen-induced astrocytic CP knockout on learning and memory improvement. Tamoxifen-induced astrocytic CP knockout inhibits the FPN1/CP iron influx pathway into the brain, alleviating iron accumulation in the brain. Therefore, the levels of oxidative stress decreased. The MAPK/JNK and PI3K/Akt/GSK3 pathways are altered, which may lead to a down-regulation of phosphorylation of MYC (T58/S62), with the nuclear translocation of MYC up-regulated, p16INK4a expression inhibited and senescence mitigated. AD-like hallmarks, such as Aβ aggregation and Tau phosphorylation, are also reduced, which may be the result of attenuated iron deposition. Finally, the learning and memory abilities are improved during old age.
figs1
figs1
figs2
figs2
figs3
figs3
figs4
figs4
figs5
figs5
figs6
figs6
figs7
figs7
figs8
figs8

References

    1. Holmberg C.G., Laurell C.B. Investigations in serum copper; nature of serum copper and its relation to the iron-binding protein in human serum. Acta Chem. Scand. 1947;1:944–950. - PubMed
    1. Holmberg C.G., Laurell C.B. Histaminolytic activity of a copper protein in serum. Nature. 1948;161:236. - PubMed
    1. Patel B.N., David S. A novel glycosylphosphatidylinositol-anchored form of ceruloplasmin is expressed by mammalian astrocytes. J. Biol. Chem. 1997;272:20185–20190. - PubMed
    1. McCarthy R.C., Kosman D.J. Iron transport across the blood-brain barrier: development, neurovascular regulation and cerebral amyloid angiopathy. Cell. Mol. Life Sci. 2015;72:709–727. - PMC - PubMed
    1. Patel B.N., Dunn R.J., Jeong S.Y., Zhu Q., Julien J.P., David S. Ceruloplasmin regulates iron levels in the CNS and prevents free radical injury. J. Neurosci. 2002;22:6578–6586. - PMC - PubMed