. 2025 May:115:105667.
doi: 10.1016/j.ebiom.2025.105667. Epub 2025 Apr 3.

Single-cell multi-omics profiling uncovers the immune heterogeneity in HIV-infected immunological non-responders

Affiliations

Single-cell multi-omics profiling uncovers the immune heterogeneity in HIV-infected immunological non-responders

Xiaosheng Liu et al. EBioMedicine. 2025 May.

Abstract

Background: Immunological non-responders (INRs) are people living with HIV-1 who fail to achieve full immune reconstitution despite long-term effective antiretroviral therapy (ART). This incomplete recovery of CD4+ T cells increase the risk of opportunistic infections and non-AIDS-related morbidity and mortality. Understanding the mechanisms driving this immune dysfunction is critical for developing targeted therapies.

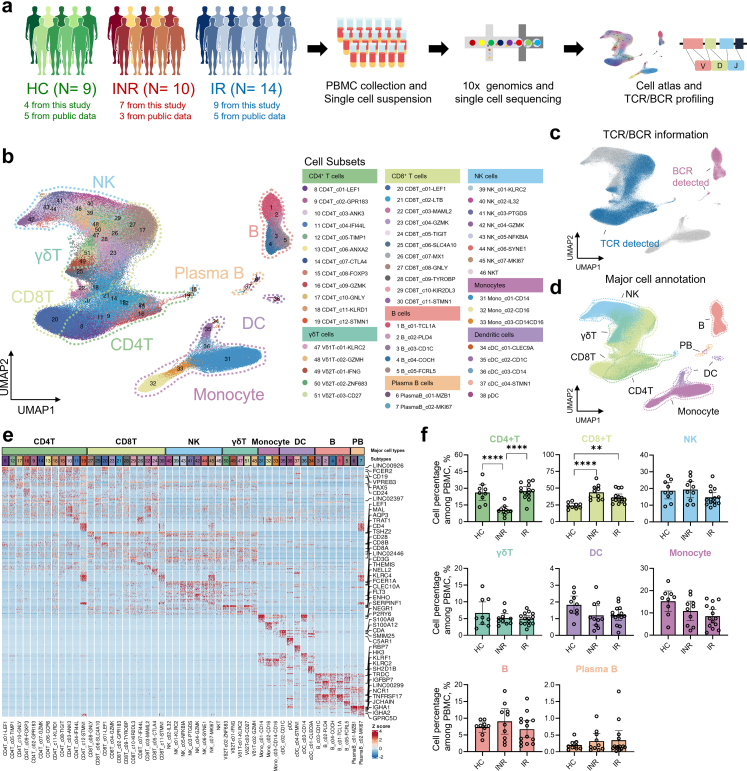
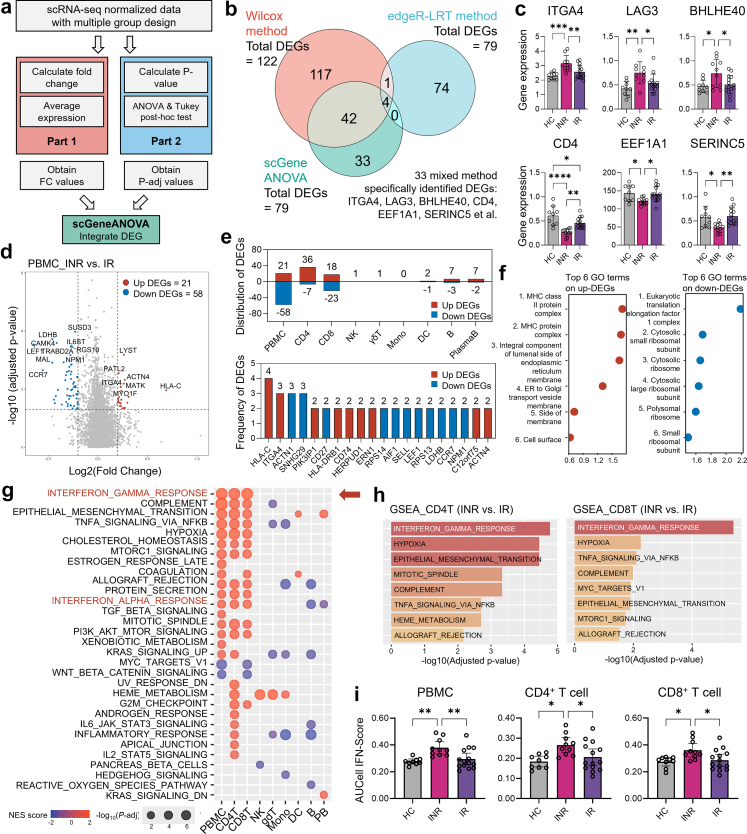
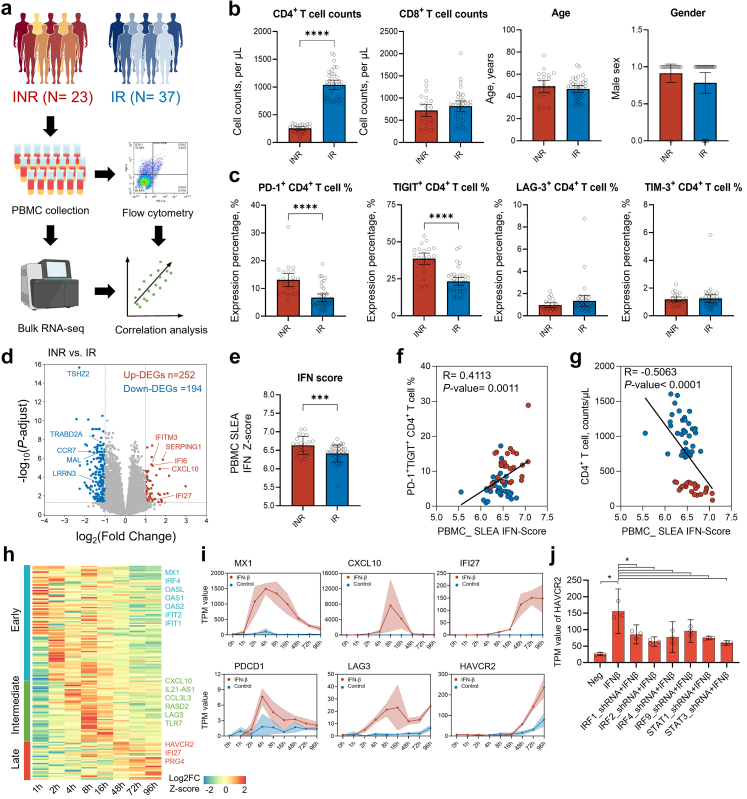
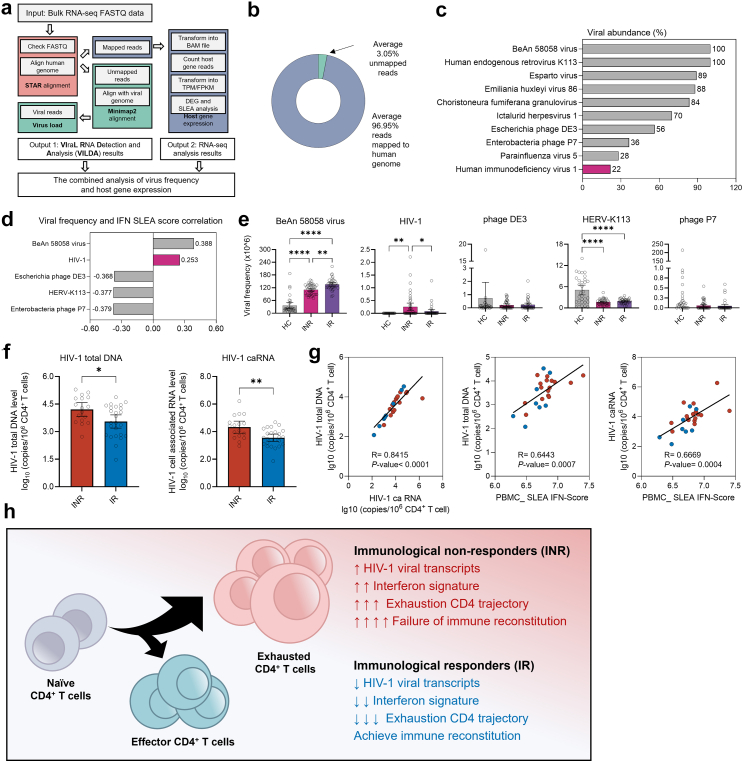
Methods: We performed single-cell RNA sequencing (scRNA-seq) and single-cell VDJ sequencing (scVDJ-seq) on peripheral blood mononuclear cells (PBMCs) from INRs, immune responders (IRs), and healthy controls (HCs). We developed scGeneANOVA, a novel mixed model differential gene analysis tool, to detect differentially expressed genes and pathways. In addition, we developed the Viral Identification and Load Detection Analysis (VILDA) tool to quantify HIV-1 transcripts and investigate their relationship with interferon (IFN) pathway activation.

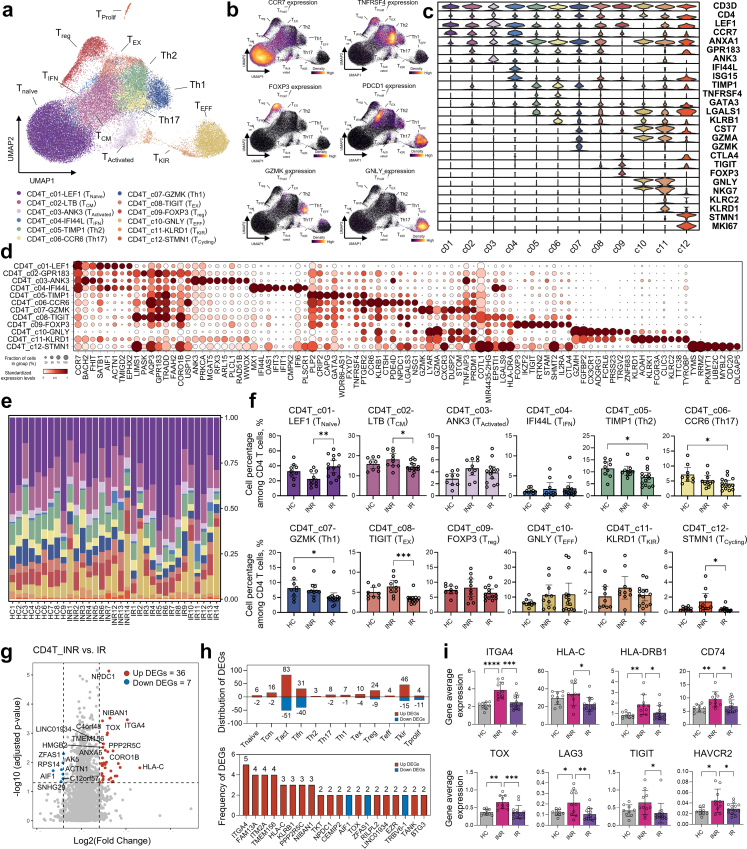
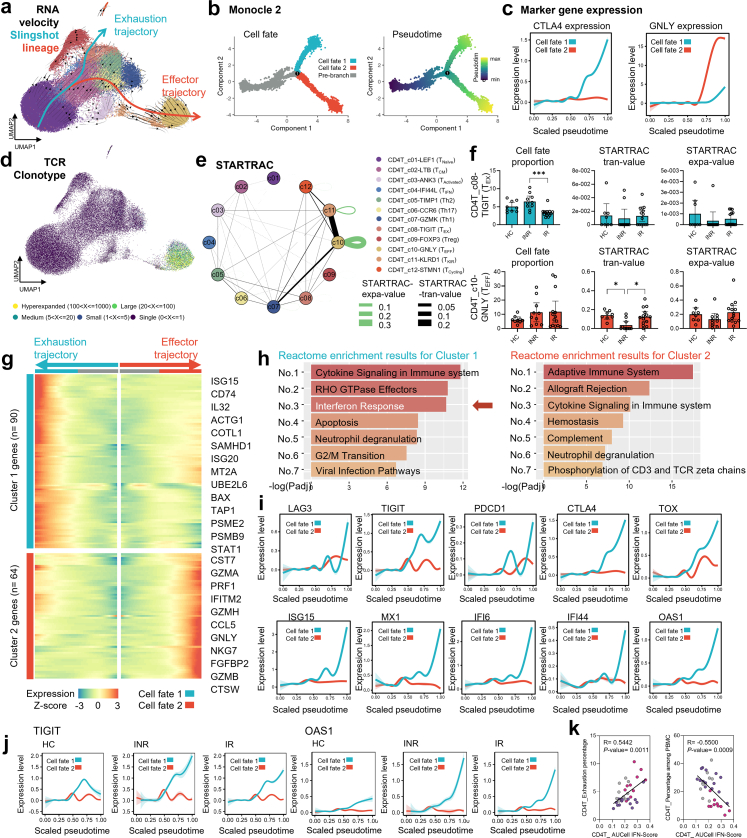
Findings: Our analysis revealed that INRs exhibit a dysregulated IFN response, closely associated with CD4+ T cell exhaustion and immune recovery failure. The scGeneANOVA tool identified critical genes and pathways that were missed by traditional analysis methods, while VILDA showed higher levels of HIV-1 transcripts in INRs, which may drive the heightened IFN response. These findings support a potential contribution of IFN signalling in INR-related immune dysfunction.

Interpretation: Our study provides new insights into the pathogenic mechanisms behind immune recovery failure in INRs, suggesting that IFN signalling might be involved in the development of CD4+ T cell exhaustion. The identification of key genes and pathways offers potential biomarkers and therapeutic targets for improving immune recovery in this vulnerable population.

Funding: This study was supported by the grants from Special Research Fund for the Central High-level Hospitals of Peking Union Medical College Hospital (Grant No. 2022-PUMCH-D-008), Chinese Academy of Medical Sciences (CAMS) Innovation Fund for Medical Sciences (Grant No. 2021-I2M-1-037), National Key Technologies R&D Program for the 13th Five-year Plan (Grant No. 2017ZX10202101-001). The funders played no role in the design, experiment conduction, data analysis and preparation of the manuscript of this work.

Keywords: Acquired immunodeficiency syndrome; CD4(+) T cells; Human immunodeficiency virus-1; Immunological non-responders; Interferon; Single cell RNA sequencing.


Conflict of interest statement

Declaration of interests The authors have declared that no conflict of interest exists.

Figures

Fig. 1
Fig. 1
Characterization of the immune cell profiles of INRs by scRNA/VDJ-seq. (a) Study design overview showing the cohort composition: healthy controls (HC, N = 9), immunological non-responders (INR, N = 10), and immunological responders (IR, N = 14). PBMCs were collected and subjected to single-cell RNA and TCR/BCR sequencing. (b) UMAP visualization of the minor cell subsets identified from the scRNA-seq data. The right panel details the specific cell subsets identified within each minor cell type. (c) UMAP plot showing the detection of TCR and BCR sequences, highlighting cells with detectable TCR and BCR. (d) UMAP plot annotated with major cell types, demonstrating the clustering of different immune cell populations. (e) Heatmap showing the expression of key marker genes across different immune cell subsets. Each column represents a single cell, and each row represents a gene, with the colour intensity indicating the expression level. (f) Bar plots comparing the percentage of each major cell type among total PBMCs across HC, INR, and IR groups. Statistical significance was determined using ANOVA followed by Tukey post-hoc tests (∗P < 0.05, ∗∗P < 0.01, ∗∗∗P < 0.001).
Fig. 2
Fig. 2
scGeneANOVA analysis and GSEA pathway enrichment analysis. (a) Workflow diagram summarizing the multi-level scRNA-seq data analysis approach, including single-cell and pseudo-bulk methods to identify differentially expressed genes (DEGs). (b) Venn diagram showing the overlap of DEGs identified by single-cell, pseudo-bulk, and mixed methods. A total of 33 DEGs were uniquely identified using the mixed method. (c) Box plots showing the expression levels of selected DEGs in PBMCs across HC, INR, and IR groups. Statistical significance was determined using ANOVA followed by Tukey post-hoc tests (∗P < 0.05, ∗∗P < 0.01, ∗∗∗P < 0.001). (d) Volcano plot of DEGs in PBMCs between INR and IR groups, highlighting upregulated (red) and downregulated (blue) genes. The right panel shows the distribution of DEGs across different cell types. (e) Bar plots illustrating the distribution and frequency of DEGs across various cell types. The distribution plot of DEGs (upper panel) shows the number of identified DEGs in each cell type, while the frequency plot of DEGs (lower panel) represents the occurrence frequency of the identified DEGs across different cell types. Up-regulated DEGs are labelled in red colour, and down-regulated DEGs are labelled in bule colour. (f) Top 6 enriched Gene Ontology (GO) terms for upregulated (left) and downregulated (right) DEGs in INR vs. IR comparisons, with terms related to immune response and cellular components. (g) Heatmap showing the Normalized Enrichment Score (NES) of various pathways in PBMCs and specific cell subsets between INR and IR groups. Pathways like interferon gamma response and epithelial mesenchymal transition are prominently enriched. (h) GSEA results for CD4+ T cells and CD8+ T cells between INR and IR groups, displaying significant enrichment of interferon gamma response and other pathways. (i) Bar plots comparing the AUCell interferon score across PBMCs, CD4+ T cells, and CD8+ T cells in HC, INR, and IR groups. Statistical significance was determined using ANOVA followed by Tukey post-hoc tests (∗P < 0.05, ∗∗P < 0.01).
Fig. 3
Fig. 3
Extensive heterogeneity in CD4+ T cell subclusters of INRs. (a) UMAP plot showing the clustering of CD4+ T cell subclusters. Each subset is colour-coded and labelled accordingly. (b) UMAP plots showing the expression of specific marker genes across the identified CD4+ T cell subclusters, with higher expression levels indicated by darker colours. (c) Violin plots showing the distribution of key marker gene expressions across different CD4+ T cell subclusters. (d) Heatmap displaying the expression of selected marker genes across various CD4+ T cell subclusters. Each row represents a gene, and each column represents a cell, with colour intensity indicating expression levels. (e) Stacked bar plots showing the proportion of each CD4+ T cell subcluster among total CD4+ T cells across HC, INR, and IR groups. Each bar represents a group, and colours represent different subclusters. (f) Bar plots comparing the percentage of specific CD4+ T cell subclusters among total CD4+ T cells across HC, INR, and IR groups. Statistical significance was determined using ANOVA followed by Tukey post-hoc tests (∗P < 0.05, ∗∗P < 0.01, ∗∗∗P < 0.001). (g) Volcano plot of DEGs in CD4+ T cells between INR and IR groups, highlighting upregulated (red) and downregulated (blue) genes. Key genes are labelled, including ITGA4 and HLA-C. (h) Bar plots illustrating the distribution and frequency of DEGs across various CD4+ T cell subclusters. The distribution plot of DEGs (upper panel) shows the number of identified DEGs in each cell type, while the frequency plot of DEGs (lower panel) represents the occurrence frequency of the identified DEGs across different cell types. Up-regulated DEGs are labelled in red colour, and down-regulated DEGs are labelled in bule colour. (i) Box plots showing the expression levels of selected DEGs in CD4+ T cells across HC, INR, and IR groups. Statistical significance was determined using ANOVA followed by Tukey post-hoc tests (∗P < 0.05, ∗∗P < 0.01).
Fig. 4
Fig. 4
Exhaustion tendency and IFN signatures in CD4+ T cells of INRs. (a) RNA velocity plot with Slingshot lineage tracing showing the exhaustion and effector trajectories of CD4+ T cells. Each cell is colour-coded according to its predicted trajectory. (b) Trajectory analysis using Monocle2, depicting cell fate determination (left) and pseudotime (right) of CD4+ T cells along the exhaustion and effector lineage. (c) Expression of selected marker genes (e.g., CTLA4 and GNLY). during the increased pseudotime along two different lineages. (d) UMAP plots showing the distribution of TCR clonotypes within CD4+ T cells. Each clonotype is colour-coded and labelled accordingly. (e) Network diagram illustrating the TCR information among different CD4+ T cell clusters, with self-lines representing expansion score and the interaction-lines representing transition score. (f) Bar plots comparing the percentage, the STARTRAC expansion score and the STARTRAC transition score of CD4T_c08-TIGIT (TEX) and CD4T_c10-GNLY (TEFF) across HC, INR, and IR groups. Statistical significance was determined using ANOVA followed by Tukey post-hoc tests (∗P < 0.05, ∗∗P < 0.01, ∗∗∗P < 0.001). (g) Heatmap displaying the expression dynamics of key genes along the exhaustion and effector trajectories in CD4+ T cells. Each row represents a gene, and colour intensity indicates expression levels. (h) Reactome pathway enrichment results for two major clusters (Cluster 1: exhaustion trajectory; Cluster 2: effector trajectory) in CD4+ T cells. (i and j) Line plots showing the expression levels of selected genes along the pseudotime in CD4+ T cells. Lines represent different cell fates (Cell fate 1: exhaustion, Cell fate 2: effector). (k) Scatter plots showing the correlation between exhaustion percentage of CD4+ T cells and PBMC AUCell interferon score (left) and CD4+ T cell percentages (right) with the respective correlation coefficients and P-values.
Fig. 5
Fig. 5
Immune dysfunction in INRs associated with IFN signalling and CD4+ T cell exhaustion. (a) Schematic of the study design. Peripheral blood mononuclear cells (PBMCs) were collected from 23 INRs and 37 immunological responders (IRs). Flow cytometry and bulk RNA-seq were performed, followed by correlation analysis. (b) Comparison of CD4+ and CD8+ T cell counts, age, and gender differences between INRs and IRs. (c) Comparison of the expression of PD-1, TIGIT, LAG-3, and TIM-3 in CD4+ T cells between INRs and IRs. (d) Volcano plot depicting differentially expressed genes (DEGs) between INRs and IRs. (e) Comparison of the Sample-Level Enrichment Analysis (SLEA) Z-score for IFN genes between INRs and IRs. (f) Scatter plots showing the correlation between PBMC IFN score and exhaustion percentage of CD4+ T cells. (g) Scatter plots showing the correlation between PBMC IFN score and CD4+ T cell counts. For panels (f) and (g), the red dots represent for INRs, and bule dots represent for IRs. (h) Heatmap showing the expression patterns of DEGs across early, intermediate, and late time points in IFN-β-treated human primary CD4+ T cells. (i) Temporal expression profiles of selected interferon-stimulated genes (ISGs) (MX1, CXCL10, IFI27) and exhaustion markers (PDCD1, LAG3, HAVCR2) across different time points. Red represents the IFN-β-treated group, and blue represents the control group. (j) shRNA-mediated knockdown of IRF and STAT family transcription factors demonstrating the reduction of HAVCR2 expression following IFN-β treatment. For panels (h), (i), (j), the transcriptomic raw data were obtained from GSE195542. For panels (b), (c), (e), and (j), data are represented as mean ± SD. Group differences were analysed using an unpaired t-test with two-tailed P-values. Significance levels are indicated as follows: ∗P < 0.05, ∗∗P < 0.01, ∗∗∗P < 0.001, and ∗∗∗∗P < 0.0001.
Fig. 6
Fig. 6
Viral identification using VILDA and correlation with IFN expression profile in INRs. (a) Schematic workflow of the Viral Identification and Load Detection Analysis (VILDA) tool. Bulk RNA-seq FASTQ data were processed to map reads to the human genome using STAR alignment, with unmapped reads subsequently aligned to viral genomes using Minimap2. The analysis outputs included both viral identification and host gene expression, allowing for combined analysis of viral frequency and host gene expression. (b) Pie chart showing the average percentage of reads mapped to the human genome (96.95%) and unmapped reads (3.05%) from the RNA-seq data. (c) Bar chart displaying the viral abundance (percentage) of the top 10 viruses detected by VILDA across all samples. (d) Correlation between viral frequency and IFN SLEA (Sample- Level Enrichment Analysis) Z-score, showing that BeAn 58,058 virus and HIV-1 positively correlate with IFN signalling, while Escherichia phage DE3, HERV-K113, and Enterobacteria phage P7 negatively correlate with IFN signalling. (e) Comparison of viral frequency among healthy controls (HCs), INRs, and immunological responders (IRs) for BeAn 58,058 virus, HIV-1, Escherichia phage DE3, HERV-K113, and Enterobacteria phage P7. (f) Quantification of HIV-1 total DNA and cell-associated RNA (caRNA) levels in INRs and IR. Data are represented as mean ± SD. Group differences were analysed using an unpaired t-test with two-tailed P-values. Significance levels are indicated as follows: ∗P < 0.05, ∗∗P < 0.01, ∗∗∗P < 0.001, and ∗∗∗∗P < 0.0001. (g) Scatter plots showing the correlation between HIV-1 total DNA, HIV-1 caRNA levels, and PBMC_SLEA IFN-Score. The red dots represent for INRs, and bule dots represent for IRs. (h) Graphical scheme of revealing the role of HIV-1 transcripts and IFN signature in CD4+ T cell differentiation of INRs.

Similar articles

References

    1. Maartens G., Celum C., Lewin S.R. HIV infection: epidemiology, pathogenesis, treatment, and prevention. Lancet. 2014;384(9939):258–271. - PubMed
    1. Doitsh G., Greene W.C. Dissecting how CD4 T cells are lost during HIV infection. Cell Host Microbe. 2016;19(3):280–291. - PMC - PubMed
    1. Li T.S., Tubiana R., Katlama C., Calvez V., Ait Mohand H., Autran B. Long-lasting recovery in CD4 T-cell function and viral-load reduction after highly active antiretroviral therapy in advanced HIV-1 disease. Lancet. 1998;351(9117):1682–1686. - PubMed
    1. Autran B., Carcelain G., Li T.S., et al. Positive effects of combined antiretroviral therapy on CD4+ T cell homeostasis and function in advanced HIV disease. Science. 1997;277(5322):112–116. - PubMed
    1. Yan L., Xu K., Xiao Q., et al. Cellular and molecular insights into incomplete immune recovery in HIV/AIDS patients. Front Immunol. 2023;14 - PMC - PubMed

MeSH terms