. 2025 Jul;75(2):100016.
doi: 10.1016/j.jphyss.2025.100016. Epub 2025 Mar 28.

Changes in adrenoceptor expression level contribute to the cellular plasticity of glioblastoma cells

Affiliations

Changes in adrenoceptor expression level contribute to the cellular plasticity of glioblastoma cells

Yutaro Asaka et al. J Physiol Sci. 2025 Jul.

Abstract

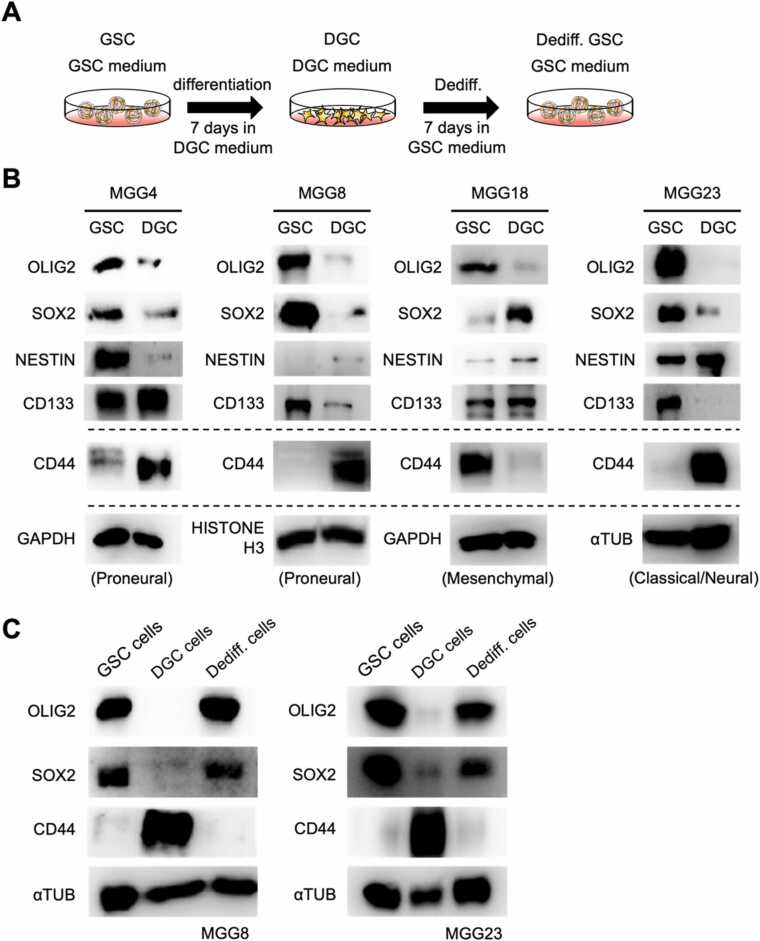
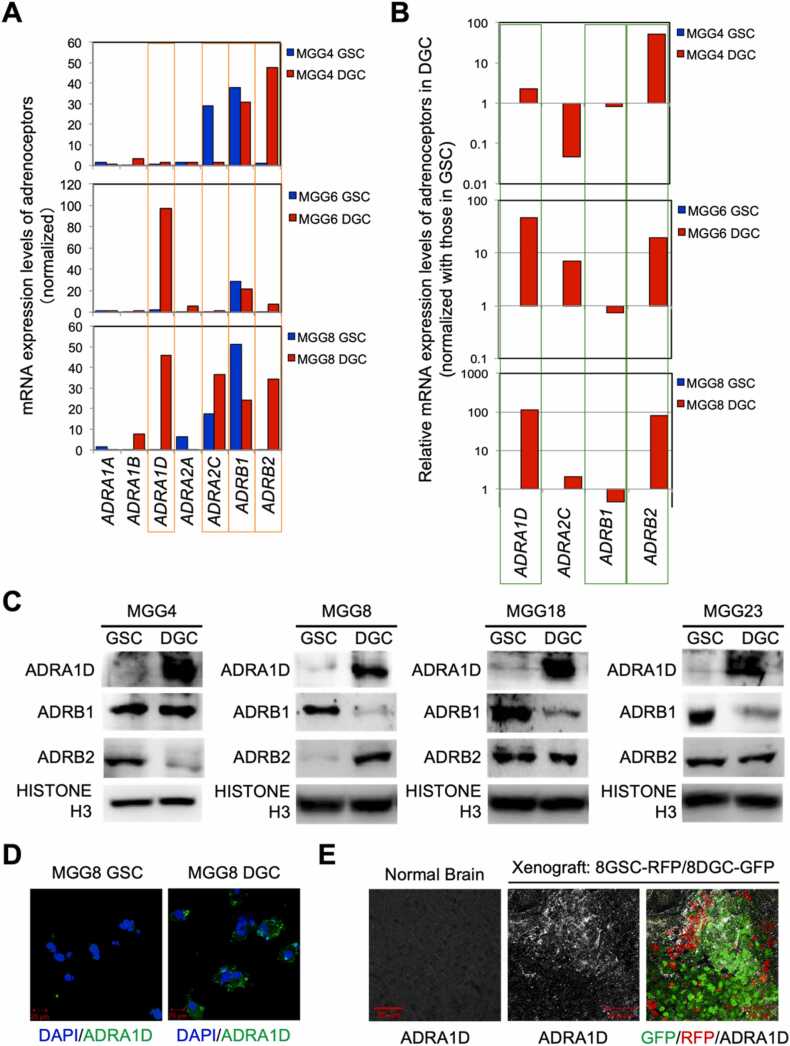
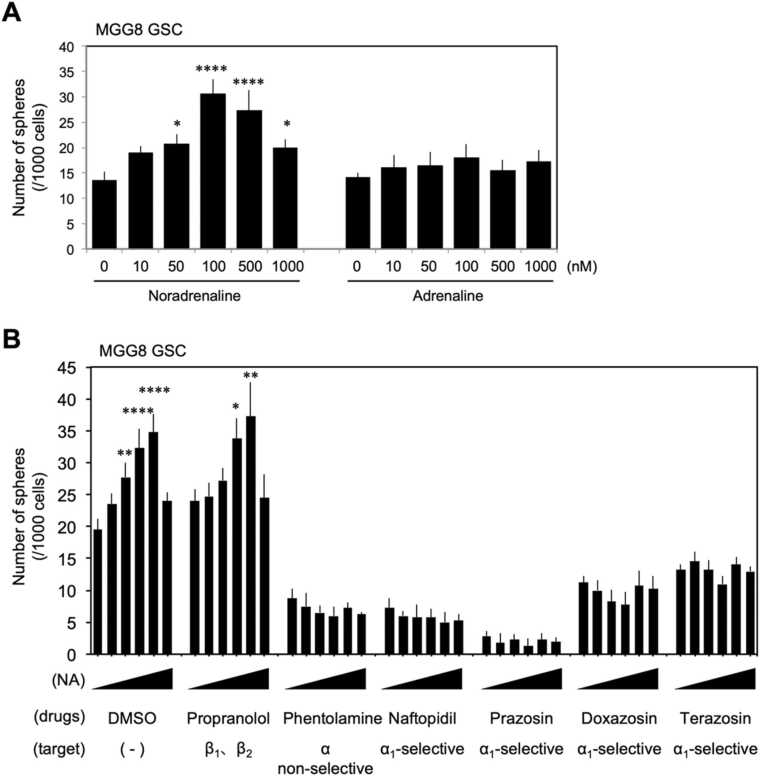
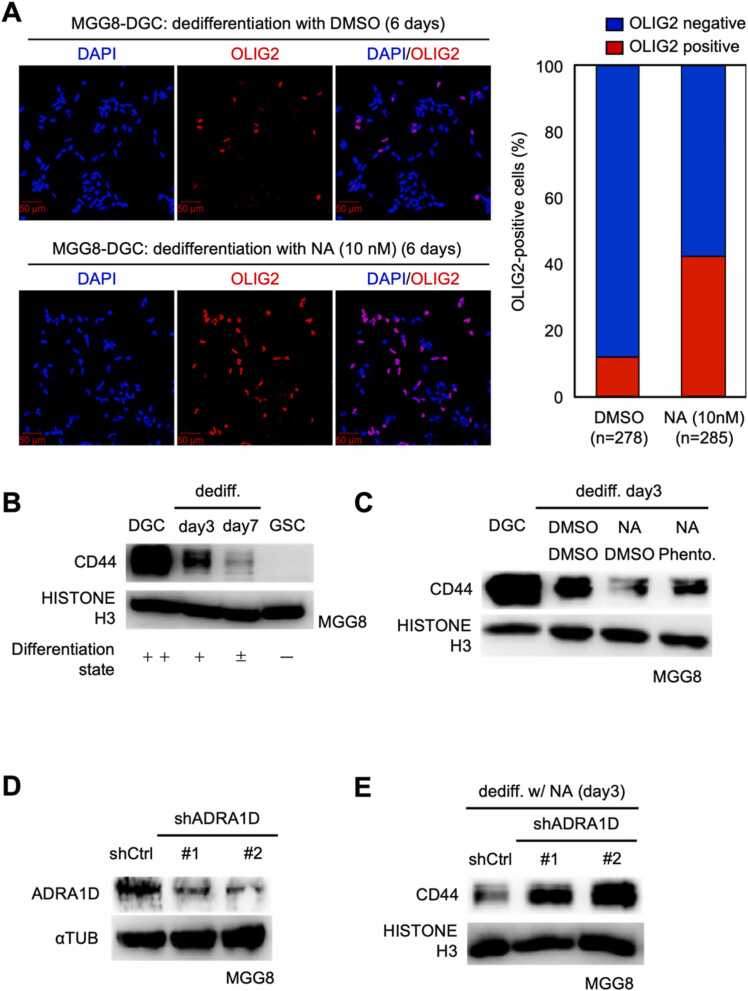
Glioblastoma cells are known to regulate their cellular plasticity in response to their surrounding microenvironment, but it is not fully understood what factors contribute to the cells' changing plasticity. Here, we found that glioblastoma cells alter the expression level of adrenoreceptors depending on their differentiation stage. Catecholamines are abundant in the central nervous system, and we found that noradrenaline, in particular, enhances the stemness of glioblastoma cells and promotes the dedifferentiation potential of already differentiated glioblastoma cells. Antagonist and RNAi experiments revealed that signaling through α1D-adrenoreceptor is important for noradrenaline action on glioblastoma cells. We also found that high α1D-adrenoreceptor expression was associated with poor prognosis in patients with gliomas. These data suggest that glioblastoma cells increase the expression level of their own adrenoreceptors to alter the surrounding tumor microenvironment favorably for survival. We believe that our findings will contribute to the development of new therapeutic strategies for glioblastoma.

Keywords: Adrenoceptors; Cellular plasticity; Differentiated glioma cells; Glioma stem-like cells; Noradrenaline.


Conflict of interest statement

Declaration of Competing Interest The authors declare that they have no known competing financial interests or personal relationships that could have appeared to influence the work reported in this paper.

Figures

Fig. 1
Fig. 1
Glioblastoma cells are capable of differentiation and dedifferentiation. (A). Culture schemes for maintenance of GSCs, induction of DGCs, and de-differentiation from DGCs to GSCs. (B). Western blotting results representing transitions in expression levels of undifferentiated and differentiated markers in GSCs and DGCs of human glioblastoma stem cell lines MGG4, MGG8, MGG18 and MGG23. MGG4 and MGG8 cells are classified as proneural subtype. MGG18 and MGG23 cells are classified as mesenchymal and classical/neural subtype, respectively. (C). Western blotting results showing transitions in expression levels of undifferentiated and differentiated markers in MGG8 and MGG23 GSC, DGC, and DGC to GSC de-differentiated cells, respectively.
Fig. 2
Fig. 2
Glioblastoma cells spontaneously differentiate and dedifferentiate in tumor tissue. (A). Scheme representing the method for labeling MGG8; lentivirus LV-GFP or LV-RFP was infected at each stage of GSC or DGC, and GFP and RFP expression was stable before experiments. (B). Immunostaining analysis to confirm undifferentiated and differentiated marker expression in labeled GSCs and DGCs. (C). Immunostaining analysis to evaluate the differentiation and dedifferentiation potential of labeled GSCs and DGCs in vitro. (D). Scheme for in vivo evaluation of differentiation and dedifferentiation potential of labeled GSCs and DGCs. (E). Representative immunofluorescent images of the xenograft tissues. Some of the RFP-positive cells (formerly GSCs) express the differentiated marker CD44 and some of the GFP-positive cells (formerly DGCs) express the undifferentiated marker OLIG2. Scale bars are all 20 µm (B, C, D).
Fig. 3
Fig. 3
Glioblastomas alter their adrenoceptor expression levels depending on their stage of differentiation. (A). Number of RNA sequence reads representing the expression of mRNAs encoding adrenoceptors in GSCs and DGCs of MGG4, MGG6, and MGG8. ADRA1D, ADRA2C, ADRB1, and ADRB2, which are well expressed and particularly variable, are highlighted with orange lines. (B). Graph showing the relative expression levels of ADRA1D, ADRA2C, ADRB1, and ADRB2 in GSCs and DGCs of MGG4, MGG6, and MGG8 as a ratio of DGCs to GSCs. The vertical axis is shown in logarithm; of the four genes, those representing a common pattern of variation in the three cell lines are highlighted with green lines. (C). Western blotting results evaluating protein expression of ADRA1D, ADRB1, and ADRB2 in GSCs and DGCs of MGG4, MGG8, MGG18, and MGG23. (D). Immunostaining images showing changes in ADRA1D expression in GSCs and DGCs of MGG8. (E). Immunostaining image showing ADRA1D expression in tumor tissue of orthotopic xenografts composed of 8GSC-RFP and 8DGC-GFP. ADRA1D, which is upregulated in the differentiated state, is positive in some RFP-positive cells (formerly GSC cells) and negative in some GFP-positive cells (formerly DGC cells), indicating that, like undifferentiated and differentiated markers, the expression pattern of ADRA1D is also heterogeneous. Staining for ADRA1D in normal mouse brain tissue is shown as a control.
Fig. 4
Fig. 4
Glioblastoma stem cells enhance their self-renewal capacity in response to noradrenergic stimulation. (A). Evaluation of sphere forming capacity in a scaffold-independent culture environment. Number of spheres formed per 1000 were counted. n = 4. (B). Sphere formation assay to assess whether the concentration-dependent self-renewal enhancing effects of noradrenaline are inhibited by antagonists of the respective adrenergic receptors. The same dilution sequence as in (A) was employed for noradrenaline concentrations. n = 4. * : p < 0.05, * *: p < 0.01, * ** : p < 0.001, * ** *: p < 0.0001.
Fig. 5
Fig. 5
Noradrenergic stimulation of differentiated glioblastoma cells enhances their dedifferentiation potential. (A). MGG8 DGCs were subjected to induction of dedifferentiation in GSC medium containing DMSO or Noradrenaline (10 nM) for 6 days and stained with OLIG2, an undifferentiated marker. The graph on the right represents the percentage of OLIG2-positive cells among all cells. Scale bar is 50 µm. (B). MGG8 DGCs were subjected to dedifferentiation induction for 3 days (day3) or 7 days (day7) in GSC medium and the expression of the differentiation marker CD44 was analyzed by western blotting. Qualitative differentiation status is presented as a summary. (C). DGCs of MGG8 were subjected to dedifferentiation induction for 3 days in GSC medium containing DMSO or noradrenaline (10 nM) and phentolamine (10 μM), and the expression of the differentiation marker CD44 was analyzed. (D). Knockdown by shRNA was confirmed by western blotting. (E). DGCs of MGG8 prepared as in (D) were subjected to dedifferentiation induction for 3 days in GSC medium containing noradrenaline (10 nM) and the expression of the differentiation marker CD44 was analyzed.
Fig. 6
Fig. 6
α1D adrenoceptor expression levels correlate with glioblastoma prognosis. (A). Scheme for in vivo evaluation of changes in the expression pattern of α1D adrenoceptors in labeled GSCs and DGCs. (B). Immunostaining images representing the altered expression pattern of α1D adrenoceptors in vivo in labeled GSCs and DGCs. Tumor core (upper panels) and tumor edge (lower panels) are shown, respectively. The yellow dashed line represents the region that appears to be the boundary between the tumor edge and normal brain tissue. The stained images with the white squares strongly magnified are placed in the rightmost panel, respectively. (C). Immunostaining images representing the altered expression pattern of OLIG2 in vivo in labeled GSCs and DGCs. Tumor core (upper panels) and tumor edge (lower panels) are shown, respectively. The right graph shows the percentage of OLIG2-positive cells among all GFP-positive cells, at the tumor core and at the tumor edge, respectively. (D). Each adrenoceptor gene, differentiation marker gene, and undifferentiated marker gene was analyzed by Ivy-GAP. (E). Brain tumor patients deposited in the CGGA dataset were grouped into ADRA1D high and low expression and their survival curves were plotted.

References

    1. Bao S., Wu Q., McLendon R.E., Hao Y., Shi Q., Hjelmeland A.B., et al. Glioma stem cells promote radioresistance by preferential activation of the DNA damage response. Nature. 2006;444(7120):756–760. Dec 7. - PubMed
    1. Berg T.J., Marques C., Pantazopoulou V., Johansson E., von Stedingk K., Lindgren D., et al. The irradiated brain microenvironment supports glioma stemness and survival via astrocyte-derived transglutaminase 2. Cancer Res. 2021;81(8):2101–2115. Apr 15. - PubMed
    1. Brown T.J., Brennan M.C., Li M., Church E.W., Brandmeir N.J., Rakszawski K.L., et al. Association of the extent of resection with survival in glioblastoma: a systematic review and meta-analysis. JAMA Oncol. 2016;2(11):1460–1469. Nov 1. - PMC - PubMed
    1. Caja L., Bellomo C., Moustakas A. Transforming growth factor β and bone morphogenetic protein actions in brain tumors. FEBS Lett. 2015;589(14):1588–1597. Jun 22. - PubMed
    1. Caragher S.P., Hall R.R., Ahsan R., Ahmed A.U. Monoamines in glioblastoma: complex biology with therapeutic potential. Neuro Oncol. 2018;20(8):1014–1025. Jul 5. - PMC - PubMed

MeSH terms

Substances

LinkOut - more resources