. 2025 Apr 4;135(10):e186432.
doi: 10.1172/JCI186432. eCollection 2025 May 15.

Mutant prion protein enhances NMDA receptor activity, activates PKC, and triggers rapid excitotoxicity in mice

Affiliations

Mutant prion protein enhances NMDA receptor activity, activates PKC, and triggers rapid excitotoxicity in mice

Joie Lin et al. J Clin Invest. .

Abstract

Neuronal hyperexcitability precedes synapse loss in certain neurodegenerative diseases, yet the synaptic membrane interactions and downstream signaling events remain unclear. The disordered amino terminus of the prion protein (PrPC) has been implicated in aberrant signaling in prion and Alzheimer's disease. To disrupt neuronal interactions and signaling linked to the amino terminus, we CRISPR-engineered a knockin mouse expressing mutant PrPC (G92N), generating an N-linked glycosylation site between 2 functional motifs. Mice developed seizures and necrosis of hippocampal pyramidal neurons, similar to prion-infected mice and consistent with excitotoxicity. Phosphoproteomics analysis revealed phosphorylated glutamate receptors and calcium-sensitive kinases, including protein kinase C (PKC). Additionally, 92N-PrPC-expressing neurons showed persistent calcium influx as well as dendritic beading, which was rescued by an N-methyl-d-aspartate receptor (NMDAR) antagonist. Finally, survival of Prnp92N mice was prolonged by blocking active NMDAR channels. We propose that dysregulated PrPC-NMDAR-induced signaling can trigger an excitatory-inhibitory imbalance, spongiform degeneration, and neurotoxicity and that calcium dysregulation is central to PrPC-linked neurodegeneration.

Keywords: Aging; Neurodegeneration; Neuroscience; Prions; Synapses.


Figures
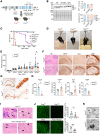
Figure 1
Figure 1. Mice expressing Prnp92N develop rapidly progressive neurologic disease with necrosis of CA1 pyramidal neurons.
(A) Schematic diagram of linear PrPC showing N- and C-terminal domains and the location of the G92N (red) or G92Q substitution (control, blue). The G92N substitution results in glycan incorporation into the flexible N-terminal domain. SP, signal peptide; OR, octapeptide repeat; SS, GPI signal sequence. The illustration in A was created with BioRender.com. (B) Western blot and quantification of PrPC expression and glycoform profile in Prnp92N mice (P18–P19). Tri, triglycosylated PrPC band; Di, diglycosylated PrPC band; Mono, monoglycosylated PrPC band; Un, unglycosylated PrPC band. (C) Survival curve for PrnpWT (n = 11), PrnpWT/92N (n = 16), Prnp92N/KO (n = 28), Prnp92N/92N (n = 18), and Prnp92Q (n = 26) mice. (D) Hind limb clasping in a Prnp92N mouse at P24 not observed in the littermate control or in a Prnp92Q mouse. (E) Graph showing the weight gain in mice from 7 to 25 days of age. (F) PrnpWT and Prnp92N (P25) hippocampi stained with H&E or immunolabeled for astrocytes (GFAP), microglia (Iba1), or myelin (MBP) and quantification of CA1. Arrowhead indicates the region where myelin is present in PrnpWT and reduced in the Prnp92N mice. (G) NeuN-immunolabeled hippocampi reveal extensive CA1 neuronal loss in Prnp92N mice (P29). (H) NeuN area quantified from hippocampi of P24 PrnpWT and Prnp92N mice. (I) H&E-stained images of Prnp92Nbrain show extensive perivascular neutrophils in the hippocampus (arrows, left panel) and multiple dark-rimmed and septate vacuoles in the brainstem (arrowheads, right panel) at P25, while images from prion-infected mice (strain ME7) also show neuron death in the hippocampus (arrows) and vacuoles in the brainstem (arrowheads). (J) MAP2 labeling of hippocampus shows a similar loss of dendrite structure in Prnp92N (P25) and in prion-infected mice, as compared with PrnpWT and mock-brain-inoculated control mice, respectively. (K) Representative TEM images of CA1 pyramidal neurons from age-matched PrnpWT and terminal Prnp92N mice. Arrow shows condensed chromatin. All results are shown as the mean ± SEM. One- or 2-way ANOVA with Tukey’s multiple-comparison test was performed to determine statistical significance (B, for PrPC levels and glycoform, respectively). The statistically significant differences were as follows: unglycosylated PrnpWT versus Prnp92N, ***P < 0.001 and versus PrnpWT/92N, *P < 0.05; monoglycosylated PrnpWT versus PrnpWT/92N, and versus Prnp92N, and PrnpWT/92N versus Prnp92N, ****P < 0.0001, ; diglycosylated PrnpWT versus PrnpWT/92N and Prnp92N, and PrnpWT/92N versus Prnp92N, ****P < 0.0001. Scale bars: 500 μm (F and G [left]), 50 μm (G [right], I, and J), and 5 μm and 2 μm (K, top and bottom, respectively).
Figure 2
Figure 2. Targeting Prnp92N exclusively to neurons induces rapid neurodegeneration in mice.
(A) Experimental design of the AAV constructs and i.v. injection into the superficial facial vein in P1 Prnp–/– mice. (B) Western blot and quantification of 92N-PrPC and WT-PrPC in brain lysates. (C) Survival curve for 92N-PrPC– and WT-PrPC–expressing mice (n = 4 and 5 for AAV-WT and AAV-92N, respectively). (D) Approximate age and survival of juvenile and adult Prnp–/– mice transduced with AAV-hSyn1Prnp92N (n = 4 and 3 per genotype for the juvenile and adult groups, respectively). Mice transduced with AAV-hSyn1PrnpWT did not show clinical signs. (E) Representative images of H&E-stained sections of hippocampus (CA1) (left and middle panels) and brainstem (right) show CA1 hippocampal necrosis and spongiform changes in 92N-PrPC–expressing mice. The boxed region in CA1 is shown at higher magnification (middle panel). Scale bars: 200 μm (left, right) and 50 μm (middle). Bar graphs show the mean ± SEM. **P < 0.01, by unpaired, 2-tailed t test with Welch’s correction (B), log-rank (Mantel-Cox) test (C), and Mann-Whitney U test (E). Illustrations in A and D were created with BioRender.com.
Figure 3
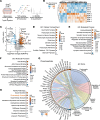
Figure 3. Phosphoproteomics analysis reveals altered glutamatergic signaling peptides in Prnp92N hippocampus.
(A) Experimental design of phosphoproteomics analysis of hippocampus (n = 5 per genotype). (B) Clustered heatmap of significantly altered peptides identified in Prnp92N versus PrnpWT hippocampus. (C) Volcano plot of all detected phosphopeptides. Dashed lines indicate fold change (>1.2) and P value cutoffs (P < 0.05). Select altered peptides are indicated by the protein’s gene symbol. (DF) GO enrichment analysis shows the top 10 most enriched cellular component, biological process, or molecular function ontologies. Circle color and size indicate the significance and gene count, respectively. (G) Chord plot for selected GO terms and associated phosphopeptides. Gene symbols and phosphorylation sites are indicated. (H) Top 10 affected KEGG pathways.
Figure 4
Figure 4. Increased neuronal activity and glutamatergic signaling proteins in Prnp92N and AAV-92NPrP–transduced hippocampus.
(A) Western blots and quantification of pGluN2B, NMDAR subunits and (B) PKC substrates in PrnpWT and Prnp92N hippocampus (P20, male and female mice). (C) Western blots and quantification of AAV-hSyn1PrnpWT and -hSyn1Prnp92N hippocampus (AAV.PHPeB.hSyn1-WT and AAV.PHPeB.hSyn1–92N-PrP) for Npas4, pGluN2B, NMDAR subunits, and (D) PKC phosphorylated substrates and calcium-sensitive protein kinases. Pound symbol indicates that the mouse was moribund, had severe hippocampal necrosis, and was an outlier and was therefore omitted from the data in the graphs. Groups of n = 5 PrnpWT and Prnp92N mice, and n = 4 and 5 AAV-WT and AAV-92N, respectively. Data represent the mean ± SEM. *P < 0.05, **P < 0.01, and ***P < 0.001, by unpaired, 2-tailed t test with Welch’s correction.
Figure 5
Figure 5. PrPC and NMDAR localization and calcium response to NMDA in primary cortical neurons.
(A) Western blot of step gradient fractions from least to most dense (fraction 10) for GluN2B, PSD95, PrPC, as well as flotillin 1 (Flot-1) to identify fractions containing DRMs and the transferrin receptor (TfR) as a non-DRM protein control. Fraction 1 is denoted as the first fraction with a detectable amount of flotillin 1 (higher fractions are not shown). Graph x-axis labels for fractions 2–5 indicate the sum of the fraction blot intensity: fractions 2 and 3 (“2”), 4 and 5 (“3”), 6 and 7 (“4”), and 8 and 9 (“5”). n = 4 per genotype. (B) Primary rat neurons expressing mCherry-tagged WT-PrPC or 92N-PrPC immunolabeled for MAP2 (dendrites) and PSD95 (postsynaptic density) show newly expressed PrPC along dendrites. Straightened dendrites (right) show PSD95 and WT-PrPC or 92N-PrPC on spines. Scale bars: 20 μm (neurons) and 5 μm (dendrites). (C) Cortical neurons (DIV 14–16) loaded with Fura-2 AM were stimulated with low NMDA (5 μM) followed by saturating NMDA (100 μM). Graph (left) depicts the mean ± SEM for relative changes in cytosolic calcium concentration (normalized 340:380 nm ratio) over time. Quantifications show the AUC from 0–25 minutes (middle) or the mean 340:380 ratio ± SEM (right). n = 58 or 47 cells from 6 (Prnp92N) or 7 (PrnpWT) mice, respectively, from 4 (PrnpWT) to 5 (Prnp92N) separate experiments. *P < 0.05, ***P < 0.001, and ****P < 0.0001, by 2-way ANOVA with Tukey’s multiple-comparison test (A) and unpaired, 2-tailed t test with Welch’s correction (C).
Figure 6
Figure 6. Prnp92N neurons are insensitive to a GluN2B allosteric modulator on evoked AMPAR and NMDAR currents.
(A and B) The evoked AMPAR and NMDAR excitatory postsynaptic currents (EPSCs) of PrnpWT, Prnp92N, and Prnp–/– CA1 pyramidal neurons in organotypic hippocampal slices in the absence and presence of Ro-25. AMPAR EPSCs and NMDAR EPSCs were induced by synaptic stimulation at the holding potential of –60 and +40 mV, respectively. Bar graph shows the ratio of AMPAR EPSCs to NMDAR EPSCs. (C) Normalized NMDAR EPSCs of PrnpWT, Prnp92N, and Prnp–/– CA1 pyramidal neurons show the effect of Ro-25 on the decay time of NMDAR currents. Data represent the mean ± SEM. (A) n = 29, 43, and 20 PrnpWT, Prnp92N, and Prnp–/–, respectively; (B) n = 23, 20, and 16 PrnpWT, Prnp92N, and Prnp–/–, respectively; (C) n = 14, 25, and 21 (untreated) and n = 21, 19, and 16 (Ro-25 treated) PrnpWT, Prnp92N and Prnp–/–. *P < 0.05, **P < 0.01, ***P < 0.001, and ****P < 0.0001, by 2-way ANOVA with Tukey’s multiple-comparison test.
Figure 7
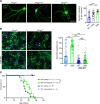
Figure 7. Reversible dendritic beading and prolonged survival of Prnp92N primary neurons and mice treated with an NMDA antagonist.
(A) MAP2-labeled hippocampal neurons (DIV 21–28) from Prnp92N or PrnpWT littermates. Quantification indicates the mean ± SEM. n = 102 (PrnpWT), 30 (PrnpWT/92N), and 46 (Prnp92N) neurons from 3–4 mice per genotype. Scale bar: 100 μm. (B) MAP2-labeled cortical neurons (DIV 21–28) treated with vehicle (top) or the NMDAR antagonist MK-801 for 72 hours (bottom). Quantification indicates the average ± SEM. n = 145 (PrnpWT), 117 (Prnp92N), 165 (MK801-treated PrnpWT), and 138 (MK801-treated Prnp92N) neurons from 5 mice per genotype. Scale bar: 200 μm. (C) Survival curves for mice treated with memantine or vehicle (saline). n = 17 and 15 Prnp92N saline-treated and memantine-treated mice, respectively; n = 5 and 4 PrnpWT saline-treated and memantine-treated mice, respectively. *P < 0.05, **P < 0.01, ***P < 0.001, and ****P < 0.0001, by 1-way ANOVA with Tukey’s multiple-comparison test (A and B). A log-rank test was used to determine survival results of Prnp92N memantine-treated versus saline control in C.

References

    1. Vandenberg RJ, Ryan RM. Mechanisms of glutamate transport. Physiol Rev. 2013;93(4):1621–1657. doi: 10.1152/physrev.00007.2013. - DOI - PubMed
    1. Traynelis SF, et al. Glutamate receptor ion channels: structure, regulation, and function. Pharmacol Rev. 2010;62(3):405–496. doi: 10.1124/pr.109.002451. - DOI - PMC - PubMed
    1. Verma M, et al. Excitotoxicity, calcium and mitochondria: a triad in synaptic neurodegeneration. Transl Neurodegener. 2022;11(1):3. doi: 10.1186/s40035-021-00278-7. - DOI - PMC - PubMed
    1. Ghirardini E, et al. Mutant prion proteins increase calcium permeability of AMPA receptors, exacerbating excitotoxicity. PLoS Pathog. 2020;16(7):e1008654. doi: 10.1371/journal.ppat.1008654. - DOI - PMC - PubMed
    1. Ghatak S, et al. Novel therapeutic approach for excitatory/inhibitory imbalance in neurodevelopmental and neurodegenerative diseases. Annu Rev Pharmacol Toxicol. 2021;61:701–721. doi: 10.1146/annurev-pharmtox-032320-015420. - DOI - PubMed