. 2025 Apr 4;16(1):3244.
doi: 10.1038/s41467-025-58584-x.

Epidermal electronic-tattoo for plant immune response monitoring

Affiliations

Epidermal electronic-tattoo for plant immune response monitoring

Tianyiyi He et al. Nat Commun. .

Abstract

Real-time monitoring of plant immune responses is crucial for understanding plant immunity and mitigating economic losses from pathogen and pest attacks. However, current methods relying on molecular-level assessment are destructive and time-consuming. Here, we report an ultrathin, substrate-free, and highly conductive electronic tattoo (e-tattoo) designed for plants, enabling immune response monitoring through non-invasive electrical impedance spectroscopy (EIS). The e-tattoo's biocompatibility, high conductivity, and sub-100 nm thickness allow it to conform to leaf tissue morphology and provide robust impedance data. We demonstrate continuous EIS analysis of live transgenic Arabidopsis thaliana plants for over 24 h, capturing the onset of NLR-mediated acute immune responses within three hours post-induction, prior to visible symptoms. RNA-seq and tissue ion leakage tests validate that EIS data accurately represent the physiological and molecular changes associated with immune activation. This non-invasive tissue-assessment technology has the potential to enhance our comprehension of immune activation mechanisms in plants and paves the way for real-time monitoring for plant health management.


Conflict of interest statement

Competing interests: The authors declare no competing interests.

Figures

Fig. 1
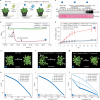
Fig. 1. Ultrathin, substrate-free, and highly conductive e-tattoo for continuous immune response monitoring.
a Schematic illustration of the e-tattoo on an A. thaliana leaf and the non-invasive in-water transfer printing process. b Simplified illustration of A. thaliana signaling events in response to the induction of autoimmunity, highlighting the hypersensitive response as a key feature of plant immune responses. The transgenic line in the Mrk-0 accession carries the RPP7 immune receptor that can be activated upon the induced expression of RPW8.1 from KZ10 accession. c Schematics showing the operating principle of EIS measurement using the e-tattoo. d Relative change of impedance magnitude over time during the autoimmune response. Inset photos present a transgenic A. thaliana plant before induction and 7 days post-induction. e Photographs of e-tattoos transferred to different flower pedals with no observable harm (top left to bottom right: peregrina, frangipani, ixora, and pinwheel flower). f Patterned e-tattoo on a leaf. Scale bar, 1.5 cm. g The e-tattoos transferred to different leaves with excellent conformability (top left to bottom right: basil, Schefflera heptaphylla, zamioculcas, and coleus scutellarioides). h An LED lit up through the conductive traces of the e-tattoo, demonstrating the e-tattoo’s excellent electrical conductivity. Scale bar, 1 cm.
Fig. 2
Fig. 2. Biocompatibility test of the e-tattoo on different plant species.
a Photos of the A. thaliana taken over one week, showing the test group with e-tattoo printed on the 7th leaf and the control group without e-tattoo. Scale bar, 1 cm. b Photos of a pothos stem growing in water for two months, with one leaf printed with e-tattoo, exhibiting a new leaf and various adventitious roots after 60 days. c Optical microscope image of the abaxial surface of a pothos leaf, half covered by the e-tattoo. Scale bar, 200 μm. Similar results were observed in more than three independent experiments. d SEM image of open stomata on the abaxial surface of a pothos leaf. The left panel shows a pristine leaf, while the right panel displays a leaf printed with the e-tattoo. Scale bar, 5 μm. Similar results were observed in two independent experiments. e Photo of a Brassica rapa (oilseed sarson) leaf with a square e-tattoo printed on the left side and black tape attached on the right side. f Fluorescence image of the Brassica rapa leaf after removing the e-tattoo and black tape, showing the e-tattoo-covered area (left) and the black tape-covered area (right).
Fig. 3
Fig. 3. Electrical and mechanical characterization of the e-tattoo.
a Sheet resistance of the e-tattoo transferred to different substrates. b Relative resistance change of the e-tattoo under various bending degrees. c Relative resistance change of the e-tattoo under dynamic bending (bending downward with a bending degree of 60 degrees). d Relative resistance change of the e-tattoo when immersed in water and dried out in the ambient condition. e Relative resistance change of the e-tattoo under different temperatures. f Relative resistance of the e-tattoo over a span of 30 days under the ambient conditions. g Relative resistance change of the e-tattoo transferred to a leaf undergoing a gradual dehydration process until fully dried out, accelerated in an oven at 40 °C. The inset images show photos of the leaf every 30 min, illustrating its wilting and deformation over time. h Relative resistance of e-tattoo on leaves over a span of 21 days. Source data are provided as a Source Data file.
Fig. 4
Fig. 4. EIS characterization of the e-tattoo compared to conventional electrodes, versatility and long-term stability tests.
a Photos of a pothos leaf with different electrodes attached to the same site. bc Bode plots obtained with different electrodes on the pothos leaf. d Photos of the A. thaliana leaf with different electrodes attached to the same site. ef Bode plots obtained with different electrodes on the A. thaliana leaf. gi Bode plots acquired with e-tattoo on the leaves of Coleus scutellarioides, Hypoestes phyllostachya, and Nicotiana benthamiana, respectively. j Photo of an intact A. thaliana plant with one leaf transfer-printed with the e-tattoo electrodes for EIS measurements. kl Bode plots collected from day 1 to day 14, taken at the same time each day. Source data are provided as a Source Data file.
Fig. 5
Fig. 5. Transgenic A. thaliana autoimmune response monitoring using plant e-tattoo.
a Experimental setup schematics for the control and test groups. Mrk-0 WT and uninduced transgenic plants served as negative controls. b Normalized impedance magnitude at 2 kHz over time of the test and control groups post induction with water or ethanol. A custom-designed portable impedance monitoring system was developed to enable continuous recording of the impedance spectra in the middle-frequency range (2 kHz–22 kHz). c Protein expression of ethanol-induced RPW8.1KZ10-mVenus in 4-week-old Mrk-0 WT and transgenic plants expressing RPW8.1KZ10-mVenus, analyzed by SDS-PAGE and western blot using an anti-GFP-HRP antibody. Similar results were obtained in more than three independent technical replicates, and a representative blot is shown. d Ion leakage measurements over time, indicating hypersensitive response (HR) and cell death in ethanol-induced Mrk-0 transgenic RPW8.1KZ10-mVenus plants. Leaf discs were floated in 500 mL of ddH2O for 30 min before being transferred in sets of ten into test tubes containing 8 mL of either 1% ethanol (experimental group) or ddH2O (mock group), with eight biological replicates per condition. The experiment was repeated in more than three independent biological replicates, yielding consistent results. Data from a representative biological replicate are shown. Data are presented as mean values ± SD. eg Photos of control and test group plants before and after induction (at 8 hpi). hj Impedance magnitude spectra over time of the test and control group plants. The full impedance spectrum was recorded every two hours. Source data are provided as a Source Data file.
Fig. 6
Fig. 6. Time-course RNA-Seq analysis of inducible DM6-DM7 in A. thaliana.
a Time-course log2 fold-change (log2FC) of reporter genes RPW8.1KZ10-mVenus, EDS16, and PR1. Ethanol vs. mock treatments. Analyzed using DESeq2 with Wald test. b WGCNA heatmap of log2FC for modules ME1-ME5 over the time course (0, 1.5, 3, 6, 12, 24 h). c ME3 expression profile (pJW121_EtOH in red, pJW121_mock in blue, WT_EtOH in grey), with a 90% confidence interval ribbon calculated using Student’s t-distribution (two-sided, n = 3 biological replicates per condition). pJW121 is the construct plasmid harboring transgene pAlcA::RPW8.1KZ10-mVenus. d GO enrichment for ME3, related to defence and salicylic acid (SA) processes. Statistical significance determined by hypergeometric test (two-sided) with p-values adjusted for multiple comparisons using Benjamini-Hochberg method. e ME5 expression profile (pJW121_EtOH in red, pJW121_mock in blue, WT_EtOH in grey), with a 90% confidence interval ribbon calculated using Student’s t-distribution (two-sided, n = 3 biological replicates per condition). f GO enrichment for ME5, related to growth and photosynthesis processes. Statistical significance determined by hypergeometric test (two-sided) with p-values adjusted for multiple comparisons using Benjamini-Hochberg method. Simplified GO terms were generated using Wang’s semantic similarity measure with a cutoff of 0.4.

Similar articles

References

    1. Pathogens, precipitation and produce prices. Nat. Clim. Change11, 635–635 (2021).
    1. Savary, S. et al. The global burden of pathogens and pests on major food crops. Nat. Ecol. Evol3, 430–439 (2019). - PubMed
    1. Li, P., Lu, Y.-J., Chen, H. & Day, B. The lifecycle of the plant immune system. Crit. Rev. plant Sci.39, 72–100 (2020). - PMC - PubMed
    1. McDowell, J. M. & Dangl, J. L. Signal transduction in the plant immune response. Trends Biochem. Sci.25, 79–82 (2000). - PubMed
    1. Laflamme, B., Middleton, M., Lo, T., Desveaux, D. & Guttman, D. S. Image-based quantification of plant immunity and disease. Mol. Plant-Microbe Interact.29, 919–924 (2016). - PubMed

MeSH terms

LinkOut - more resources