

Evaluation of crop phenology using remote sensing and decision support system for agrotechnology transfer
- PMID: 40185844
- PMCID: PMC11971243
- DOI: 10.1038/s41598-025-95109-4
Evaluation of crop phenology using remote sensing and decision support system for agrotechnology transfer
Abstract
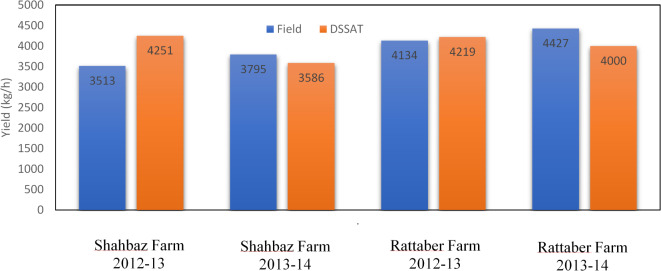
The decision support system for agro-technology transfer (DSSAT) is a worldwide crop modeling platform used for crops growth, yield, leaf area index (LAI), and biomass estimation under varying climatic, soil and management conditions. This study integrates DSSAT with satellite remote sensing (RS) data to estimates canopy state variables like LAI and biomass. For LAI estimation, Moderate Resolution Imaging Spectroradiometer (MODIS) product (MCD15A3H for LAI and MOD17A2 / MOD17A3 products for biomass) are used. Field data for Sheikhupura district is provided by National Agriculture Research Council (NARC) and used for the calibration and validation of the model. The results indicate strong agreement between the DSSAT and RS derived estimates. Correlation coefficients (R²) for LAI varied from 0.82 to 0.90, while for biomass ranged from 0.92 to 0.99 over two farms and two growing seasons (2012-2014). The index of agreement (D-index) ranged from 0.79 to 0.96 across the two farms and two growing seasons (2012-2014) affirming the model's durability. However, the biomass estimated from RS data is underestimated due to saturation phenomenon in the optical RS. The performance metrics, comprising the coefficient of residual mass (CRM) and normalized root mean square error (nRMSE), further substantiate the approach utilized. This study will help decision and policymakers and researchers to apply geospatial techniques for the sustainable agriculture practices.
Keywords: Agro technology; DSSAT; GEE; Pakistan; Sheikhupura.
© 2025. The Author(s).
Conflict of interest statement
Declarations. Competing interests: The authors declare no competing interests.
Figures


References
-
- FAO. World Reference Base for Soil Resource 2006: A Framework for International Classification, Correlation and Communication. (2006).
-
- Serageldin, I. & Looking Ahead Water, life and the environment in the Twenty-First century. Int. J. Water Resour. Dev.15, 17–28. 10.1080/07900629948907 (1999). - DOI
-
- Carta, J. A., González, J., Cabrera, P. & Subiela, V. J. Preliminary experimental analysis of a Small-Scale prototype SWRO desalination plant, designed for continuous adjustment of its energy consumption to the widely varying power generated by a Stand-Alone wind turbine. Appl. Energy. 137, 222–239. 10.1016/j.apenergy.2014.09.093 (2015). - DOI
-
- Timsina, J. & Humphreys, E. Applications of CERES-Rice and CERES-Wheat in research, policy and climate change studies in Asia: A review. Int. J. Agric. Res.1, 202–225. 10.3923/ijar.2006.202.225 (2006). - DOI
-
- White, J. W., Hoogenboom, G., Kimball, B. A. & Wall, G. W. Methodologies for simulating impacts of climate change on crop production. F Crop Res.124, 357–368. 10.1016/j.fcr.2011.07.001 (2011). - DOI
MeSH terms
LinkOut - more resources
Full Text Sources
