

Association between lipid accumulation products and relative handgrip strength: a large population-based study
- PMID: 40185887
- PMCID: PMC11971364
- DOI: 10.1038/s41598-025-96481-x
Association between lipid accumulation products and relative handgrip strength: a large population-based study
Abstract
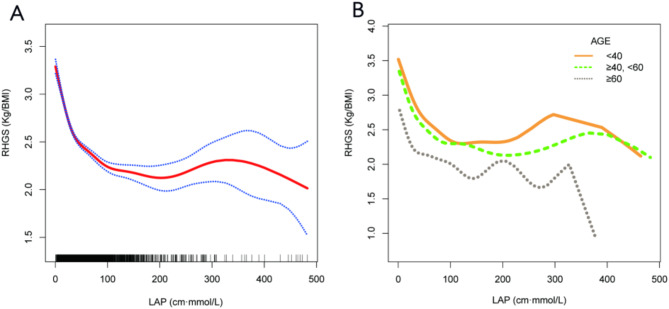
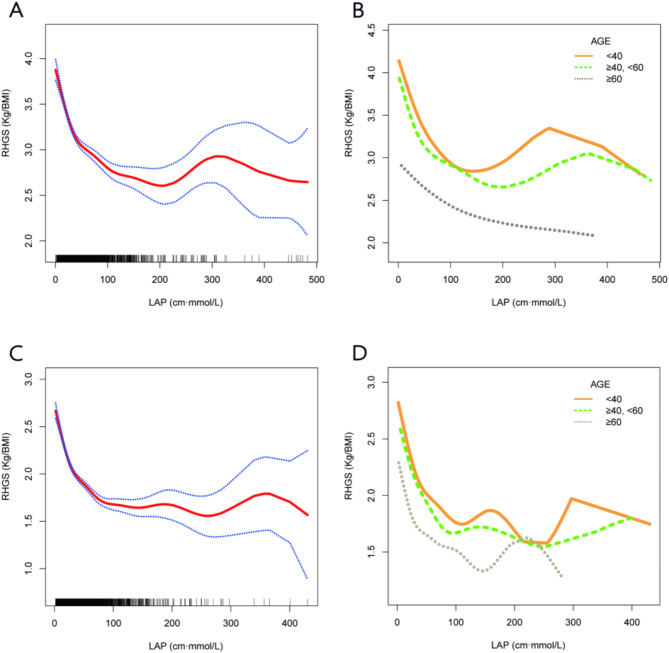
Given the increasing prevalence of chronic diseases in the aging population, it is of great importance to gain an understanding of how changes in body composition affect health outcomes. Handgrip strength (HGS) serves as a valuable proxy for overall muscle strength, while relative HGS (RHGS) adjusts for body size, providing a more accurate assessment of the relationship between muscle strength and metabolic disease. Lipid accumulation products (LAP) are an indicator that can reflect visceral lipid accumulation. Based on previous studies, the relationship between LAP and RHGS has not been explored. This study aims to address this gap in the literature and provide insights for public health recommendations. Data was collected and extracted from the 2011-2014 National Health and Nutrition Examination Survey (NHANES) database. LAP was calculated from the arithmetic product of waist circumference (WC) and fasting plasma triglyceride (TG), the calculation as following formulas: for females, [WC (cm) - 58] × [TG (mmol/l)], and for males, [WC (cm) - 65] × [TG (mmol/l)]; RHGS was derived from the HGS to BMI ratio. The correlation between the variables was initially explored using multivariate linear regression. Secondly, smoothed-fitted curves were used to investigate the non-linear relationship between the variables. The inflection point values were determined based on the results of the threshold effect analysis. Subgroup analyses were also conducted to assess the stability of the relationship between the variables in different populations. The study analyzed 3990 patients. After accounting for different covariates, multivariate linear regression analysis demonstrated a significant negative correlation between increased levels of LAP and increased levels of RHGS (beta coefficient = -0.0020; 95% confidence interval CI: -0.0023 to -0.0017; P < 0.0001). The interaction test did not have a statistically significant effect on this association. Furthermore, curve fit and threshold effect analysis demonstrated a non-linear relationship with a breakpoint at 49.8083 cm·mmol/L. The results of this study demonstrate an inverse relationship between LAP and RHGS in various populations in the United States. These findings provide compelling evidence of the clinical significance of LAP as a predictor of RHGS, offering valuable insights for developing early intervention strategies in high-risk populations.
Keywords: Lipid accumulation products; National health and nutrition examination survey; Relative handgrip strength.
© 2025. The Author(s).
Conflict of interest statement
Declarations. Competing interests: The authors declare no competing interests. Ethics approval and consent to participate: This study used publicly available pooled data; no ethical approval was required. And all subjects involved in this study from the NHANES database were treated by the ethical principles set out in the Declaration of Helsinki and the database was approved by the National Centre for Health Statistics (NCHS) Research Ethics Review Board. At the same time, at the time of participation in the database data collection, patients/participants had provided written informed consent to participate in the data collection and other related aspects.
Figures

References
MeSH terms
Substances
Grants and funding
LinkOut - more resources
Full Text Sources
Research Materials
Miscellaneous
