. 2025 Apr 4;8(1):565.
doi: 10.1038/s42003-025-08006-x.

Preference-independent saliency map in the mouse superior colliculus

Affiliations

Preference-independent saliency map in the mouse superior colliculus

Ruixiang Wu et al. Commun Biol. .

Erratum in

Abstract

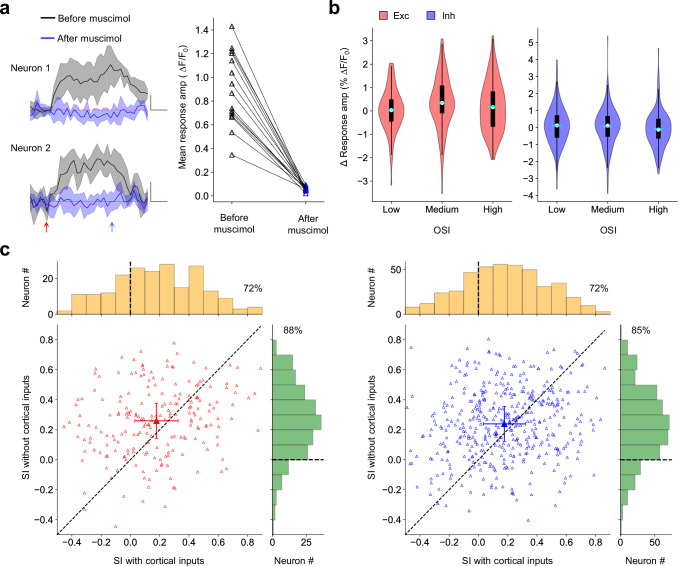
Detecting salient stimuli in a visual scene is crucial for animal survival, yet how the brain encodes visual saliency remains unclear. Here, using two-photon calcium imaging, we reveal a preference-independent saliency map in the superficial superior colliculus of awake mice. Salient stimuli evoke stronger responses than uniform stimuli in both excitatory and inhibitory neurons, with similar encoding patterns across both cell types. The strongest response occurs when a salient stimulus is centered within the receptive field, with contextual effects extending approximately 40°. Response amplitude scales with saliency strength but remains independent of neurons' orientation or motion direction preferences. Notably, saliency-encoding neurons exhibit weak orientation and direction selectivity, indicating a complementary relationship between saliency and feature maps. Importantly, this preference-independent saliency encoding does not require cortical inputs. These findings provide insights into the neural mechanisms underlying visual saliency detection.


Conflict of interest statement

Competing interests: The authors declare no competing interests.

Figures

Fig. 1
Fig. 1. Excitatory and inhibitory neurons show robust responses to salient stimuli.
a Schematic of the experimental setup. Mice were head-fixed and free to run on a treadmill. Visual stimuli were presented on a screen. Two-photon microscopy was used to image neuronal calcium activity and tdTomato expression. PMT, photomultiplier tube. b Schematic of mouse brain anatomy after insertion of a triangular transparent plug to expose the posterior-middle portion of the superior colliculus beneath the posterior cortex. TS, transverse sinus. c A mean projection of tdTomato-labeled Vglut2+ or Vgat+ neurons and GCaMP8+ neurons in two mice. The right panel shows the proportion of double-labeled neurons in both Vglut2-tdTomato and Vgat-tdTomato mice. d Example response profiles of excitatory and inhibitory neurons to salient flashing gratings and backgrounds. Left, circular patches with sinusoidal gratings. Right, square patches with square gratings. Gray shade indicates the SD across 5 trials. Blue and red arrows mark the onset and offset of visual stimuli, respectively, while gray arrows mark the phase shift of the gratings. Red lines indicate the baseline activity without visual stimulation. Scale: 30% ΔF/F0, 0.5 s. e Example response profiles to salient moving gratings and backgrounds. Gray shade indicates the SD across 5 trials. Blue and red arrows mark the onset and offset of visual stimuli, respectively. Red lines indicate the baseline activity without visual stimulation. Scale: 30% ΔF/F0, 0.5 s.
Fig. 2
Fig. 2. Neural encoding of visual saliency is independent of orientation preference.
a Calcium responses of an example neuron to three types of visual stimuli: a flashing black square (10°) against a gray background (left), a flashing circular patch (10°) with horizontal (middle) or vertical (right) sinusoidal gratings against an orthogonal background. The patches were displayed at each of the 4 × 6 locations. Gray shade indicates the SD across 5 trials. Blue and red arrows mark the onset and offset of visual stimuli, respectively. The red dashed ellipse represents the outline of the fitted RF with a 2D Gaussian at half maximum. Red lines indicate the baseline activity without visual stimulation. Scale: 30% ΔF/F0, 1 s. b Violin plots for response amplitudes to SFGs with the patch at different distances from the RF center (colored bars), as well as amplitudes to the background (gray bars) for both excitatory (N = 1531) and inhibitory (N = 2915) neurons. Red circles denote the RF. c Response amplitude to SFGs and backgrounds, grouped by the orientation preference of the background. d Histograms of SI for excitatory (Pref: 0.15 ± 0.26; Orth: 0.39 ± 0.26) and inhibitory (Pref: 0.17 ± 0.28; Orth: 0.41 ± 0.29) neurons. Cyan dashed lines mark the 0. e The percentage of orientation-selective neurons (OSI ≥ 0.25) in both non-saliency-encoding (SI ≤ 0, left) and saliency-encoding (SI > 0, right) populations. f Violin plots for the difference in response amplitudes evoked by SFGs with the preferred and orthogonal backgrounds for saliency-encoding neurons, plotted against different levels of orientation selectivity. Low: OSI < 0.25; Medium: 0.25 ≤ OSI < 0.5; High: OSI ≥ 0.5. The means of the three groups are the same: one-way ANOVA, p = 0.15 for excitatory neurons, N = 637, 309, 98; p = 0.44 for inhibitory neurons, N = 1087, 698, 160.
Fig. 3
Fig. 3. Neural encoding of visual saliency is independent of direction preference.
a Calcium responses of an example neuron to a circular patch (10°) sinusoidal grating moving in four directions against a background moving in the opposite direction. Green arrows indicate the motion direction of the background, and red arrows indicate the direction of the patch. Gray shade indicates the SD across 5 trials. Blue and red arrows mark the onset and offset of visual stimuli, respectively. Red lines indicate the baseline activity without visual stimulation. Scale: 30% ΔF/F0, 1 s. b Violin plots for response amplitudes to SMGs (colored bars) and the background (gray bars) for both excitatory (N = 2082) and inhibitory (N = 3496) neurons, grouped by direction preference. c Histograms of SI calculated from SMG-evoked responses for excitatory (Pref: −0.03 ± 0.26; Null: 0.21 ± 0.25) and inhibitory (Pref:  −0.02 ± 0.26; Null: 0.22 ± 0.25) neurons. Cyan dashed lines mark the 0. d The percentage of direction-selective neurons (DSI ≥ 0.25) in both non-saliency-encoding (SI ≤ 0, left) and saliency-encoding (SI > 0, right) populations. e Violin plots for the difference in response amplitudes evoked by SMGs with backgrounds moving in the preferred and null directions for saliency-encoding neurons, plotted against different levels of direction selectivity. Low: DSI < 0.25; Medium: 0.25 ≤ DSI < 0.5; High: DSI ≥ 0.5. The means of the three groups are the same: one-way ANOVA, p = 0.44 for excitatory neurons, N = 907, 197, 32; p = 0.10 for inhibitory neurons, N = 1555, 286, 58.
Fig. 4
Fig. 4. Neurons in the sSC encode saliency strength.
a Response profiles of example excitatory and inhibitory neurons to SFGs with 5 different orientation contrasts in two backgrounds. Gray shade indicates the SD across 5 trials. Blue and red arrows mark the onset and offset of visual stimuli, respectively, while gray arrows mark the phase shift of the gratings. Red lines indicate the baseline activity without visual stimulation. Scale: 30% ΔF/F0, 0.5 s. b Violin plots for response amplitudes to different orientation contrasts for saliency-encoding neurons with OSI < 0.25 (left, N = 101) and OSI ≥ 0.25 (right, N = 37). c Violin plots for the difference in response amplitudes elicited by SFGs of 30° and 90° contrasts for saliency-encoding neurons, plotted against different levels of orientation selectivity. Low: OSI < 0.25; High: OSI ≥ 0.25, t-test. d, e The same plots for inhibitory neurons. Left, N = 121; Right, N = 53.
Fig. 5
Fig. 5. Encoding of visual saliency depends on the preference across different visual features.
a Response amplitude as a function of saliency strength for ideal saliency-encoding neurons, independent of the preference for specific visual features. Green dots indicate response amplitude to SFGs with different orientation contrasts. The blue triangle indicates the response amplitude to SMG, which may be more or less salient than the SFG. b Response amplitude difference between two salient stimuli as a function of neurons' preferences for specific orientations, directions, and features. c Difference in response amplitude between SFG and SMG (SMG-SFG) versus FSI; r is Pearson’s correlation coefficient: p < 0.001 for both excitatory and inhibitory neurons. Exc: N = 968; Inh: N = 1688. Cyan lines represent linear fits. d Violin plots for the difference in response amplitudes evoked by SFGs and SMGs for saliency-encoding neurons across different levels of feature selectivity. Low: FSI < 0.25; Medium: 0.25 ≤ FSI < 0.5; FSI ≥ 0.5. One-way ANOVA, p < 0.001 for both excitatory and inhibitory neurons; p < 0.001 for all pairwise comparisons using Tukey’s range test. Exc: N = 270, 484, 248; Inh: N = 651, 1272, 713. e SI_SMG is positively correlated with SI_SFG: r is Pearson’s correlation coefficient, p < 0.001 for both excitatory and inhibitory neurons. Exc: N = 2056, Inh: N = 3344.
Fig. 6
Fig. 6. Saliency-encoding neurons are less selective to orientation and motion direction.
a Upper panels: orientation map and direction map represented by excitatory and inhibitory neurons in an example imaging plane. The length of lines or arrows is proportional to gOSI or gDSI. Lower panels: saliency maps measured by SFGs and SMGs in the same plane. b Box plots for the absolute difference in SI of neuron pairs versus their horizontal distance. Black dashed lines indicate the separation at 75% of the maximum. SFG_Exc: 85 μm, N = 167834 neuron pairs; SFG_Inh: 75 μm, N = 400335 neuron pairs; SMG_Exc: 155 μm, N = 167834 neuron pairs; SMG_Inh: 125 μm, N = 400335 neuron pairs. c SI is negatively correlated with gOSI measured by flashing gratings: r is Pearson’s correlation coefficient, p < 0.001 for all panels. Top inset: histograms of gOSI for neurons with SI < 0 and SI ≥ 0. Right inset: histograms of SI for neurons with gOSI < 0.25 and gOSI ≥ 0.25. d SI is negatively correlated with gDSI measured by moving gratings: p < 0.001 for all panels. Top inset: histograms of gDSI for neurons with SI < 0 and SI ≥ 0. Right inset: histograms of SI for neurons with gDSI < 0.15 and gDSI ≥ 0.15.
Fig. 7
Fig. 7. Preference-independent saliency encoding in the sSC does not require cortical inputs.
a Two examples and the summary of visually evoked neuronal responses in V1 before and after muscimol injections. Gray shade indicates the SD across 5 trials. Blue and red arrows mark the onset and offset of visual stimuli, respectively. Red lines indicate the baseline activity without visual stimulation. Scales: 30% ΔF/F0, 0.5 s. N = 15 neurons. b Violin plots for the difference in response amplitudes evoked by SFGs with preferred and orthogonal backgrounds for saliency-encoding neurons across different levels of orientation selectivity after cortical silencing. The means of the three groups are the same: one-way ANOVA, p = 0.19 for excitatory neurons, N = 84, 74, 50; p = 0.41 for inhibitory neurons, N = 163, 156, 112. c SI of excitatory and inhibitory neurons in the sSC without versus with cortical inputs. Exc: 0.18 ± 0.30 vs. 0.26 ± 0.23, N = 208; Inh: 0.18 ± 0.29 vs. 0.24 ± 0.23, N = 431. Black dashed lines indicate the identity line. Error bars represent standard deviation. Top and right insets: histograms of SI with and without cortical inputs. Black dashed lines mark SI = 0. Percentage values indicate the proportion of neurons with SI > 0.

Similar articles

References

    1. Zheng, J. & Meister, M. The unbearable slowness of being: why do we live at 10 bits/s? Neuron113, 192–204 (2025). - PMC - PubMed
    1. Li, Z. A new framework for understanding vision from the perspective of the primary visual cortex. Curr. Opin. Neurobiol.58, 1–10 (2019). - PubMed
    1. Treisman, A. M. & Gelade, G. A feature-integration theory of attention. Cogn. Psychol.12, 97–136 (1980). - PubMed
    1. Treisman, A. Preattentive processing in vision. Comput. Vis. Graph. Image Process.31, 156–177 (1985).
    1. Posner, M. I. Orienting of attention. Q. J. Exp. Psychol.32, 3–25 (1980). - PubMed

LinkOut - more resources