. 2025 Sep;30(9):4161-4175.
doi: 10.1038/s41380-025-02996-0. Epub 2025 Apr 4.

17β-estradiol status alters NMDAR function and antipsychotic-like activity in female rats

Affiliations

17β-estradiol status alters NMDAR function and antipsychotic-like activity in female rats

Kimberly M Holter et al. Mol Psychiatry. 2025 Sep.

Abstract

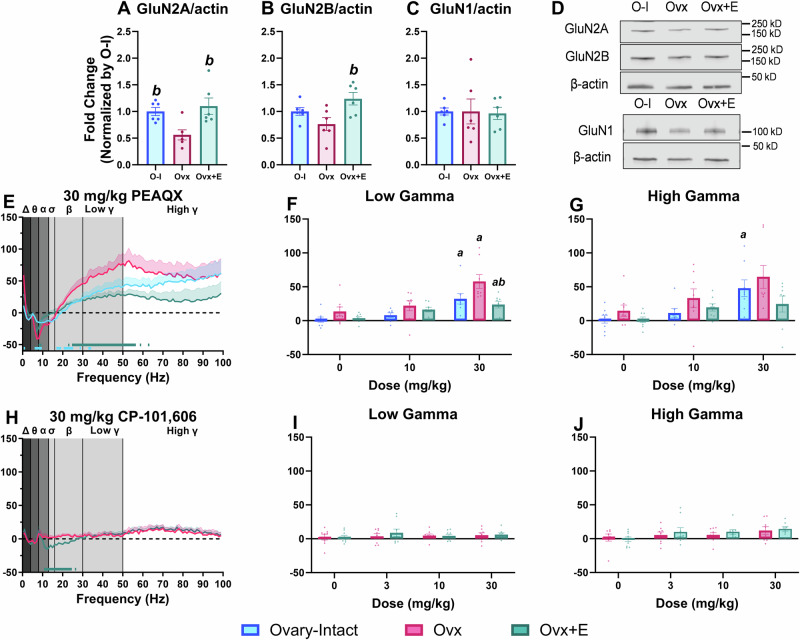
Low 17β-estradiol (E2) in females of reproductive age, and marked E2 decline with menopause, contributes to heightened symptom severity in schizophrenia (i.e. cognitive dysfunction) and diminished response to antipsychotic medications. However, the underlying mechanisms are unknown. N-methyl-D-aspartate receptor (NMDAR) hypofunction contributes to the pathophysiology of schizophrenia, yet impact of E2 depletion on NMDAR function is not well characterized. Quantitative electroencephalography (qEEG), specifically gamma power, is a well-established functional readout of cortical activity that is elevated in patients with schizophrenia and is sensitive to alterations in NMDAR function. Using qEEG and touchscreen cognitive assessments, present studies investigated the effects of E2 on NMDAR function by administering MK-801 (NMDAR antagonist) to ovariectomized rats with or without E2 implants (Ovx+E and Ovx, respectively). Ovx rats were more sensitive to MK-801-induced elevations in gamma power and attentional impairments compared to Ovx+E rats. Further investigation revealed these effects were mediated by reduced synaptic GluN2A expression. Consistent with clinical reports, olanzapine (second-generation antipsychotic) was less effective in mitigating MK-801-induced elevations in gamma power in Ovx rats. Lastly, we examined antipsychotic-like activity of a Group II metabotropic glutamate receptor (mGlu2/3) positive allosteric modulator (PAM), SBI-0646535, as a novel therapeutic in E2-deprived conditions. SBI-0646535 reversed MK-801-induced elevations in gamma power regardless of E2 status. Collectively, these studies established a relationship between E2 deprivation and NMDAR function that is in part GluN2A-dependent, supporting the notion that E2 deprivation increases susceptibility to NMDAR hypofunction. This highlights the need to examine age/hormone-specific factors when considering antipsychotic response and designing novel pharmacotherapies.


Conflict of interest statement

Competing interests: Dr. Cosford has an equity interest in Camino Pharma, LLC, a company that may potentially benefit from the research results.

Figures

Fig. 1
Fig. 1. Ovx rats were more sensitive to MK-801-induced impairments on the 5CSRTT but not the PAL task.
Bars depict group data as a mean (±SEM). Reductions in overall % accuracy were identified in O-I and Ovx rats in the 5CSRTT (main effect of dose: F1.908, 43.89 = 7.525, p = 0.0018) (A). Overall % omission was dose-dependently increased in all groups (main effect of dose: F3.789, 87.15 = 48.51, p < 0.0001; main effect of group: F2, 23 = 3.994, p = 0.0324) (B). When separated out by stimulus duration, % accuracy was decreased in O-I (main effect of dose: F2.630, 132.4 = 3.046, p = 0.0372; stimulus duration: F5, 54 = 3.667, p = 0.0063) (C) and Ovx (main effect of dose: F1.479, 10.36 = 5.821, p = 0.0265; main effect of stimulus duration: F2.533, 17.73 = 11.14, p = 0.0004) (D) rats at higher stimulus durations. Ovx+E rats were not affected (ps>0.05) (E). In the PAL task, O-I and Ovx rats experienced dose-dependent decreases in overall % accuracy (main effect of dose: F2.167, 39.55 = 24.11, p < 0.0001) (F). All groups experienced significant increases in the % of CTs (main effect of dose: F2.745, 49.42 = 49.42, p < 0.0001) (G). Lastly, the 0.18 mg/kg dose of MK-801 significantly decreased the total number of selection trials in O-I and Ovx+E rats (main effect of dose: F2.28, 53.11 = 44.06, p < 0.0001) (H). p < 0.05; a compared to the group’s respective vehicle condition; b compared to the Ovx group. For 5CSRTT, n = 10 O-I, 8 Ovx, and 8 Ovx+E rats; for the PAL task, n = 11 O-I, 8 Ovx, and 9 Ovx+E rats. Some rats were excluded due to omission of all trials within a stimulus duration (C-E) or for not performing at inclusion criteria on any given dose day (G, H); in those circumstances, the included n is depicted on the bar graph.
Fig. 2
Fig. 2. MK-801 differentially affected spectral power in the gamma waveform at the 0.18 mg/kg dose in Ovx rats.
All data are shown as a group mean ( ± SEM). Full spectrum data are presented in 1 Hz bins expressed as the average percent change from baseline during the 30–90 min post-dosing period. Gray vertical bars represent frequency bands (delta, Δ 0.5–4 Hz; theta, θ 4–8 Hz; alpha, α 8–13 Hz; sigma, σ 13–15 Hz; beta, β 13–30 Hz; low gamma, γ 30–50 Hz; high gamma, γ 50–100 Hz). Group comparisons across the full spectral power range were evaluated following administration of vehicle (A) and 0.18 mg/kg of MK-801 (B). Then, direct group comparisons evaluated the average % change within the high gamma power band (50–100 Hz) in the 30–90 min post-dosing period at each tested MK-801 dose (main effect of dose: F2.92, 78.75 = 46.39, p < 0.0001; group X dose interaction: F8, 108 = 2.444, p = 0.018) (C). Lastly, the effects of MK-801 dose on high gamma power over time are displayed as the % change from baseline in 10 min bins across the 7 h recording period for O-I (D), Ovx (E), and Ovx+E rats (F). p < 0.05; Horizontal colored lines corresponding to experimental group represent the 1 Hz bins at which O-I or Ovx+E groups were significantly different from the Ovx group (B). In C, a is compared to the groups respective vehicle condition and b is compared to the Ovx group. In DF, horizontal-colored lines matching the respective dose color represent the 10-min bins at which MK-801-treated groups were significantly different from vehicle-treated groups. n = 9–10 O-I, 8–9 Ovx, and 12 Ovx+E rats.
Fig. 3
Fig. 3. Ovx rats had lower GluN2A and GluN2B synaptic expression in the PFC and were more sensitive to PEAQX-induced elevations in gamma power relative to Ovx+E rats.
All data are normalized to the O-I condition and expressed as fold change ( ± SEM) (A-C). Western blot analyses of GluN2A expression (F2,15 = 6.476, p = 0.0094) (A) and GluN2B expression (F2,15 = 5.054, p = 0.021) (B) was significantly lower in Ovx rats (GluN2A: 0.561 ± 0.094; GluN2B: 0.765 ± 0.120) relative to Ovx+E rats (GluN2A: 1.101 ± 0.154; GluN2B: 1.239 ± 0.118). GluN2A expression was also lower in Ovx relative to Ovary-Intact rats (GluN2A: 1.0 ± 0.075; GluN2B: 1.0 ± 0.072). Importantly, GluN1 expression was not significantly different between groups (F2, 15 = 0.0189, p = 0.9813; O-I = 1.0 ± 0.066, Ovx = 1.0 ± 0.023, Ovx+E = 1.125 ± 0.114) (C). Representative Western blots for GluN2A, GluN2B, and β-actin (above) and GluN1 and β-actin (below) (D). In EJ, all data are shown as a group mean (±SEM). Full spectrum data are presented in 1 Hz bins expressed as the average percent change from during the 5-h post-dosing period. Gray vertical bars represent frequency bands (delta, Δ 0.5–4 Hz; theta, θ 4–8 Hz; alpha, α 8–13 Hz; sigma, σ 13–15 Hz; beta, β 13–30 Hz; low gamma, γ 30–50 Hz; high gamma, γ 50–100 Hz). Group comparisons across the full spectral power range were evaluated following administration of 30 mg/kg PEAQX or CP-101,606 (E, H). Then, direct group comparisons were assessed for the average % change within the low gamma (main effect of dose: F1.60,32.87 = 23.4, p < 0.0001; group: F2,21 = 6.686, p = 0.0057) (F) and high gamma (main effect of dose: F1.568, 32.15 = 13.75, p = 0.0001) (G) power bands in the 5 h post-dosing period at each tested dose. For bar graphs, p < 0.05; a, compared to the group’s respective vehicle condition; b, compared to the Ovx group. Horizontal colored lines matching the respective experimental condition represent the 1 Hz bins at which O-I or Ovx+E rats were significantly different from the Ovx condition (E, H). In AC, n = 6 rats per condition. n = 7–8 O-I (EG), 8–9 Ovx, and 8–9 Ovx+E rats (EJ).
Fig. 4
Fig. 4. SBI-0646535 has a unique spectral profile compared to OLZ in all groups.
All data are shown as a group mean ( ± SEM). Full spectrum data are presented in 1 Hz bins expressed as the average percent change from baseline during the 30–150 min post-dosing period. Gray vertical bars represent frequency bands (delta, Δ 0.5–4 Hz; theta, θ 4–8 Hz; alpha, α 8–13 Hz; sigma, σ 13–15 Hz; beta, β 13–30 Hz; low gamma, γ 30–50 Hz; high gamma, γ 50–100 Hz). All tested OLZ doses were examined within each individual group: O-I (n = 9) (A), Ovx (n = 9) (B), and Ovx+E rats (n = 9) (C). All tested SBI-0646535 doses were also examined within each group: O-I (n = 8) (D), Ovx (n = 7–9) (E), and Ovx+E (n = 7–9) (F). p < 0.05; horizontal colored lines matching the color of respective doses represent frequencies at which OLZ- or SBI-0646535-treated groups were significantly different from vehicle-treated groups.
Fig. 5
Fig. 5. SBI-0646535, but not OLZ, was equally effective in mitigating MK-801-induced functional changes in Ovx rats.
All data shown are group means ± SEM. The percent change from baseline in 10-min bins across the 7-h recording period was evaluated in O-I (A, E), Ovx (B, F), and Ovx+E rats (C, G). OLZ and SBI-0646535 were administered at time point 0 followed by vehicle or MK-801 30 min later (denoted by arrows). On the x-axis, −2 corresponds to ZT 0 and 5 corresponds to ZT 7. Then, direct group comparisons were evaluated as the average % change within the high gamma power band in the 60–180 min post-dosing period (D, main effect of dose: F2.723, 57.19 = 44.29, p < 0.0001; H, main effect of dose: F1.753, 35.94 = 32.96; p < 0.0001). p < 0.05; in timecourse graphs (AC and EG), horizontal colored lines matching the respective dose color represent the 10 min bins at which OLZ- or SBI-0646535-treated groups were significantly different from groups treated with vehicle + 0.1 mg/kg MK-801. In D, H, a, compared to the group’s respective vehicle + 0.1 mg/kg MK-801 condition. n = 8 O-I, 7–8 Ovx, and 8 Ovx+E rats.
Fig. 6
Fig. 6. OLZ, but not SBI-0646535, reduced MK-801-induced increases in locomotor activity.
For direct group comparisons, each individual’s locomotor activity counts were summed in the 30–90 min post-dosing period for MK-801 (main effect of dose: F1.422, 39.46 = 67.00; p < 0.0001) (A) or 60–180 min post dosing period for OLZ (main effect of dose: F1.943, 39.82 = 11.79, p = 0.0001) (B) or SBI-0636535 (C) combinations with MK-801 and graphed as a group mean ± SEM. p < 0.05; a, compared to group’s respective vehicle condition. For MK-801, n = 9–10 O-I, 8–9 Ovx, and 12 Ovx+E rats. For OLZ and SBI-0646535 combinations, n = 8 O-I, 7–8 Ovx, and 8 Ovx+E rats.

Update of

Similar articles

References

    1. Jang D, Elfenbein HA. Menstrual cycle effects on mental health outcomes: a meta-analysis. Arch Suicide Res. 2019;23:312–32. - PubMed
    1. Reilly TJ, Sagnay de la Bastida VC, Joyce DW, Cullen AE, McGuire P. Exacerbation of psychosis during the perimenstrual phase of the menstrual cycle: systematic review and meta-analysis. Schizophr Bull. 2020;46:78–90. - PMC - PubMed
    1. Ray P, Mandal N, Sinha VK. Change of symptoms of schizophrenia across phases of menstrual cycle. Arch Womens Ment Health. 2020;23:113–22. - PubMed
    1. Hallonquist JD, Seeman MV, Lang M, Rector NA. Variation in symptom severity over the menstrual cycle of schizophrenics. Biol Psychiatry. 1993;33:207–9. - PubMed
    1. Huber TJ, Rollnik J, Wilhelms J, von zur Mühlen A, Emrich HM, Schneider U. Estradiol levels in psychotic disorders. Psychoneuroendocrinology. 2001;26:27–35. - PubMed

LinkOut - more resources