

A quantum inspired machine learning approach for multimodal Parkinson's disease screening
- PMID: 40185909
- PMCID: PMC11971407
- DOI: 10.1038/s41598-025-95315-0
A quantum inspired machine learning approach for multimodal Parkinson's disease screening
Abstract
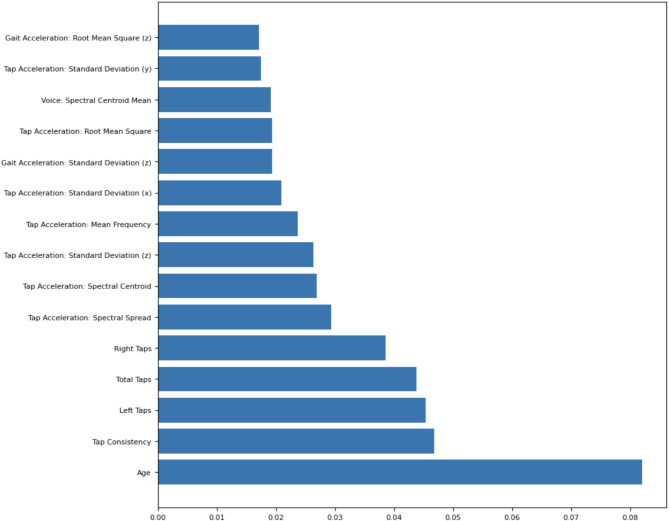
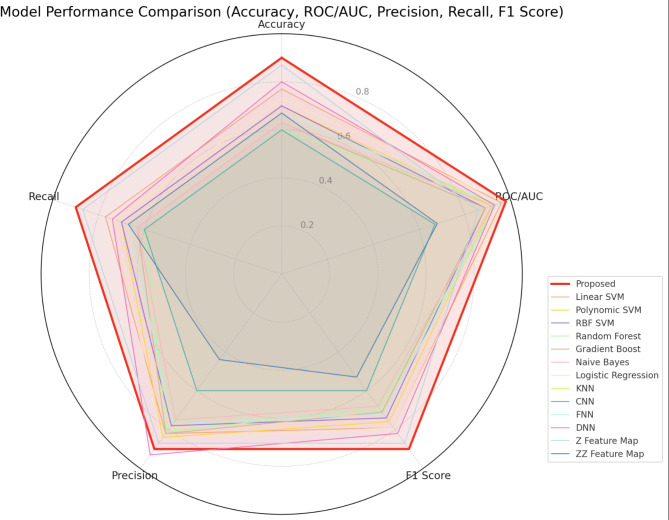
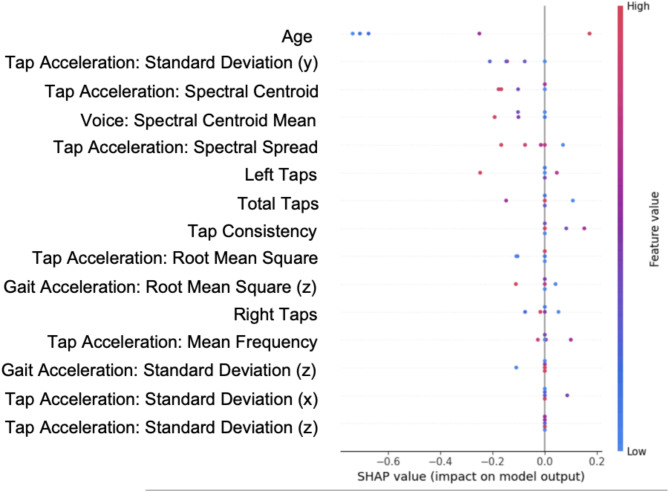
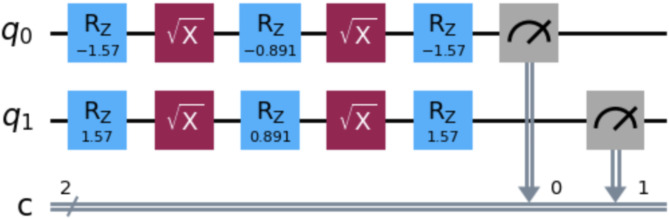
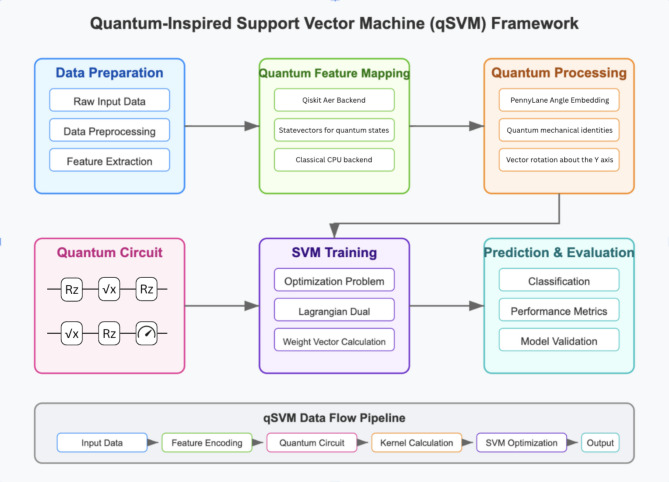
Parkinson's disease, currently the fastest-growing neurodegenerative disorder globally, has seen a 50% increase in cases within just two years. As disease progression impairs speech, memory, and motor functions over time, early diagnosis is crucial for preserving patients' quality of life. Although machine-learning-based detection has shown promise for detecting Parkinson's disease, most studies rely on a single feature for classification and can be error-prone due to the variability of symptoms between patients. To address this limitation we utilized the mPower dataset, which includes 150,000 samples across four key biomarkers: voice, gait, tapping, and demographic data. From these measurements, we extracted 64 features and trained a baseline Random Forest model to select the features above the 80th percentile. For classification, we designed a simulatable quantum support vector machine (qSVM) that detects high-dimensional patterns, leveraging recent advancements in quantum machine learning. With this novel and simulatable architecture that can be run on standard hardware rather than resource-intensive quantum computers, our model achieves an accuracy of 90%, F-1 score of 0.90, and an AUC of 0.98-surpassing benchmark models. Utilizing an innovative classification framework built on a diverse set of features, our model offers a pathway for accessible global Parkinson's screening.
© 2025. The Author(s).
Conflict of interest statement
Declarations. Competing interests: The authors declare no competing interests.
Figures
Similar articles
-
Gait-based Parkinson's disease diagnosis and severity classification using force sensors and machine learning.Sci Rep. 2025 Jan 2;15(1):328. doi: 10.1038/s41598-024-83357-9. Sci Rep. 2025. PMID: 39747956 Free PMC article.
-
Voice biomarkers as prognostic indicators for Parkinson's disease using machine learning techniques.Sci Rep. 2025 Apr 9;15(1):12129. doi: 10.1038/s41598-025-96950-3. Sci Rep. 2025. PMID: 40204799 Free PMC article.
-
Gradient boosting for Parkinson's disease diagnosis from voice recordings.BMC Med Inform Decis Mak. 2020 Sep 15;20(1):228. doi: 10.1186/s12911-020-01250-7. BMC Med Inform Decis Mak. 2020. PMID: 32933493 Free PMC article.
-
Machine learning and wearable sensors for automated Parkinson's disease diagnosis aid: a systematic review.J Neurol. 2024 Oct;271(10):6452-6470. doi: 10.1007/s00415-024-12611-x. Epub 2024 Aug 14. J Neurol. 2024. PMID: 39143345
-
The role of AI and machine learning in the diagnosis of Parkinson's disease and atypical parkinsonisms.Parkinsonism Relat Disord. 2024 Sep;126:106986. doi: 10.1016/j.parkreldis.2024.106986. Epub 2024 May 3. Parkinsonism Relat Disord. 2024. PMID: 38724317 Review.
Cited by
-
Mathematical proof of the Fisher-Escolà Q statistical distribution in quantum consciousness modeling.Comput Struct Biotechnol J. 2025 Apr 26;30:41-58. doi: 10.1016/j.csbj.2025.04.025. eCollection 2025. Comput Struct Biotechnol J. 2025. PMID: 40475802 Free PMC article.
References
-
- DeMaagd, G. & Philip, A. Parkinson’s disease and its management: part 1: disease entity, risk factors, pathophysiology, clinical presentation, and diagnosis. P T: Peer-Reviewed J. Formulary Manage.40, 504–532 (2015). https://www.ncbi.nlm.nih.gov/pmc/articles/PMC4517533/ - PMC - PubMed
-
- Triarhou, L. & National Center for Biotechnology Information (NCBI). Parkinson’s Disease Overview. GeneReviews®. https://www.ncbi.nlm.nih.gov/books/NBK6271/ (2004).
-
- World Health Organization. Parkinson disease. WHO Fact Sheets. https://www.who.int/news-room/fact-sheets/detail/parkinson-disease (2019).
-
- U.S. Department of Health and Human Services. Parkinson’s disease: Challenges, progress, and promise. National Institute of Neurological Disorders and Stroke. https://www.ninds.nih.gov/current-research/focus-disorders/parkinsons-di... (n.d.).
MeSH terms
Substances
LinkOut - more resources
Full Text Sources
Medical
Research Materials
