. 2025 Apr 4:10.1038/s41587-025-02618-8.
doi: 10.1038/s41587-025-02618-8. Online ahead of print.

Severus detects somatic structural variation and complex rearrangements in cancer genomes using long-read sequencing

Affiliations

Severus detects somatic structural variation and complex rearrangements in cancer genomes using long-read sequencing

Ayse G Keskus et al. Nat Biotechnol. .

Abstract

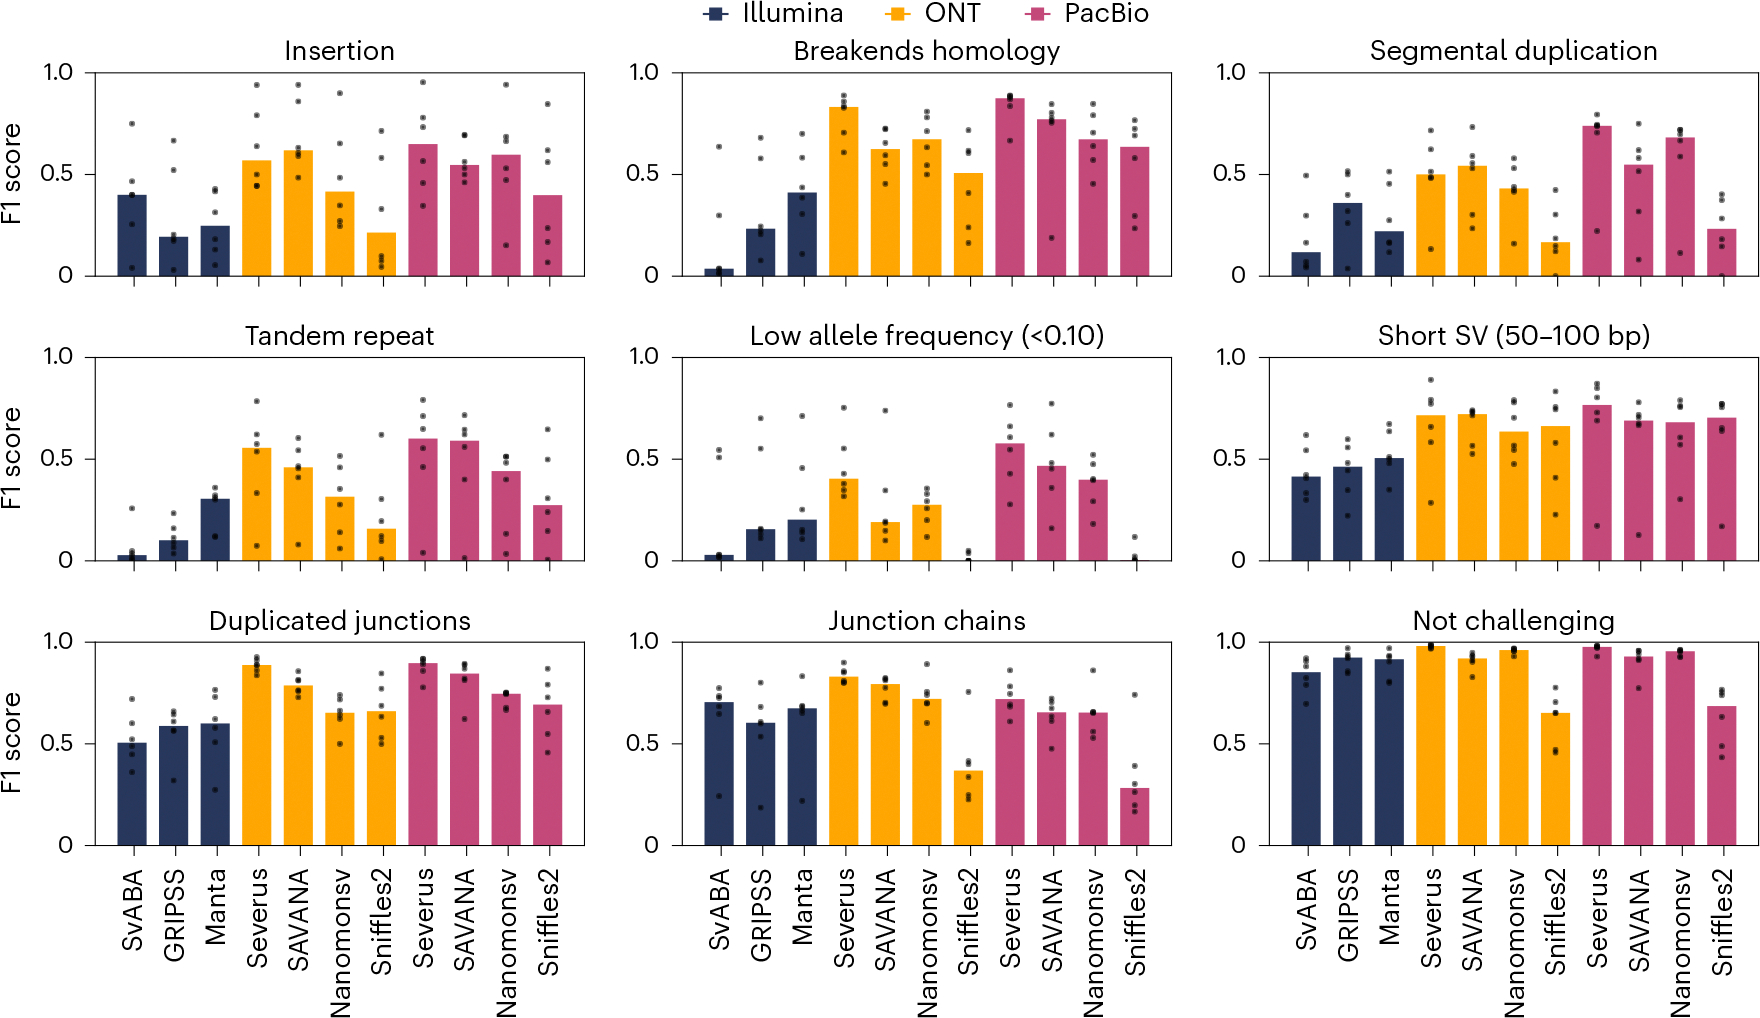
For the detection of somatic structural variation (SV) in cancer genomes, long-read sequencing is advantageous over short-read sequencing with respect to mappability and variant phasing. However, most current long-read SV detection methods are not developed for the analysis of tumor genomes characterized by complex rearrangements and heterogeneity. Here, we present Severus, a breakpoint graph-based algorithm for somatic SV calling from long-read cancer sequencing. Severus works with matching normal samples, supports unbalanced cancer karyotypes, can characterize complex multibreak SV patterns and produces haplotype-specific calls. On a comprehensive multitechnology cell line panel, Severus consistently outperforms other long-read and short-read methods in terms of SV detection F1 score (harmonic mean of the precision and recall). We also illustrate that compared to long-read methods, short-read sequencing systematically misses certain classes of somatic SVs, such as insertions or clustered rearrangements. We apply Severus to several clinical cases of pediatric leukemia/lymphoma, revealing clinically relevant cryptic rearrangements missed by standard genomic panels.


Conflict of interest statement

Competing interests: S.A. is an employee and stockholder of ONT. A.K., P.C., K.S., D.C. and A.C. are employees of Google and own Alphabet stock as part of the standard compensation package. E.G. served on advisory boards for Jazz Pharmaceuticals and Syndax Pharmaceuticals. M.S.F. is part of the speakers bureau for Bayer and PacBio. The other authors declare no competing interests.

Figures

Extended Data Fig. 1 |
Extended Data Fig. 1 |. Consistency tests using the COLO829 Valle-Inclan benchmark.
(a) Consistency of the Truvari and Minda benchmarking tools using COLO829 Valle-Inclan benchmark. Pearson’s correlation coefficient and p-value are shown (n = 18). GRIPSS score was excluded from correlation computational as an outlier. (b) Consistency of the COLO829 Valle-Inclan benchmark and Minda ensemble benchmark (n = 18). (c) Number of SVs that are private and shared within the technology in COLO829 ensemble call list.
Extended Data Fig. 2 |
Extended Data Fig. 2 |. False-Negative and False Positive calls in the COLO829 Valle-Inclan benchmark.
IGV screenshots for (i) SVs present in Valle-Inclan benchmark but not in the samples used in this study (FN SVs in Severus calls, n = 9) and FP SVs in Severus calls (n = 23).
Extended Data Fig. 3 |
Extended Data Fig. 3 |. Call consistency comparison for technologies.
Similarities between SV calls produced by the different technologies. DEL = deletion, BND = breakend junction, DUP = duplication, INV = inversion, INS = insertion.
Extended Data Fig. 4 |
Extended Data Fig. 4 |. Call consistency comparison for tools.
Similarities between SV calls produced by the different tools.
Extended Data Fig. 5 |
Extended Data Fig. 5 |. Variant allelic fraction of SV calls in the CASTLE panel.
Variant allele fraction distribution of confident SVs in the Minda-generated ensembles.
Extended Data Fig. 6 |
Extended Data Fig. 6 |. False Positive calls in the ensemble call set.
Analysis of false-positive calls produced by different tools illustrates that most such calls are singletons (supported by one tool).
Extended Data Fig. 7 |
Extended Data Fig. 7 |. Complex SV clustering in Severus.
A. Example of graphs for detailed type annotations provided by Severus. B. Number of junctions in each subcategory involved in a complex SV. C. The distribution of the size of the complex clusters in cell lines.
Extended Data Fig. 8 |
Extended Data Fig. 8 |. Additional examples of complex SVs discovered by Severus.
Deleted segments in the reconstructed karyotype represented with lighter color.
Extended Data Fig. 9 |
Extended Data Fig. 9 |. Comparison of complex SVs calls made by different tools.
Examples of complex SVs discovered by Severus only and falsely clustered SVs in Jabba and Linx. A. A false complex SV cluster in Linx. B. A large simple deletion was falsely detected as rigma by Jabba. C. Repeat expansion detected as a templated insertion (TIC) in Jabba. D. Breakpoints from different haplotypes clustered together in Jabba. E. An unbalanced translocation detected only by Severus. F. A reciprocal translocation detected as TIC in Jabba. G. A chromoplexy case detected only by Severus.
Extended Data Fig. 10 |
Extended Data Fig. 10 |. Validation of CM2 fusions with RNA sequencing.
IGV screenshots of KMT2A and MLLT10A from the CM2 A. long-read whole genome and B. RNA sequencing.
Fig. 1 |
Fig. 1 |. An overview of the Severus algorithm.
a, SNV calling and phasing using aligned normal data; a phased VCF is then used to haplotag tumor and normal alignments. pat, paternal haplotype; mat, maternal haplotype. b, Handling unstable alignment of reads with indels in VNTR regions, allowing uniform representation of the indels. c, Identification of misaligned reads, for example, from collapsed duplication regions. d, Severus calls haplotype-aware junctions from split alignments and identifies simple junctions (indels and reciprocal inversions). e,f, Severus constructs a phased breakpoint graph from the phased somatic junctions (e) and identifies complex SVs (f).
Fig. 2 |
Fig. 2 |. Benchmarking of Severus and other SV callers with existing benchmarking sets.
a, SV numbers and types for each benchmark; BND, breakend; DEL, deletion; INS, insertion; DUP, duplication; INV, inversion. Corresponding benchmark F1 scores were computed with truvari. b, The HG002 cell line was evaluated using the GIAB HG002 SV benchmark and whole-genome benchmark produced from a curated HG002 assembly. c, CHM1/CHM13 represents a synthetic mix of CHM1 and CHM13 PacBio HiFi data, with CHM1 sequencing as normal; CHM1/CHM13 cell lines were evaluated inside the GIAB HG002 Tier 1 regions. d, The COLO829 benchmark F1 scores computed against the Valle-Inclan et al. call set using Minda. The asterisk (*) indicates that the GRIPSS COLO829 score should be interpreted with caution because this tool (but not the other tools) was used to build the original COLO829 benchmark.
Fig. 3 |
Fig. 3 |. Benchmarking Severus and other SV callers using the CASTLE panel.
Confident SVs are supported by at least two of three technologies and 4 of 11 call sets. F1 scores are evaluated against the confident sets using Minda. a, Number of confident SVs and their types. b, Median F1 scores, precision, recall and error counts of each tool across six cell lines, grouped by sequencing technology. Individual cell lines are shown as dots. Colors show different sequencing technologies; FP, false positive; FN, false negative. c,d, Performance of SV calling tools with variable levels of coverage (c) and tumor purity and normal contamination at ~30× coverage for HCC1395 and HCC1954 cell lines (d). Colors show different SV calling tools.
Fig. 4 |
Fig. 4 |. Stratification of error patterns of different sequencing technologies and algorithms on the CASTLE panel.
SV detection F1 scores are stratified by various challenging scenarios. Medians over six cell lines are shown, and individual cell lines are shown as dots. Stratification and score computation were performed using Minda. Colors show different sequencing technologies. Challenging categories may overlap. Repetitive genome regions are annotated using RepeatMasker tracks. Duplicates and rearrangement chains are defined for the union of all calls produced by all tools on a particular dataset. ‘Not challenging’ reflects variants that do not belong to any challenging category.
Fig. 5 |
Fig. 5 |. Overview of the complex SVs identified by Severus.
a, Examples of simple and complex SVs from each junction type; head-to-tail (deletion-like), tail-to-head (duplication-like), head-to-head/tail-to-tail (inversion-like) and interchromosomal (translocation-like). Each colored arrow is a genomic segment, and the direction of the arrows represents the direction of the segment. Red dashed lines represent junctions. Simple SVs are indicated with a gray box and are not included in breakpoint graph construction; Ref, reference. b, Number of junctions in simple SVs and complex SVs in each cell line. c, The distribution of junctions as unphased, a single phased junction within a phase block and multiple junctions within a block; cis and trans refer to the same or different phases of two adjacent variants, respectively. d,e, Examples from Severus output for the complex SV (d) chromothripsis-like event in chromosome 21 (chr21) in the HCC1954 cell line and in chr9 in the H1437 cell line (e); M, million; HH, head-to-head; TT, tail-to-tail; TH, tail-to-head; HT, head-to-tail; Interchr, interchromosomal. f,g, Chromoplexy in the HCC1395 cell line (f) and reciprocal translocation with local amplification in HCC1937, misclassified as templated insertion by short-read SV clustering tools (g).
Fig. 6 |
Fig. 6 |. Severus identifies clinically relevant rearrangements in pediatric leukemia/lymphoma samples.
a, Number of somatic SV calls. b, Cryptic multibreakpoint reciprocal translocation between chr10 and chr11 in CM2 leads to a KMT2A-MLLT10 fusion. c, Chromoplexy between chr2, chr4 and chr11 in CM4. d, A complex translocation event between chr1 and chr14 in CM5. Reads are colored with the haplotype in IGV screenshots; HP1, haplotype 1; HP2, haplotype 2. e, Complex translocation with inversion between chr1 and chr13 in CM6. Junctions are represented with dashed lines.

References

    1. Cosenza MR, Rodriguez-Martin B & Korbel JO Structural variation in cancer: role, prevalence, and mechanisms. Annu. Rev. Genomics Hum. Genet. 23, 123–152 (2022). - PubMed
    1. Stephens PJ et al. Massive genomic rearrangement acquired in a single catastrophic event during cancer development. Cell 144, 27–40 (2011). - PMC - PubMed
    1. Li Y et al. Patterns of somatic structural variation in human cancer genomes. Nature 578, 112–121 (2020). - PMC - PubMed
    1. Carvalho CMB & Lupski JR Mechanisms underlying structural variant formation in genomic disorders. Nat. Rev. Genet. 17, 224–238 (2016). - PMC - PubMed
    1. Drews RM et al. A pan-cancer compendium of chromosomal instability. Nature 606, 976–983 (2022). - PMC - PubMed

LinkOut - more resources