. 2025 May;44(10):2827-2855.
doi: 10.1038/s44318-025-00424-1. Epub 2025 Apr 4.

Transcriptional landscapes underlying Notch-induced lineage conversion and plasticity of mammary basal cells

Affiliations

Transcriptional landscapes underlying Notch-induced lineage conversion and plasticity of mammary basal cells

Candice Merle et al. EMBO J. 2025 May.

Abstract

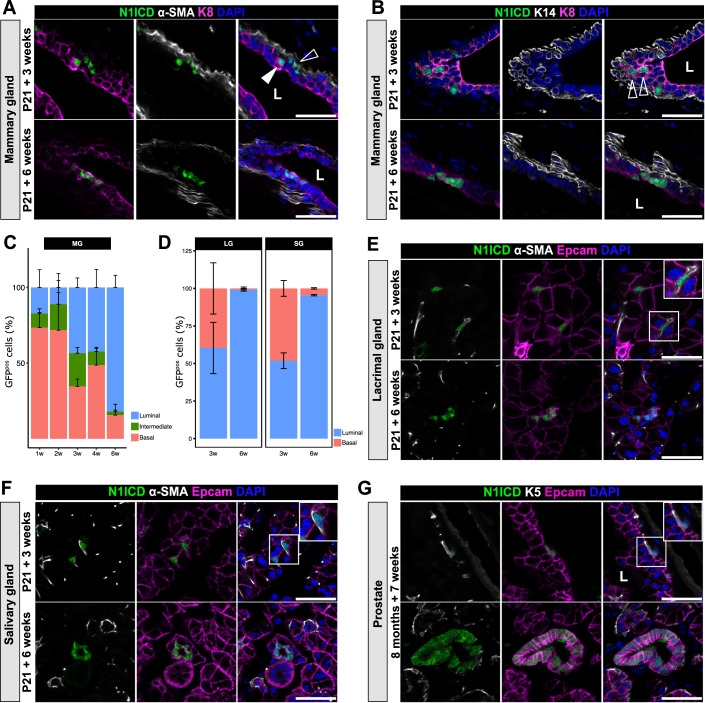
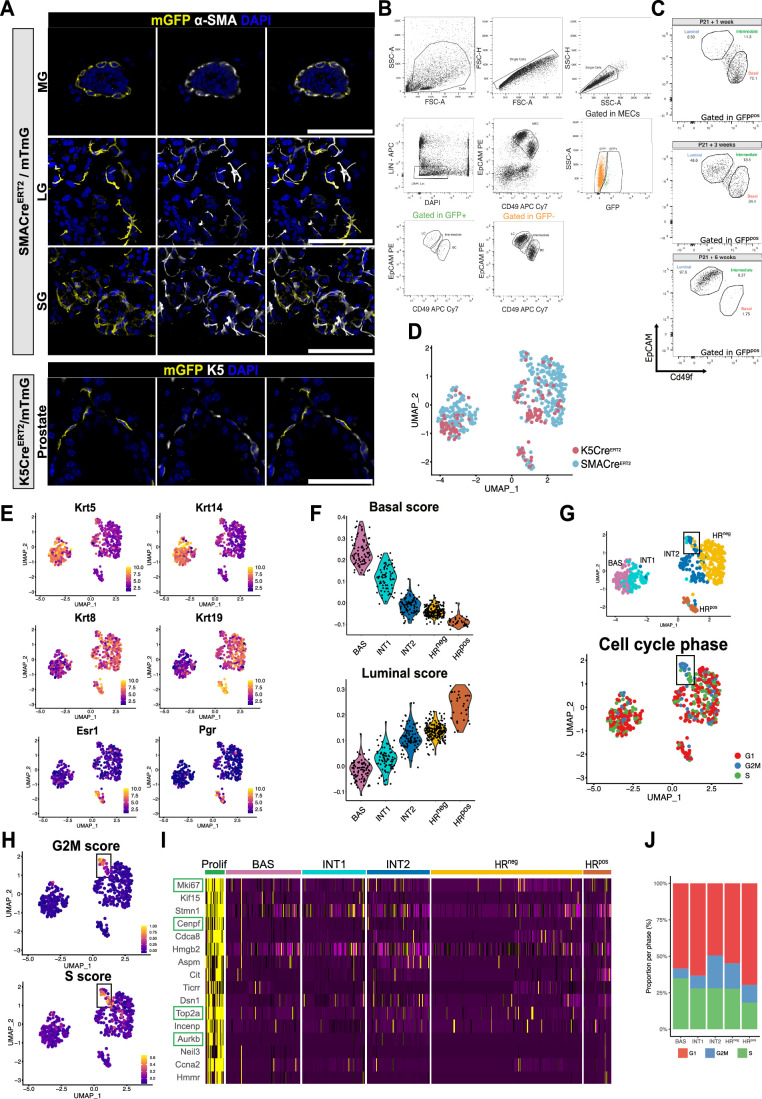
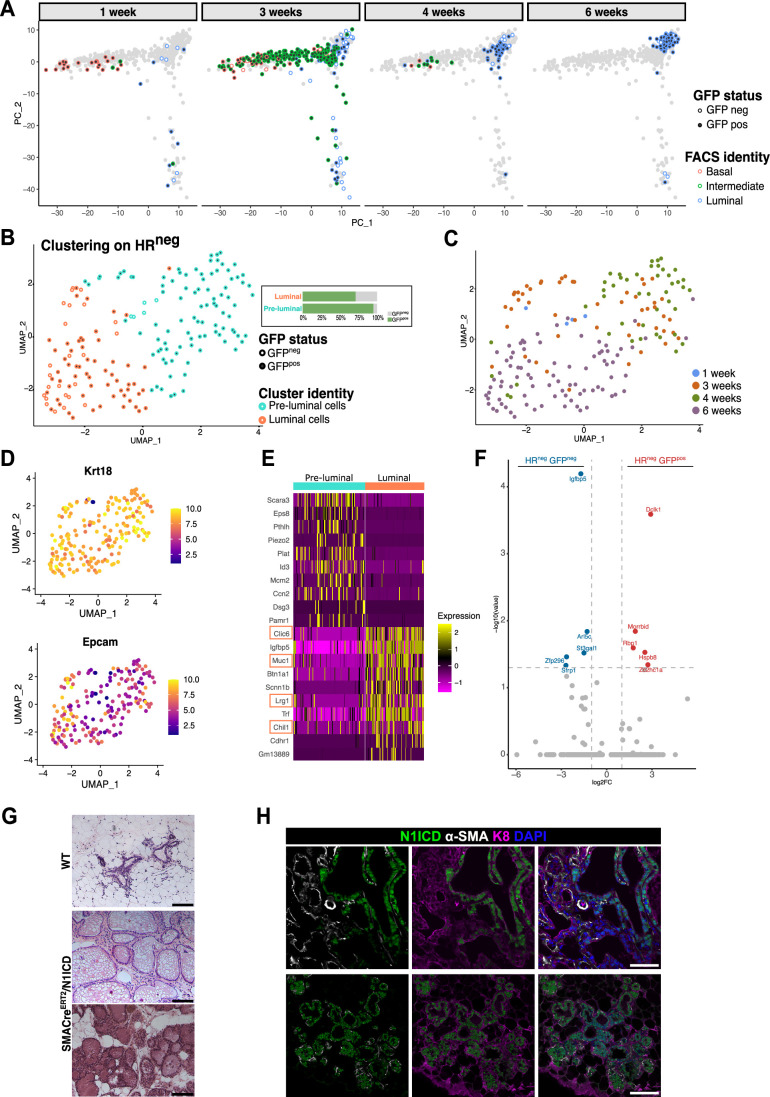
The mammary epithelium derives from multipotent mammary stem cells (MaSCs) that engage into differentiation during embryonic development. However, adult MaSCs maintain the ability to reactivate multipotency in non-physiological contexts. We previously reported that Notch1 activation in committed basal cells triggers a basal-to-luminal cell fate switch in the mouse mammary gland. Here, we report conservation of this mechanism and found that in addition to the mammary gland, constitutive Notch1 signaling induces a basal-to-luminal cell fate switch in adult cells of the lacrimal gland, the salivary gland, and the prostate. Since the lineage transition is progressive in time, we performed single-cell transcriptomic analysis on index-sorted mammary cells at different stages of lineage conversion, generating a temporal map of changes in cell identity. Combining single-cell analyses with organoid assays, we demonstrate that cell proliferation is indispensable for this lineage conversion. We also reveal the individual transcriptional landscapes underlying the cellular plasticity switching of committed mammary cells in vivo with spatial and temporal resolution. Given the roles of Notch signaling in cancer, these results may help to better understand the mechanisms that drive cellular transformation.

Keywords: Epithelial Stem Cells; Lineage Conversion; Notch1 Signaling; Plasticity.


Conflict of interest statement

Disclosure and competing interests statement. The authors declare no competing interests.

Figures

Figure 1
Figure 1. In vivo reprogramming of adult BCs to LCs by Notch1 activation in four bi-layered glandular epithelia.
(A) Representative images of SMACreERT2/N1ICD mammary gland sections induced at P21 and analyzed 3 or 6 weeks later by immunofluorescence for nGFP (correlated to N1ICD expression in green), the basal marker α-SMA (white) and the luminal marker K8 (purple). Nuclei are stained with DAPI (blue). The empty arrowhead indicates basal mutant cells, the white arrowhead indicates a luminal mutant cell at 3-week chase. (B) Representative sections of SMACreERT2/N1ICD mammary glands induced at P21 and analyzed 3 or 6 weeks later by immunofluorescence for nGFP (correlated to N1ICD expression in green), the basal marker K14 (white) and the luminal marker K8 (purple). Nuclei are stained with DAPI (blue). Empty arrowheads indicate mutant cells co-expressing nGFP, K14 and K8. (C) Quantification by flow cytometry of the percentage of nGFPpos basal (CD49fhigh/EpCAMlow), intermediate (CD49fmed/EpCAMmed) and luminal (CD49flow/EpCAMhigh) cells 1, 2, 3, 4, and 6 weeks after tamoxifen induction at P21 (bars represent mean ± SEM) in MG. n = 6. (D) Quantification by immunofluorescence on sections of the percentage of GFPpos cells classified as basal (αSMApos) or luminal (EpCAMhigh) 3 or 6 weeks after activation of N1ICD in LG and SG. Bars represent mean ± SEM. n = 3. (E, F) Representative sections of SMACreERT2/N1ICD lacrimal glands (E) or salivary glands (F) induced at P21 and analyzed 3 or 6 weeks later by immunofluorescence for nGFP (N1ICD in green), the basal marker α-SMA (white) and the luminal marker EpCAM (purple). Nuclei are stained with DAPI (blue). Insets illustrate magnifications of the white boxed areas. (G) Representative sections of K5CreERT2/N1ICD prostate induced at 8 months and analyzed 7 weeks later by immunofluorescence for nGFP (N1ICD in green), the basal marker K5 (white), and the luminal marker EpCAM (purple). Nuclei are stained with DAPI (blue). Inset illustrates magnifications of the white boxed areas. Scale bar represents 25 µm in (A, B, EG). “L” indicates the lumen position in (A, B, G).
Figure 2
Figure 2. Index-sorted single-cell RNAseq reveals the hybrid signatures of transitioning intermediate mutant cells.
(A) UMAP plot showing the identity of each index-sorted cell along with their GFP status. Cells are color-coded based on their FACS-defined identity as Basal (red), Intermediate (green), and Luminal (blue) cells. Mutant cells (GFPpos) are depicted as filled dots; WT cells (GFPneg) are shown as empty dots. (B) UMAP plot showing clustering of single sequenced cells by Smart-seq2. 5 Seurat clusters were identified: BAS basal cells (pink), INT1 intermediate 1 (turquoise), INT2 intermediate 2 (dark blue), HRneg hormone receptorneg (yellow), and HRpos hormone receptorpos cells (brown). BAS = 89 cells, INT1 = 79 cells, INT2 = 89 cells, HRneg = 184 cells, HRpos = 33 cells. (C) Scatter plot representing the adjusted proportion of basal markers found in the BAS cluster (y-axis) and of luminal markers detected in the HRneg cluster (x-axis). Every dot represents a cell, and the colors reflect the clusters defined in Fig. 2B. (D) Heatmap showing the expression levels of genes specific for each cell cluster illustrated in (B). Each column is color-coded according to the corresponding cell cluster from (B). The color key corresponds to normalized and scaled values of gene expression. (E) UMAP plot showing enrichment for the GO term “Cell cycle” across individual cells. The bar plot represents the number of cells, grouped by cluster, within the rectangular selected region in the UMAP representation.
Figure 3
Figure 3. Lineage trajectory and transcriptional signatures defining the progressive transition from basal to luminal identity.
(A) Slingshot trajectory analysis showing two cellular paths, connecting BAS cells to HRneg (trajectory 1) or HRpos (trajectory 2) clusters in a PCA plot. (B) Expression of selected genes within cells plotted along trajectory 1 in pseudotime. The integrated gene expression is plotted; dots correspond to individual cells color-coded according to the UMAP clusters from Fig. 2B. (C) Expression of selected basal and luminal genes along pseudotime trajectory 1. (D) SCENIC analysis showing the Regulon specificity score (RSS) for each cluster: only the six most significant TF regulons showing cluster-specific activity are indicated. (E) Venn diagram presenting the number of overlapping regulons among the 50 most significant TF regulons for each cell cluster.
Figure 4
Figure 4. Proliferation is an obligatory step for lineage transition in organoids.
(A) Representative images showing immunofluorescence for nGFP (N1ICD in green), luminal K8 (purple), and basal α-SMA (white) expression in SMACreERT2/N1ICD mutant mammary organoids 3 or 6 days after 4-OHT induction. (B) Quantification of the proportion of nGFP+ BC (basal in red) or LC (luminal in blue) mutant cells in mammary gland (MG), LG, SG, and prostate, in OHT only, OHT + DMSO, OHT + Aphidicolin, or OHT + U0126 for 6 days. Data were displayed as mean ± SEM. This graph represents three independent experiments and a minimum of six organoids. (C) Representative images showing immunofluorescence for nGFP (N1ICD in green), luminal K8 (purple), and basal α-SMA (white) expression in SMACreERT2/N1ICD mutant mammary organoids treated with DMSO, Aphidicolin or U0126 for 6 days and after 4-OHT induction. At least five organoids were counted per condition. (D) Representative images showing immunofluorescence for nGFP (N1ICD in green), luminal K8 (purple), and basal α-SMA (white) expression in SMACreERT2/N1ICD mutant mammary organoids treated with Aphidicolin for 6 days and grown for another 4 days upon Aphidicolin washout or treated with Aphidicolin for 10 consecutive days. Nuclei are stained with DAPI in blue. The scale bar represents 50 µm in (A, C, D) and 10 µm for the magnified insets (in A, C). Empty arrowheads indicate cells that have not undergone cell fate switch at the time of the analysis, white arrowheads indicate nGFPpos luminal cells (in D). (E) Quantification of the proportion of nGFPpos BC (in red) or LC (in blue) mutant cells within each organoid after 10 days of DMSO or aphidicolin treatment or after Aphidicolin washout for 4 days. Data were displayed as mean ± SEM. This graph represents three independent experiments and a minimum of five organoids.
Figure 5
Figure 5. Dynamic behavior of lineage transitioning cells by time-lapse analysis.
(A, B) Sequential time-lapse images of SMACreERT2/mTmG/N1ICD organoids showing recombined GFPpos (green) cell rearrangements over 5 h. Red: non-recombined tdTomatopos cells. White arrowheads in (A) pinpoint a mutant BC that first divides (between 1 h 20 min and 1 h 40 min time frames), and then one of the two daughter cells moves to a luminal position after mitosis. The empty arrowheads in (B) depict the mitosis of a WT basal cell whose daughters stay in the basal outer cell layer after division. Scale bar represents 25 µm. (C) Representative images showing immunofluorescence for mGFP (indicating recombined cells in yellow), Hes1 (marking nuclei and reflecting Notch activation in turquoise), and tdTomato expression in red in organoids grown for 3 days. Nuclei are stained with DAPI in blue. White arrowhead indicates mutant cells (Hes1 positive) and empty arrowhead indicate WT cells (Hes1 negative). Scale bar 50 µm. (D) Quantification by immunofluorescence of the proportion of mGFPpos basal or luminal cells classified based on their expression of HES1 and analyzed 3 or 6 days after 4-OHT induction. For the organoids composed exclusively of Hes1pos cells, we classified all cells as luminal, based on the analysis performed in Fig. 4A.
Figure EV1
Figure EV1. Transcriptional signatures characterizing the different cell clusters identified by UMAP analysis.
Related to Fig. 2. (A) Representative images of SMACreERT2/mTmG mammary gland (MG), lacrimal gland (LG), salivary gland (SG), and K5CreERT2/mTmG prostate sections induced at P21 and analyzed 6 weeks later by immunofluorescence for mGFP (yellow) and the basal marker α-SMA (white), demonstrating that α-SMApos cells are exclusively BCs, indicating unipotency. Scale bars represent 50 µm. (B) Gating strategy used for cell sorting experiments. Doublets, Linpos and dead cells (DAPIpos) were excluded from further analysis. (C) FACS plots showing the gates defining luminal (EpCAMhigh/Cd49flow), intermediate (EpCAMmed/Cd49fmed), and basal (EpCAMlow/Cd49fhigh) sorted cells from SMACreERT2/N1ICD mammary glands induced at P21 and chased for 1, 3, or 6 weeks, that were used for SMARTseqV2. The percentages of each population are indicated for one representative experiment. (D) UMAP plot showing the distribution of each sequenced cell in the different clusters based on the Cre mouse used to target them (K5CreERT2 or SMACreERT2). (E) UMAP plots show the expression of well-defined markers for basal (Krt5, Krt14), luminal (Krt8, Krt19), and HRpos (Esr1, Pgr) cells. (F) Violin plots representing basal and luminal scores, based on signatures from (Kendrick et al, 2008) for each cluster. (G) UMAP plot indicating the cell cycle phases for each sequenced cell. The boxed cells correspond to the proliferative population highlighted in Fig. 2E. (H) UMAP plots are color-coded according to the expression of the single-cell G2M and S score. (I) Heatmap showing the genes presenting a high expression in the proliferative group. (J) Proportion of cells in different cell cycle phases (G1, G2M, or S) in each cluster.
Figure EV2
Figure EV2. Lineage trajectories of cell fate switch and associated transcriptional features.
Related to Fig. 3. (A) PCA plots highlighting changes in cell transcriptional state along the basal-luminal differentiation trajectory, at different timepoints following N1ICD activation. Colored dots indicate the FACS gate information for each index-sorted cell, based on the cell surface markers EpCAM and Cd49f. (B) UMAP refined analysis of the HRneg cluster indicating GFPpos and GFPneg cells. The two new resulting subclusters appearing are indicated by different colors (turquoise and orange). The boxed graph represents the percentage of GFPpos (green) and GFPneg (gray) cells for each cluster, showing the predominance of GFPpos mutant cells in the pre-luminal cluster. (C) UMAP representation of the distribution of mutant nGFPpos cells belonging to the HRneg cluster color-coded based on the different timepoints after N1ICD induction, as indicated. (D) UMAP representations of the two luminal subclusters show the expression levels of two luminal-specific genes (Krt18 and Epcam) for each cell. (E) Heatmap showing differentially expressed genes (DEGs) distinguishing the pre-luminal and luminal clusters. (F) Volcano Plot of DEGs between HRneg GFPpos (170 cells) (red dots) and HRneg GFPneg (34 cells) (blue dots) cells. (G) Hematoxylin and Eosin staining of WT (wild-type) mammary gland and mammary tumor sections following N1ICD activation. Wild-type mouse mammary glands were collected after one pregnancy, while tumors were harvested after three pregnancies, followed by 10 to 15 days of involution. (H) Immunofluorescence anti-GFP (corresponding to N1ICD), α-SMA, and K8 on sections of mammary tumors developed upon N1ICD activation, three pregnancies, and 10 days of involution showing the clonal expansion of mutant nGFPpos cells. Nuclei are stained with DAPI. Scale bars represent 100 µm in (G, H).
Figure EV3
Figure EV3. Integration of SMART-N1ICD dataset with scRNAseq from embryonic and adult hybrid mammary cells.
Related to Fig. 3. (A) PCA plots showing the integration of our data (SMART-N1ICD) and the dataset from Wuidart et al (Wuidart et al, 2018). (B) Alluvium plots showing label transfer of each cell cluster using the Wuidart dataset as reference. (C) UMAP plot representing enrichment for the EMP score derived from Wuidart et al, dataset. Purple represents the lowest EMP score and yellow the highest EMPs score. (D) PCA plots showing the integration of our data (SMART-N1ICD) and the dataset from Centonze et al, (Centonze et al, 2020). (E) Alluvium plots showing label transfer of each cell cluster using the Centonze dataset as reference. (F) Alluvium plots showing label transfer of each cell cluster in the Pal et al, dataset either from TEBs (left) or from pubertal ducts (right) using our dataset (Smart-N1ICD) as reference. (G) Alluvium plot showing label transfer of each cell cluster in the Bach et al., dataset performed at pregnancy using our dataset (Smart-N1ICD) as reference.
Figure EV4
Figure EV4. Pseudotime ordering identifies the transcriptional signatures associated with the progressive lineage transition from BCs to LCs.
Related to Fig. 3. (A) Heatmap illustrating the top 40 genes exhibiting a differential pattern of expression along the pseudotime from basal to luminal (HRneg) identity. The clusters are color-coded, as in Fig. 2B. (B) Heatmap showing the dynamic expression profile of each gene towards the lineage switch trajectory, distinguishing six different patterns of expression along the process of basal to luminal transition. (C) GO terms associated with the genes defining the six groups in (B). p values were defined using one-sided Fisher’s exact statistical test. (D) Heatmap showing the top transcriptional regulons specific to each cluster (based on RSS analysis), plotted along the pseudotime trajectory 1. Boxed genes are described in the text. (E) UMAP plots showing the expression of regulons specific to cluster INT2, based on Fig. 3E.
Figure EV5
Figure EV5. Lineage switch and BCs unipotency are recapitulated in organoids.
Related to Figs. 4, 5. (A) Quantification of the proportion of GFPpos cells in basal and luminal FACS gates after induction at pre-puberty (3w) or adulthood (10w), showing the incomplete cell fate switch after a 6-week chase in adult mice. Data were displayed as mean ± SEM, and represent at least three mice. (B) Percentage of Ki67-positive mammary epithelial cells (MECs) in pubertal (4w) or adult (8w) mice. n = 3 mice with a total of 16 sections for pubertal mice and 19 sections for adult mice. p value = 0.009 defined by t-test. (C) FACS plots showing the percentage of mutant GFPpos cells after 48 h induction in pubertal or adult mice, demonstrating invariant recombination efficiency. (D) Representative immunofluorescence images showing mGFP, α-SMA, and K8 expression, 6 days after 4-OHT induction of SMACreERT2/mTmG control organoids. Scale bar 50 µm. (E) Quantification of the proportion of mutant nGFPpos basal and luminal cells per organoid at the indicated times after induction in SMACreERT2/N1ICD mice or 6 days after tamoxifen in SMACreERT2/mTmG control animals. Error bars represent mean ± SEM. A minimum of 18 organoids were analyzed for each condition and included three independent experiments. (F) Representative images of SMACreERT2/N1ICD (SG and LG) or K5CreERT2/ N1ICD (prostate) organoids showing mutant cells (nGFPpos), featuring the expression of the luminal marker Epcam and the absence of basal markers (α-SMA or K5, as indicated). Scale bar 50 µm. (G) Representative images of EdU staining in SMACreERT2/N1ICD organoids treated with DMSO, Aphidicolin, and U0126. Scale bar represents 50 µm. (H) Quantification of EdUpos cells per organoids after 6 days in culture with DMSO, Aphidicolin, or U0126. *** indicates p value <0.0001 (p value = 2.04e-10 for DMSO/Aphidicolin and 2.04e-10 for DMSO/U0126, using Wilcoxon test). Data were displayed as mean ± SEM and represented three independent experiments with at least 40 organoids in total. (I) Quantification of the proportion of EdU positive or negative WT (GFPneg) or mutant (GFPpos) BCs in organoids 3 days after induction. Data were displayed as mean ± SEM and 19 organoids were analyzed from three independent experiments.
Figure EV6
Figure EV6. Proliferation is an obligatory step for lineage transition in salivary, lacrimal, and prostate organoids.
Related to Fig. 4. (AC) Representative images showing immunofluorescence for nGFP (N1ICD in green), the luminal marker Epcam (purple) and the basal gene α-SMA (white) in SMACreERT2/N1ICD salivary (A) and lacrimal (B) gland organoids, or the basal gene K5 (white) in K5CreERT2/N1ICD prostate (C) organoids treated with DMSO, Aphidicolin or U0126 for 6 days. Nuclei are stained with DAPI in blue. The scale bar represents 50 µm in (A–C) and 10 µm in the magnified insets. (D) Quantification of the proportion of basal GFPpos cells after 48 h of induction in SMACreERT2/N1ICD and SMACreERT2/mTmG adult mice, showing the difference in recombination efficiency with the two Cre drivers.

References

    1. Afshar-Sterle S, Carli ALE, O’Keefe R, Tse J, Fischer S, Azimpour AI, Baloyan D, Elias L, Thilakasiri P, Patel O et al (2024) DCLK1 induces a pro-tumorigenic phenotype to drive gastric cancer progression. Science Signaling 17:eabq4888 - PubMed
    1. Aibar S, González-Blas CB, Moerman T, Huynh-Thu VA, Imrichova H, Hulselmans G, Rambow F, Marine J-C, Geurts P, Aerts J et al (2017) SCENIC: single-cell regulatory network inference and clustering. Nat Methods 14:1083–1086 - PMC - PubMed
    1. Allan GJ, Beattie J, Flint DJ (2004) The role of IGFBP-5 in mammary gland development and involution. Domest Anim Endocrinol 27:257–266 - PubMed
    1. Anders S, Pyl PT, Huber W (2015) HTSeq—a Python framework to work with high-throughput sequencing data. Bioinformatics 31:166–169 - PMC - PubMed
    1. Bach K, Pensa S, Grzelak M, Hadfield J, Adams DJ, Marioni JC, Khaled WT (2017) Differentiation dynamics of mammary epithelial cells revealed by single-cell RNA sequencing. Nat Commun 8:2128 - PMC - PubMed

LinkOut - more resources