. 2025 Apr;57(4):836-855.
doi: 10.1038/s12276-025-01438-9. Epub 2025 Apr 4.

Hepatocyte TM4SF5-mediated cytosolic NCOA3 stabilization and macropinocytosis support albumin uptake and bioenergetics for hepatocellular carcinoma progression

Affiliations

Hepatocyte TM4SF5-mediated cytosolic NCOA3 stabilization and macropinocytosis support albumin uptake and bioenergetics for hepatocellular carcinoma progression

Haesong Lee et al. Exp Mol Med. 2025 Apr.

Abstract

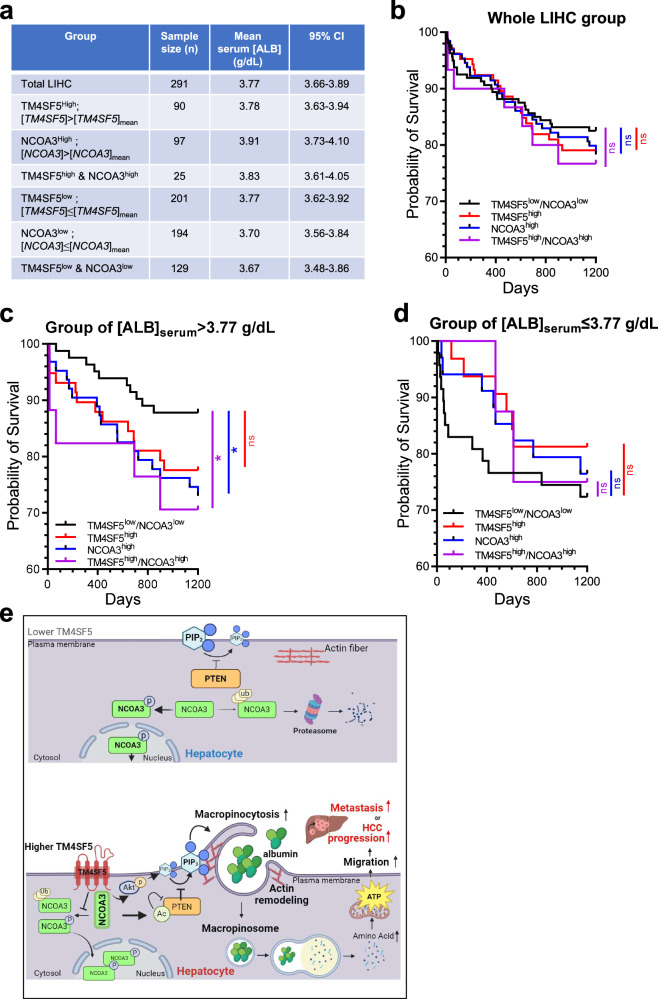
Transmembrane 4 L six family member 5 (TM4SF5) is involved in hepatocellular carcinoma (HCC) development and progression. Although TM4SF5 also promotes migration and invasion, it remains unclear how the metabolic context affects metastatic potential. Here we explored how TM4SF5 affects albumin uptake for HCC progression using TM4SF5 knockout or reintroduced hepatocyte and animal systems. Serum-deprived hepatocytes formed filopodia-like processes depending on TM4SF5 expression, which was altered by albumin replenishment for membranous PIP3-dependent macropinocytosis. Macropinocytosis required nuclear receptor coactivator 3 (NCOA3) stabilized in the cytosol and PTEN inactivation via binding to TM4SF5WT. TM4SF5-mediated albumin uptake led to ATP-linked respiration and cellular migration. Tumor tissues from liver-orthotopically xenografted mice fed a high protein diet or human liver cancer tissues showed TM4SF5-dependent macropinocytosis and NCOA3-correlated metastatic features, unlike mice fed a normal chow diet or human nontumor regions. These observations indicate that serum albumin availability to TM4SF5-positive HCC could support multifocality and intrahepatic metastasis, which may provide insights into clinical observations of multiple small tumor nodules surrounded by areas with high serum albumin levels.


Conflict of interest statement

Competing interests: The authors have no conflicts of interest to declare.

Figures

Fig. 1
Fig. 1. Hepatocyte TM4SF5 has differential effects on filopodia-like processes depending on available nutrients.
a Enrichment plot by the Kyoto Encyclopedia of Genes and Genomes pathway of actin cytoskeleton organization depending on ectopic TM4SF5 expression in SNU449 hepatocytes. b TM4SF5 immunoblots of representative clones of TM4SF5-KO or control (non-KO) hepatocyte variants via a CRISPR–Cas9 approach from parental Huh7 and Hep3B cells with endogenous TM4SF5. The subscripts indicate different Huh7KO cell variants. The band intensity ratio values were measured by ImageJ and normalized to those of the loading control. c, d TM4SF5WT-HA cDNA transfected into Huh7-KO1#2 cells for 24 h were replated on collagen I (10 μg/ml) without (SFM) or with 10% FBS or SFM + ALB (3.6 mg/ml) with basal GLU before phalloidin staining (c) or onto collagen I in basal GLU-containing SFM with or without ALB (d). In c, representative images with pseudo-colors per HA tag-stained cell are presented (n ≥ 20, each data point is a value from one individual cell). In d, the automatic quantification of filopodia-like processes (or protrusions) per cell visualized by rhodamine–phalloidin staining was performed using the Fiji plugin ADAPT (v1.193). Each dot indicates the protrusion numbers of a cell. eg Huh7-KO1#2 (e and f) or Hep3B-KO1#6 (g) cells reconstituted with the indicated cDNA were replated to different ECM or poly-l-lysine (10 μg/ml) for 16 h in the GLU + SFM condition before fluorescence staining of the HA tag: rcn (e) and quantified for filopodia-like protrusions (f and g). hj Huh7KO cell variants on collagen I were treated with DMSO, control compound or TSAHC as above (h), with replenishment of GLU alone or GLU + ALB to SFM (i) or of none or GLU alone (j), before imaging and protrusion quantification. P values were calculated via one-way ANOVA or unpaired Student’s t-tests, and P < 0.05 was considered statistically significant. k Huh7-KO1#2 cells transduced with lentivirus for different cDNAs were manipulated as in c, before immunoblots. Data represent three independent experiments. See also Supplementary Figs. 1, 2 and 4.
Fig. 2
Fig. 2. Nutrient-dependent morphological alterations led to ALB uptake.
a Parental or TM4SF5-KO Huh7 cells replated on collagen I with ALB + GLU (3.6 mg/ml and 25 mM, respectively) replenishment to SFM were incubated with FITC-ALB (0.1 mg/ml) for 16 h, before imaging of FITC-ALB. bd Huh7-KO1#2 cells reconstituted with pmCherry control, pmCherry-TM4SF5WT or pmCherry-TM4SF5A132V for 48 h were processed for analysis of macropinocytosis-mediated FITC-ALB uptake in replenishment of GLU alone (b) or ALB + GLU to SFM (c) or GLU-free SFM (d) for 16 h: representative images are shown (b) and the FITC-ALB spot numbers per cell counted using IMARIS software were graphed as mean ± s.e.m. (c and d). Each data dot depicts a value from one individual cell (c and d). e Huh7KO cell variants prepared as in b were replated on collagen I and processed to analyze FITC-ALB uptake with or without replenishment of GLU or ALB alone to SFM for 16 h. f Bubble blots showing the fold changes in DEMRGs from TCGA datasets of cancer types with or without substantially altered TM4SF5 expression in tumor tissue compared with nontumor tissues. g Huh7KO cell variants reconstituted with control, TM4SF5WT-HA or TM4SF5A132v-HA cDNA were replated on collagen I with or without replenishment of GLU alone, GLU + FBS (10%) or GLU + ALB to SFM for 16 h before the collection of whole-cell extracts for immunoblots. The band intensity ratio values of a molecule were measured by ImageJ and normalized to those of a loading control or the total form of the molecule. hj Huh7-KO3#2 cells (h and i) were reconstituted with TM4SF5WT or TM4SF5A132V or HepG2 cells transfected with control siRNA or TM4SF5 siRNA (no. 4 or 7 of the target sequence, j and Table 1) were then replated on collagen I with replenishment of ALB alone (0.9 or 3.6 mg/ml, h), GLU alone (i), or ALB + GLU (j) to SFM for 16 h before analysis of macropinocytosis-mediated FITC-ALB uptake. P values were calculated via one-way ANOVA or unpaired Student’s t-tests, and P < 0.05 was considered statistically significant. Data represent three independent experiments. See also Supplementary Figs. 3 and 4.
Fig. 3
Fig. 3. TM4SF5 WT promoted PIP3-mediated macropinocytosis depending on nutrient replenishment.
a SNU761 hepatocytes stably transfected with pmCherry-TM4SF5WT were live imaged in normal culture media at 37 °C and 5% CO2. b TM4SF5-negative SNU449Cp or TM4SF5-positive SNU449Tp cells in normal culture conditions were processed for scanning electron microscopy. The yellow circles were enlarged for membrane ruffling (bottom). c SNU449 cells exogenously transfected with TM4SF5WT conjugated with APEX2 were processed for transmission electron microscopy. Note that membrane edges showed ruffling with TM4SF5-APEX2-positive dark dots. d Huh7KO cell variants replenished with GLU alone or ALB + GLU to SFM for 16 h were processed for immunoblotting. The band intensities measured by ImageJ software were normalized to those of the loading control. e A schematic of possible molecular linkage from TM4SF5 to PIP3 for ruffling and macropinocytosis. f, g Huh7-KO1#2 cells transduced with control, TM4SF5WT or TM4SF5A132V lentivirus were replated on collagen I and cells were then imaged to observe nondifferential TM4SF5 expression (f) or transiently transfected with pEGFP-AKT-PH for 24 h and manipulated as above for serum starvation and nutrient replenishment, before live imaging (15 s intervals for 20 min) around cellular edges (g). Representative images were collected and are presented. h, i Huh7KO cell variants were manipulated as in g with the indicated nutrients: after live imaging for specific durations, chambers on the microscope stage were replenished with ALB (3.6 mg/ml, h) or GLU (25 mM, i), and live imaging continued. Data represent three independent experiments. See also Supplementary Movies 1–4.
Fig. 4
Fig. 4. Mitochondrial ATP-linked respiration was followed by TM4SF5-mediated ALB uptake.
Huh7-KO3#309 cells were transduced using a lentivirus for control empty vector, TM4SF5WT or TM4SF5A132V expression. On the basis of OCR or ECAR analyses, ATP-linked and maximal respiration as parameters of mitochondrial function and glycolysis or glycolytic capacity for glycolytic functions were calculated and plotted at mean ± s.e.m. values. Each data point in the graphs from the OCR and ECAR measurements represent a mean value of a triplicate experiment. ad Cells were then replenished with ALB to GLU-free SFM (a) or to GLU-containing SFM (b) without or with EIPA (10 μM, a, b and d) or CQ (25 μM, c) treatment for 15 h before a mitochondria stress test to measure their OCR (ac) or before measurement of ECAR (d). e, f Cells were replenished with single amino acids to GLU-free (e) or GLU-containing (f) SFM with or without EIPA treatment for 15 h, before OCR analysis. g Cells were replenished with Phe at different concentrations to GLU + SFM for 15 h before OCR analysis. h Huh7KO-TM4SF5WT cells were replenished with or without ALB alone or each amino acid to GLU + SFM for 15 h. Relative FITC-ALB uptake was measured in replated on collagen I as an index of macropinocytosis. P values were calculated via one-way ANOVA or unpaired Student’s t-tests, and P < 0.05 was considered statistically significant. *, **, *** and **** depict P < 0.05, 0.01, 0.001 and 0.0001, respectively. Data represent three independent experiments. See also Supplementary Fig. 5.
Fig. 5
Fig. 5. TM4SF5-mediated ALB uptake was linked to enhanced metastatic potential.
a Control Huh7KO, Huh7KO-TM4SF5WT or Huh7KO-TM4SF5A132V cell variants replated on collagen I with or without replenishment of ALB (3.6 mg/ml) to GLU (25 mM) + SFM for 15 h were analyzed for cell migration via tracking of individual cell movement for 17 h using a time-lapse microscope (12 cells per condition, left). The mean instantaneous speed per condition was calculated using MetaMorph software and presented (in μm/min, right). The dots indicate a mean value of the instantaneous speed calculated from the total migration distance of a cell for a measurement interval of 20 min. During the measurement period of 17 h, many instantaneous speed values (3 times per h × 17 h) were calculated for the mean value of a cell. bf Huh7KO cell variants manipulated as in a were treated with DMSO or TSAHC (5 μM) before cellular tracking for 16 h (b), with or without EIPA treatment at different concentrations before cellular tracking for 17 h (cf) and calculation of the mean instantaneous speed. Each trajectory line depicts a trajectory of one individual cell. P values were calculated via one-way ANOVA or unpaired Student’s t-tests, and P < 0.05 was considered statistically significant. g, h A schematic for the analysis of in vivo macropinocytosis (g): six-week-old BALB/c-nude male mice were liver-orthotopically injected with TM4SF5-null SNU449Cp or TM4SF5-overexpressing SNU449T7 cells stably transfected with luciferase (luc) constructs (106 cells/injection/mouse); luciferase signal was measured from mice fed a NCD containing 20% protein or a HGProD containing 20% GLU and 40% protein (n > 8) until day 20; on day 20, FITC-BSA (0.2 mg/mouse) was intratumorally injected, and 90 min later mice were killed for imaging of green signal in the liver; and representative images of luciferase in animals and FITC-BSA signals in liver tissue were obtained using IVIS Spectrum (h). i Liver tissues from patients with HCC (n = 7) were processed for H&E staining or immunohistochemistry. Data represent three independent experiments. See also Supplementary Fig. 6.
Fig. 6
Fig. 6. TM4SF5-mediated macropinocytosis involves cytosolic NCOA3 stabilization.
a Liver tissues from patients with HCC (n = 7) were processed for H&E staining or immunohistochemistry. b Analysis of co-expression between TM4SF5 and ALB in the LIHC (HCC) set from the TCGA database. c A Venn diagram showing protein binding to TM4SF5 (ref. ) or ALB (https://thebiogrid.org/106715/summary/homo-sapiens/alb.html). d Huh7-KO1#2 cells stably transfected with TM4SF5WT-HA cDNA were transfected with siRNA against control (NS), ITGA2 or NCOA3 sequences for 24 h and then replenished with GLU (25 mM) alone or ALB + GLU (3.6 mg/ml and 25 mM, respectively) to SFM for 15 h before analysis of the number of protrusions per cell. Each data point depicts a value from one individual cell. e Huh7KO-TM4SF5WT-HA cells were replenished with ALB + GLU to SFM for 15 h and processed for immunofluorescence. f Huh7KO cell variants were replenished with GLU alone or GLU + ALB to SFM for 15 h, before immunofluorescence for NCOA3 with DAPI co-staining. gl Huh7KO cell variants were transfected with indicated siRNA for control sequence (siNS) or siRNA against specific sequences (Table 1) for 24 h and then replenished with nutrients as indicated for 15 h before analysis of FITC-ALB spots (green) per (red fluorescent) (gi), cellular tracking for 17 h (j), immunofluorescence (k) or immunoblotting (l). Alternatively, cells were treated with DMSO or the PTEN inhibitor bpV (Phen) during nutrient replenishment for 15 h before analysis on FITC-ALB spots per cell. P values were calculated via one-way ANOVA or unpaired Student’s t-tests, and P < 0.05 was considered statistically significant. Data represent three independent experiments. See also Supplementary Figs. 7 and 8.
Fig. 7
Fig. 7. TM4SF5-mediated complex formation with NCOA3 and PTEN led to NCOA3 stabilization and PTEN inactivation.
a Huh7KO cell variants in normal culture condition with 10% FBS were were collected for whole-cell lysates (WCL), before co-immunoprecipitation (IP) using anti-TM4SF5EC2 antibody. b Huh7KO cell variants were replenished with nutrients as indicated for 15 h and collected before immunoblots for the indicated molecules. cg Huh7KO cell variants were or were not replenished with ALB to GLU + SFM for 0, 10, 30 or 60 min with or without MG132 (10 μM) treatment to block NCOA3 degradation: WCL were processed by IP using normal IgG (IgG), anti-TM4SF5EC2 polyclonal antibody (c and d, before immunoblotting for NCOA3 and either TM4SF5EC2 (c) or ubiquitin (d)), anti-NCOA3 rabbit monoclonal antibody (e), strep (f) or anti-PTEN rabbit monoclonal antibody (g). Immunoprecipitates were then immunoblotted in parallel to WCL and in some cases, cells were transfected with siNS or siNCOA3 for 24 h before nutrient replenishment (f). Ratio values of band intensities of certain immunoblots measured by using ImageJ software were normalized to those of the loading control or the total form of the molecule are presented. h Huh7KO cell variants were transfected with siNS or siNCOA3 for 24 h. ALB replenishment to GLU + SFM was performed for 0 or 10 min before the PTEN activity assay. P values were calculated via one-way ANOVA or unpaired Student’s t-tests, and P < 0.05 was considered statistically significant. Data represent three independent experiments.
Fig. 8
Fig. 8. Clinical importance of TM4SF5 and NCOA3 mRNA expression and serum ALB levels of TCGA patients with LIHC in terms of survival probability.
a The LIHC patient group from the public TCGA dataset (n = 291 with serum ALB level, [ALB]serum) showed a mean [ALB]serum of 3.77 g/dl (that is, 37.7 mg/ml). Subgroups depending on the expression levels of TM4SF5 and NCOA3 mRNA showed different [ALB]serum levels. b The entire LIHC patient group (n = 364 including patients without [ALB]serum information) was analyzed for the probability of survival depending on the expression levels of TM4SF5 and NCOA3 mRNA. c, d The LIHC group was subclassified into [ALB]serum >3.77 g/dl (c) or [ALB]serum ≤3.77 g/dl (d). The subgroups were further subclassified into TM4SF5low/NCOA3low (control), TM4SF5high, NCOA3high or TM4SF5high/NCOA3high categories to analyze the probability of survival depending on their mRNA expression levels. The survival probability of patient groups was analyzed to 1,200 days for statistical comparisons. P values were calculated by one-way ANOVA. e Schematic of the working model: in normal hepatocytes without notable TM4SF5 expression, extracellular ALB might not be efficiently uptaken for cellular energetics due to less macropinocytosis, supported by higher PTEN lipid phosphatase activity via greater NCOA3 localization into the nucleus or degradation in cytosol. Meanwhile, in cancerous hepatocytes with enhanced TM4SF5 expression, TM4SF5 binds to and promotes cytosolic stabilization of NCOA3, leading to an association with and acetylation of PTEN, which could eventually become inactive for PIP3 accumulation on membranes to allow efficient macropinocytosis-mediated uptake of extracellular ALB. ALB may then be degraded for mitochondrial ATP synthesis, leading to greater energetics for cell migration, presumably during intrahepatic metastasis for tumor nodule expansion or multifocality. See also Supplementary Fig. 7.

References

    1. Young, L. B. et al. Survival analysis using albumin–bilirubin (ALBI) grade for patients treated with drug-eluting embolic transarterial chemoembolization for hepatocellular carcinoma. J. Vasc. Interv. Radiol.33, 510–517.e511 (2022). - PubMed
    1. Vauthey, J. N. et al. Simplified staging for hepatocellular carcinoma. J. Clin. Oncol.20, 1527–1536 (2002). - PubMed
    1. Jeng, L. B., Chan, W. L. & Teng, C. F. Prognostic significance of serum albumin level and albumin-based mono- and combination biomarkers in patients with hepatocellular carcinoma. Cancers15, 1005 (2023). - PMC - PubMed
    1. Hauth, F., Roberts, H. J., Hong, T. S. & Duda, D. G. Leveraging blood-based diagnostics to predict tumor biology and extend the application and personalization of radiotherapy in liver cancers. Int J. Mol. Sci.23, 1926 (2022). - PMC - PubMed
    1. Spinella, R., Sawhney, R. & Jalan, R. Albumin in chronic liver disease: structure, functions and therapeutic implications. Hepatol. Int10, 124–132 (2016). - PubMed

MeSH terms