. 2025 Apr;57(4):962-972.
doi: 10.1038/s41588-025-02138-w. Epub 2025 Apr 4.

An eRNA transcription checkpoint for diverse signal-dependent enhancer activation programs

Affiliations

An eRNA transcription checkpoint for diverse signal-dependent enhancer activation programs

Lishuan Wang et al. Nat Genet. 2025 Apr.

Abstract

The evidence that signal- and ligand-dependent pathways function by activating regulatory enhancer programs suggests that a 'checkpoint' strategy may underline activation of many diversely regulated enhancers. Here we report a molecular mechanism common to several acute signal- and ligand-dependent enhancer activation programs based on release of a shared enhancer RNA (eRNA) transcription checkpoint. It requires recruitment of a DNA-dependent protein kinase catalytic subunit (DNA-PKcs)-phosphorylated RING finger repressor (Krüppel-associated box)-associated protein 1 (KAP1) as a modulator, inhibiting its association with 7SK and E3 small ubiquitin-like modifier (SUMO) ligase activity on the CDK9 subunit of positive transcription elongation factor b (P-TEFb). This facilitates formation of an activated P-TEFb complex, licensing eRNA elongation. Overcoming this checkpoint for signal-dependent enhancer activation occurs in diverse pathways, including estrogen receptor-α, NF-κB-regulated proinflammatory stimulation, androgen receptor and neuronal depolarization. Therefore, a specific strategy required to convert a basal state enhancer P-TEFb complex to an active state to release a conserved checkpoint is apparently employed by several functionally important signal-regulated regulatory enhancers to implement the instructions of the endocrine and paracrine system.


Conflict of interest statement

Competing interests: The authors declare no competing interests.

Figures
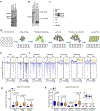
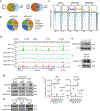
Extended Data Fig. 1 |
Extended Data Fig. 1 |. Validation of chromatin characteristics on ERα active MegaTrans enhancers in estrogen system by seCUT&Tag assay.
a) Coomassie Blue staining of recombinant pA-Tn5 and pAG-Tn5, purified from E. coil. Images are from three independent biological replicates. b) Testing transposes activity in vitro. Loaded recombinant pA-Tn5 or pAG-Tn5 incubated with linear DNA at 55 °C for 8 min. Images are from three independent biological replicates. c) Library PCR (polymerase chain reaction) production showing the successful CUT&Tag DNA with a clear nucleosomal periodicity in the TapeStation. Images are from three independent biological replicates. d) Schematic of CUT&Tag workflow in this paper. e) Heatmaps profiles of ATAC-seq and GATA3 CUT&Tag reads densities within a 3-kb window around MegaTrans enhancers (n = 1246), the data were generated from E2 treated or non-treated MCF7 cells. f) H3K4me1, H3K4me2, H3K4me3, H3K27me3 and H3K9me3 CUT&Tag profiles of heatmaps at MegaTrans enhancers in E2 treated or non-treated MCF7 cells. g) Box plots show ERα, p300 and GATA3 CUT&Tag normalized signals at MegaTrans enhancers (n = 1,246); the data were generated from E2 treated or non-treated MCF7 cells. Centerlines denote the medians; box limits the 25th and 75th percentiles, whiskers extend 1.5 times the interquartile range (IQR) from the 25th and 75th percentiles. The P values calculated with the two-side Wilcoxon rank sum test. h) Box plots show H3K4me1, H3K4me2, H3K4me3, H3K27me3, and H3K9me3 CUT&Tag normalized signals at MegaTrans enhancers (n = 1,246), the data were generated from E2 treated or non-treated MCF7 cells. Centerlines denote the medians; box limits the 25th and 75th percentiles, whiskers extend 1.5 times the interquartile range (IQR) from the 25th and 75th percentiles. The P values calculated with two-side Wilcoxon rank sum test.
Extended Data Fig. 2 |
Extended Data Fig. 2 |. Estrogen induced KAP1 binding to MegaTrans enhancers.
a) Tag density shows the signals of different KAP1 antibodies at MegaTrans enhancers (n = 1,246), the data were generated from E2 treated or non-treated MCF7 cells. b) Box plots show the normalized signals of different KAP1 antibodies at MegaTrans enhancers. Centerlines denote the medians; box limits the 25th and 75th percentiles, whiskers extend 1.5 times the interquartile range (IQR) from the 25th and 75th percentiles. The P values calculated with two-side Wilcoxon rank sum test. c) Spearman correlation heat map of KAP1, ERα, H3K27ac and H3K9me3 from two replicates. d) Scatterplot showing correlation analysis between KAP1 and ERα on MegaTrans enhancers. e) Scatterplot showing correlation analysis between KAP1 and H3K27ac on MegaTrans enhancers. f) Pie chart shows the genome-wide distribution of KAP1 CUT&Tag peaks in E2 treated MCF7 cells. g) Detail description of “Others” from f. h) Heat maps of KAP1, ERα, H3K27ac, and H3K9me3 CUT&Tag signals at KAP1 and H3K9me3 overlapped regions (n = 2,759) in E2 treated or non-treated MCF7 cells.
Extended Data Fig. 3 |
Extended Data Fig. 3 |. Phosphorylation of KAP1 at S824 but not S473 exhibits presentation at enhancers.
a) Venn Diagram illustrating the overlapped peaks between KAP1 and pS473-KAP1, or pS824-KAP1. b) Pie chart shows the genome-wide distribution of pS473-KAP1 and pS824-KAP1 peaks in E2 treated MCF7 cells by CUT&Tag. c) Heatmaps profiling of KAP1, pS473-KAP1, and pS824-KAP1 signals at KAP1-enriched E2 induced genes (n = 480), the data were generated from E2 treated or non-treated MCF7 cells. d) Browser track showing CUT&Tag signals at TFF1e, FOXC1e, RETe, and PVT1e loci. e) Immunoblot shows pS824-KAP1 level before or after E2 treatment in MCF7 cells. f) Immunoblot shows pS824-KAP1 level after endogenous KAP1 immunoprecipitation assay with or without E2 treatment in MCF7 cells. g) Endogenous DNA-PKcs co-IP assay showing the interaction between DNA-PKcs with ERα, KAP1, and pS824-KAP1. h) Endogenous pS824-KAP1 co-IP assay showing the interaction between pS824-KAP1 and DNA-PKcs. The experiments were repeated three times with similar results. i) RT-qPCR results show that the transcription of RETe and PVT1e are impaired with DNA-PKcs inhibitor NU7441 rather than the ATM inhibitor KU55933. Data presented as mean values ± s.d. from three independent biological replicates. P values are from two-tailed t-test.
Extended Data Fig. 4 |
Extended Data Fig. 4 |. Enhancer RNA synthesis regulated by KAP1.
a) RT-qPCR results show the knockdown efficiency of KAP1 with two different shRNAs targets. b) KAP1 protein level was determined by immunoblot in wild-type and KAP1 knockdown cells. c) RT-qPCR results show the KAP1 expression level in wild-type and CRISPR-Cas9 knockout cells. d) KAP1 protein level showing by immunoblot in wild-type and the CRISPR-Cas9 knockout cells. e) RT-qPCR results show that the E2 induced TFF1e, FOXC1e, RETe, and PVT1e are impaired by knockdown of KAP1 with two different shRNAs targets, which can be recused by doxycycline-induced expression of WT KAP1. Data presented as mean values ± s.d. from three independent biological replicates. P values are from two-tailed t-test. f) RT-qPCR results show that the E2 induced TFF1e and FOXC1e expression are impaired by KAP1 knockout. g) Metagene plots showing PRO-seq signals on MegaTrans enhancers (n = 791) in wild-type and the KAP1 knockout cells. h) Box plot analysis of PRO-seq data on MegaTrans enhancers (n = 791) in wild-type and the KAP1 knockout cells. The P values calculated with the two-side Wilcoxon rank sum test.Centerlines denote the medians; box limits the 25th and 75th percentiles, whiskers extend 1.5 times the interquartile range (IQR) from the 25th and 75th percentiles. The P values calculated with the two-side Wilcoxon rank sum test. i) Pie chart shows the 522 of estrogen-positively regulated genes (log2 [MCF7 + E2/MCF7-E2] fold change > 1) are dependent on pS824 KAP1 highly enriched MegaTrans enhancers. j) Box plot analysis of PRO-seq data on genes induced by estrogen (n = 522) in wild-type and the KAP1 knockout cells. Centerlines denote the medians; box limits the 25th and 75th percentiles, whiskers extend 1.5 times the interquartile range (IQR) from the 25th and 75th percentiles. The P values calculated with the two-side Wilcoxon rank sum test. k) Heat map of pS824-KAP1 signals within a 3-kb window at MegaTrans enhancers (n = 791), the data were generated from MCF7 cells exposed to Ethanol or E2 in the presence of DMSO or NU7441. l) RT-qPCR results show that the impaired transcription of RETe is recused by doxycycline-induced expression of KAP1 WT, KAP1 S824D, but not KAP1 S824A. Data presented as mean values ± s.d. from three independent biological replicates. P values are from two-tailed t-test.
Extended Data Fig. 5 |
Extended Data Fig. 5 |. ERα-KAP1 assembles on estrogen stimulated enhancers.
a) KAP1 Chromatin-IP-MS shows the components that may be involved in estrogen activated transcription program. b) Co-IP assay showing interaction between HA-KAP1, ERα, and GATA3. The experiment repeated three times with similar results. c) Endogenous co-IP assay showing the interaction between KAP1 and ERα, GATA3. The experiments repeated three times with similar results. d) Pie chart shows 4,095 ERα binding loci on 7,217 E2 induced KAP1 peaks (from 2 replicates). e) Box plots show the KAP1, ERα, H3K27ac, and H3K9me3 CUT&Tag signals at 4095 ERα-KAP1 binding sites. Centerlines denote the medians; box limits the 25th and 75th percentiles, whiskers extend 1.5 times the interquartile range (IQR) from the 25th and 75th percentiles. The P values were calculated with two-side Wilcoxon rank sum test. f) Heatmaps profiling of KAP1, ERα, H3K27ac and H3K9me3 CUT&Tag signals within a 3-kb window around 4,095 ERα-KAP1 binding sites. The data were generated from E2 treated or non-treated MCF7 cells.
Extended Data Fig. 6 |
Extended Data Fig. 6 |. Loss of KAP1 declines elongation factors across enhancers.
a) Co-IP assay showing interaction between HA-KAP1 and other factors. The experiment repeated three times with similar results. b) Endogenous co-IP assay showing the interaction between KAP1 with Pol II S2P, CDK9, BRD4, PAF1 and ELL2. The experiments repeated three times with similar results. c) The consecutive co-IP experiments detected KAP1 interacts with elongation machinery dependent on ERα. d) IGV track showing CUT&Tag signals at TFF1e, FOXC1e, RETe, and PVT1e loci. All the track signals were under E2 treatment. e) Heatmaps profiling of CDK9, BRD4, PAF1, ELL2 and MED26 (Control) signals within a 3-kb window at MegaTrans enhancers (n = 791), the data were generated from E2 treated wild-type or KAP1 knock-out MCF7 cells.
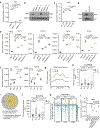
Extended Data Fig. 7 |
Extended Data Fig. 7 |. E2 signaling phosphorylated KAP1 to attract elongation factors.
a) Co-IP assay showing interaction between HA-KAP1(WT, S824A, S824D) and ERα. The experiments repeated three times with similar results. b) The immunoprecipitation of CDK9 in MCF7 cells followed by immunoblotting with CDK9 and SUMO1 antibody in minus or plus E2 condition. c) RT-qPCR results show that the impaired transcription of TFF1e, FOXC1e, RETe, and PVT1e are recused by doxycycline-inducible expression of KAP1 C65/68 A, not the S824A (Fig. 1 and Extended Data Fig. 1). Data presented as mean values ± s.d. from three independent biological replicates. P values are from two-tailed t-test. d) Co-IP assay showing interaction between HA-KAP1 WT/S824A/S824D and Pol II, Pol II S2P, CDK9, BRD4, PAF1, and ELL2. The experiment repeated three times with similar results. e) Endogenous pS824-KAP1 co-IP assay showing the interaction between pS824-KAP1 and Pol II, Pol II S2P, CDK9, BRD4, PAF1, and ELL2. The experiments repeated three times with similar results. f) Heatmaps and profiles showing Pol II CUT&Tag signals at MegaTrans enhancers (n = 791) in wild-type and KAP1 knockout cells. g) Heatmaps and profiles showing Pol II S2P CUT&Tag signals at MegaTrans enhancers (n = 791) in wild-type and KAP1 knockout cells. h) IGV track showing Pol II and Pol II S2P CUT&Tag signals at TFF1e, FOXC1e, RETe, and PVT1e loci. All the track signals were under E2 treatment.
Extended Data Fig. 8 |
Extended Data Fig. 8 |. TNF-α induced genes are regulated by KAP1 mediated putative enhancers.
a) IGV tracks showing CUT&Tag signals at Tnfaip3 loci. The dashed box represents the position of putative enhancers. b) RT-qPCR results show that the TNF-α induced transcription of Tnfaip3 mRNA is effect by knockdown of KAP1. c) IGV tracks showing CUT&Tag signals at Tnfa loci. The dashed box represents the position of putative enhancers. d) RT-qPCR results show that the TNF-α induced transcription of Tnfa mRNA is effect by knockdown of KAP1. e) IGV tracks showing CUT&Tag signals at Il8 loci. The dashed box represents the position of putative enhancers. f) RT-qPCR results show that the TNF-α induced transcription of Il8 mRNA is effect by knockdown of KAP1. Data presented as mean values ± s.d. from three independent biological replicates. P values are from two-tailed t-test.
Extended Data Fig. 9 |
Extended Data Fig. 9 |. Elongation factors bound-enhancers associated with eRNAs synthesis.
a) RT-qPCR results show that the transcription of Tmprss2e, Klk2e and Klk3e are reduced with DNA-PKcs inhibitor NU7441 rather than the ATM inhibitor KU55933 under DHT treatment. b) RT-qPCR results show the knockdown efficiency of CDK9, BRD4, PAF1, and ELL2. c) RT-qPCR results show that the E2 induced TFF1e, FOXC1e, RETe, and PVT1e are downregulated by knockdown of CDK9, BRD4, PAF1 and ELL2. d) RT-qPCR results show that the DHT induced Tmprss2e and Klk2e transcription are compromised by knockdown of CDK9, BRD4, PAF1 and ELL2. e) RT-qPCR results show that the TNF-α induced Il10e and Il19e activation are impaired by knockdown of CDK9, BRD4, PAF1 and ELL2. Data presented as mean values ± s.d. from three independent biological replicates. P values are from two-tailed t-test.
Extended Data Fig. 10 |
Extended Data Fig. 10 |. The function of enhancer checkpoint module in different signals stimulated enhancer activation.
a) Strip plot showing the top 12 histone modifications most enriched on the ERα active enhancers (n = 791) (http://dbtoolkit.cistrome.org/). b) Strip plot showing the top 13 histone modifications enriched on the AR active enhancers (n = 1,266) (http://dbtoolkit.cistrome.org/). c) Strip plot showing the top 13 histone modifications most enriched on the p65 active enhancers (n = 852) (http://dbtoolkit.cistrome.org/). d) Violin plot shows H3K27ac enrichment score is different on ERα-, AR- and p65-activated enhances (http://dbtoolkit.cistrome.org/). The P values calculated with the two-side Wilcoxon rank sum test. e) Co-IP assay showing interaction between AR, DNA-PKcs and KAP1. The experiments repeated three times with similar results. f) Co-IP assay showing interaction between p65, DNA-PKcs and KAP1. The experiments repeated three times with similar results. g) Scatterplot shows the correlation of enrichment of Pol II S2P and KAP1 signals on CREB1-bound enhancers with (right) or without (left) KCl stimulation in neuron.
Fig. 1 |
Fig. 1 |. Estrogen signaling elicits a checkpoint event at enhancers for eRNA synthesis.
a, Heatmaps and profiles of CUT&Tag read densities within a 3-kb window around MegaTrans enhancers (n = 1,246). The data were generated from E2-treated or untreated MCF7 cells. b, RT–qPCR results showing that the transcription of TFF1e and FOXC1e is impaired with DNA-PKcs inhibitor NU7441, rather than the ATM inhibitor KU55933. Data are presented as mean values ± s.d. from three independent biological replicates. Ab, antibody; DMSO, dimethyl sulfoxide. P values are from a two-tailed Student’s t-test. c, Metagene plots showing PRO-seq signals on 791 pSer824-KAP1, highly enriched MegaTrans enhancers in negative control and the KAP1 KD cells. d, Box plot analysis of PRO-seq data of enhancers (n = 791) and genes (n = 522) induced by estrogen in negative control and the KAP1 KD cells. The center lines denote the medians, the box limits the 25th and 75th percentiles and the whiskers extend 1.5× the interquartile range (IQR) from the 25th and 75th percentiles. The P values were calculated using the two-sided Wilcoxon’s rank-sum test. RPKM, reads per kilobase per million mapped reads. e, Integrative Genomics Viewer tracks showing PRO-seq and CUT&Tag signals at the TFF1e locus. f, Box plots showing ERα and pSer824-KAP1 CUT&Tag signals at perS824-KAP1 highly enriched enhancers (n = 791) in dimethyl sulfoxide- or NU7441-treated cells. The center lines denote the medians, the box limits the 25th and 75th percentiles and the whiskers extend 1.5× the IQR from the 25th and 75th percentiles. The P values were calculated using the two-sided Wilcoxon’s rank-sum test. g, RT–qPCR results showing that the impaired transcription of TFF1e and FOXC1e are recused by doxycycline-induced expression of KAP1 WT, Ser824Asp-KAP1, but not Ser824Ala-KAP1. Data are presented as mean values ± s.d. from three independent biological replicates. The P values are from a two-tailed Student’s t-test.
Fig. 2 |
Fig. 2 |. Disruption of eRNA synthesis checkpoint lost elongation factor binding without alteration establishment of enhancers.
a, Representative images of individual z-slices of IF signals and the merged channels. The zoomed column displays the overlap region. Scale bar, 2.5 μm. Images are from three independent biological replicates. b, Heatmaps profiling KAP1 binding at MegaTrans enhancers (n = 791) in shNTC (negative control), shERα and shGATA3 cells with or without E2 treatment, using a 3-kb window. c, Box plots showing ERα, GATA3 and TOP1cc signals at MegaTrans enhancers (n = 791) in WT and KAP1 KO cells. The center lines denote the medians, the box limits the 25th and 75th percentiles and the whiskers extend 1.5× the IQR from the 25th and 75th percentiles. The P values were calculated using the two-sided Wilcoxon’s rank-sum test. d, Box plots showing H3K27ac and H3K4me1 CUT&Tag signals and ATAC–seq signals at MegaTrans enhancers (n = 791) in WT and KAP1 KO cells. The center lines denote the medians, the box limits the 25th and 75th percentiles and the whiskers extend 1.5× the IQR from the 25th and 75th percentiles. The P values were calculated using the two-sided Wilcoxon’s rank-sum test. e, Tag distribution analysis representing CDK9, BRD4, PAF1, ELL2 and MED26 CUT&Tag signals at MegaTrans enhancers (n = 791) in WT and KAP1 KO cells. The P values were calculated using the two-sided Wilcoxon’s rank-sum test.
Fig. 3 |
Fig. 3 |. Release of P-TEFb from 7SK via eRNA synthesis checkpoint modulation.
a, In vitro 7SK RNA pulldown assay represented by western blotting. b, Endogenous CDK9 co-IP assay showing the interaction between CDK9 and LARP7, BRD4, CyCT1, KAP1 and pSer824-KAP1. c, RIP–qPCR showing the binding of KAP1 on 7SK RNA before and after E2 treatment. d, RIP–qPCR showing the binding of KAP1 on 7SK RNA in shNTC (negative control) and shERα before and after E2 treatment. e, CUT&Tag profiling the enrichment of HA-KAP1, HA-Ser824Ala-KAP1 and HA-Ser824Asp-KAP1 on pSer824-KAP1 highly enriched MegaTrans enhancers (n = 791) with or without E2. f, RIP–qPCR indicating the binding of Ser824Ala or Ser824Asp variant HA-tagged KAP1 on 7SK RNA in E2-treated or untreated MCF7 cells. Data are presented as mean values ± s.d. from three independent biological replicates. The P values are from a two-tailed Student’s t-test. g, Co-IP assay showing the interaction between endogenous JMJD6 and KAP1 or pSer824-KAP1 before or after E2 treatment. h, Heatmaps for JMJD6 CUT&Tag signals at pSer824-KAP1 highly enriched MegaTrans enhancers (n = 791) in WT and KAP1 KO cells with E2 treatment (right).
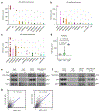
Fig. 4 |
Fig. 4 |. P-TEFb activity at enhancer is regulated by eRNA synthesis checkpoint.
a, HA-tagged CDK9 co-overexpressed with Flag-tagged SUMO1 or SUMO2 and SUMO3, UBC9 and KAP1 in HEK293T cells and IP with anti-HA-tag beads, followed by western blotting with anti-HA or anti-Flag antibodies. b, HA-tagged CDK9 co-overexpressed with Flag-tagged SUMO1, UBC9, KAP1, KAP1-Cys65 and 68A, KAP1-Ser824Ala or KAP1-Ser824Asp in HEK293T cells immunoprecipitated with anti-HA-tag beads, followed by western blotting with anti-HA or anti-Flag antibodies. c, RT–qPCR results showing that the impaired transcription of TFF1e is recused by doxycycline-induced expression of KAP1-Cys65 and 68A, not the Ser824Ala (Fig. 1 and Extended Data Fig. 1). Data are presented as mean values ± s.d. from three independent biological replicates. The P values are from a two-tailed Student’s t-test. d, Box plots showing Pol II CUT&Tag signals at MegaTrans enhancers (n = 791) in WT and KAP1 KO cells. The center lines denote the medians, the box limits the 25th and 75th percentiles and the whiskers extend 1.5× the IQR from the 25th and 75th percentiles. The P values were calculated using the two-sided Wilcoxon’s rank-sum test. e, Tag distribution analysis representing Pol II S2P signals at pSer824-KAP1 highly enriched MegaTrans enhancers (n = 791) in WT and KAP1 KO cells. f, Tag distribution analysis representing Pol II S5P signals at pSer824-KAP1 highly enriched MegaTrans enhancers (n = 791) in WT and KAP1 KO cells. The P values were calculated using the two-sided Wilcoxon’s rank-sum test. g, PR distribution calculated based on the CUT&Tag signals of Pol II S5P and S2P for MegaTrans enhancers (n = 791) in WT and KAP1 KO cells. The P values were calculated using the two-sided Wilcoxon’s rank-sum test. The center lines denote the medians, the box limits the 25th and 75th percentiles and the whiskers extend 1.5× the IQR from the 25th and 75th percentiles. The P values were calculated using the two-sided Wilcoxon’s rank-sum test. h, Box plots displaying the average changes of PR as shown in g. i, The 4C-seq experiments in MCF7, KAP1 KO, DNA-PKcs inhibitor (NU7440) treatment and doxycycline-induced expression of KAP1-Ser824Ala in KAP1 KO background cells after E2 stimulation, based on a TFF1 enhancer viewpoint. j, Browser tracks showing H3K4me3 and H3K27ac CUT&Tag signals at TFF1 locus in E2-treated or untreated MCF7 cells.
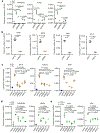
Fig. 5 |
Fig. 5 |. Presence of enhancer checkpoint in hormone response and proinflammatory state.
a, Heatmaps profiling CUT&Tag read densities within a 3-kb window around AR active enhancers (n = 1,266). The data were generated from DHT-treated or untreated LNCaP cells. b, RT–qPCR results showing that the DHT-induced transcription of TMPRSS2e, KLK2e and KLK3e is impaired by KD of KAP1 with two different shRNA targets. Data are presented as mean values ± s.d. from three independent biological replicates. The P values are from a two-tailed Student’s t-test. c, Heatmaps profiling CUT&Tag read densities within a 3-kb window around p65 active enhancers (n = 852) in the proinflammatory state. The data were generated from TNF-treated or untreated A549 cells. d, RT–qPCR results showing that the TNF-induced transcription of Il10e, Il19e and Ccl2e is impaired by KD of KAP1 with two different shRNA targets. Data are presented as mean values ± s.d. from three independent biological replicates. The P values are from a two-tailed Student’s t-test. e, Box plots showing H3K27ac levels at ERα-, AR- and p65-enriched enhancers in MCF7 (n = 791), LNCaP (n = 1,266) and A549 (n = 852) cells. Veh, vehicle. The number represents the average. The center lines denote the medians, the box limits the 25th and 75th percentiles and the whiskers extend 1.5× the IQR from the 25th and 75th percentiles. The P values were calculated using the two-sided Wilcoxon’s rank-sum test and the number represents the average. f, The H3K27ac ratio of vehicle to signal on different enhancer types. The number represents the median. g, Box plots showing KAP1-binding signals at ERα-, AR- and p65-enriched enhancers in MCF7 (n = 791), LNCaP (n = 1,266) and A549 (n = 852) cells. The center lines denote the medians, the box limits the 25th and 75th percentiles and the whiskers extend 1.5× the IQR from the 25th and 75th percentiles. The P values were calculated using the two-sided Wilcoxon’s rank-sum test and the number represents the average. h, The KAP1-binding vehicle to signal ratio at enhancers in different cell types. The number represents the median.
Fig. 6 |
Fig. 6 |. Implications of enhancer checkpoint in neuronal enhancer activation.
a, Heatmaps profiling of CUT&Tag read densities within a 3-kb window around CREB1-regulated enhancers (n = 3,113). The data were generated from different time points of KCl-treated primary murine neuronal cultures. b, Browser track showing CREB1, KAP1 and H3K27ac CUT&Tag signals at Fos and Npas4 loci. The enhancer region is highlighted with a black box. c, Heatmaps profiling H3K27ac, CDK9 and Pol II S2P signals within a 3-kb window at CREB1-bound enhancers. The data were generated from different time points of KCl-treated primary murine neuronal cultures. d, Proposed model: step 1, H3K4me1-marked base-state enhancers; step 2, signal or ligand stimulation promoting the recruitment of TFs and co-factors to enhancers; step 3, enhancer checkpoint establishment to recruit DNA-PKcs-KAP1-P-TEFb with P-TEFb inactive at this state; and step 4, DNA-PKcs-phosphorylated KAP1 preventing its association with 7SK and SUMOylation of CDK9, the catalytic subunit of P-TEFb, and thereby activated P-TEFb complex attracting elongation factors.

References

    1. Moreau P et al. The SV40 72 base repair repeat has a striking effect on gene expression both in SV40 and other chimeric recombinants. Nucleic Acids Res. 9, 6047–6068 (1981). - PMC - PubMed
    1. Banerji J et al. Expression of a beta-globin gene is enhanced by remote SV40 DNA sequences. Cell 27, 299–308 (1981). - PubMed
    1. Bulger M & Groudine M Functional and mechanistic diversity of distal transcription enhancers. Cell 144, 327–339 (2011). - PMC - PubMed
    1. Long HK, Prescott SL & Wysocka J Ever-changing landscapes: transcriptional enhancers in development and evolution. Cell 167, 1170–1187 (2016). - PMC - PubMed
    1. Panigrahi A & O’Malley BW Mechanisms of enhancer action: the known and the unknown. Genome Biol. 22, 108 (2021). - PMC - PubMed

MeSH terms

Substances

LinkOut - more resources