Observational Study
. 2025 Jun;31(6):1903-1910.
doi: 10.1038/s41591-025-03620-y. Epub 2025 Apr 4.

Implementation of a national AI technology program on cardiovascular outcomes and the health system

Affiliations
Observational Study

Implementation of a national AI technology program on cardiovascular outcomes and the health system

Timothy A Fairbairn et al. Nat Med. 2025 Jun.

Abstract

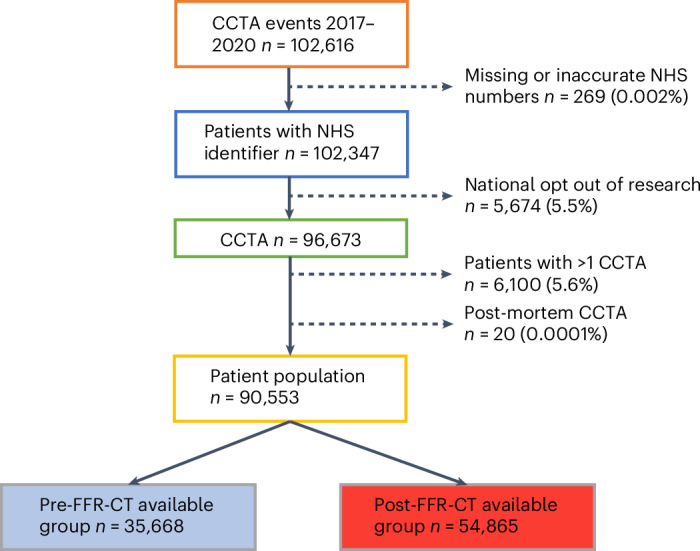
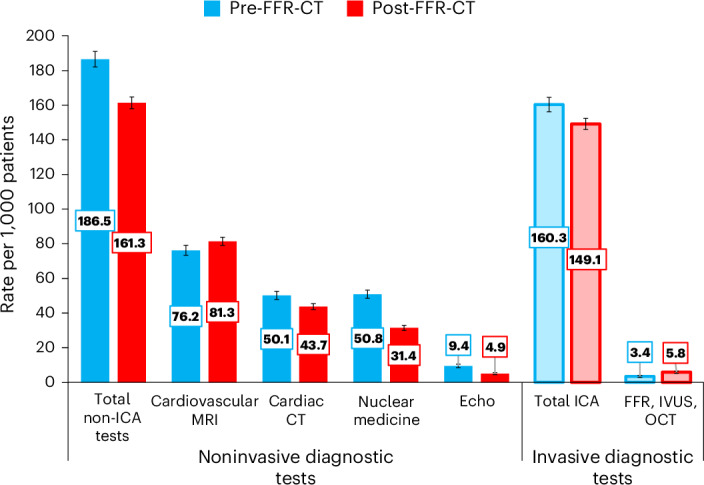
Coronary artery disease (CAD) is a major cause of ill health and death worldwide. Coronary computed tomographic angiography (CCTA) is the first-line investigation to detect CAD in symptomatic patients. This diagnostic approach risks greater second-line heart tests and treatments at a cost to the patient and health system. The National Health Service funded use of an artificial intelligence (AI) diagnostic tool, computed tomography (CT)-derived fractional flow reserve (FFR-CT), in patients with chest pain to improve physician decision-making and reduce downstream tests. This observational cohort study assessed the impact of FFR-CT on cardiovascular outcomes by including all patients investigated with CCTA during the national AI implementation program at 27 hospitals (CCTA n = 90,553 and FFR-CT n = 7,863). FFR-CT was safe, with no difference in all-cause (n = 1,134 (3.2%) versus 1,612 (2.9%), adjusted-hazard ratio (aHR) 1.00 (0.93-1.08), P = 0.97) or cardiovascular mortality (n = 465 (1.3%) versus 617 (1.1%), aHR 0.96 (0.85-1.08), P = 0.48), while reducing invasive coronary angiograms (n = 5,720 (16%) versus 8,183 (14.9%), aHR 0.93 (0.90-0.97), P < 0.001) and noninvasive cardiac tests (189/1,000 patients versus 167/1,000), P < 0.001). Implementation of an AI-diagnostic tool as part of a health intervention program was safe and beneficial to the patient pathway and health system with fewer cardiac tests at 2 years.


Conflict of interest statement

Competing interests: The authors received no specific funding for this work. S.M. and C.R. are employees of HeartFlow. An MRC Industrial Collaboration Agreement was signed between collaborators and HeartFlow. HeartFlow provided the pseudo-anonymized FFR-CT data but had no role in the study design, data collection, analysis, interpretation of the data, writing or decision to submit the manuscript. The other authors declare no competing interests.

Figures

Fig. 1
Fig. 1. Flow diagram of the 3-year coronary computed tomography angiography (CCTA) data.
Data provided by the 27 NHS England hospitals with subsequent identification of patient numbers, repeat tests and patients excluded due to withdrawal of consent (national ‘Opt out of research’ database).
Fig. 2
Fig. 2. Kaplan–Meier charts of the cumulative incidence of the individual primary objectives over 2 years after index CCTA.
ac, The incidence of all-cause death (a), cardiovascular death (b) and MI (c) rates. d, The incidence of ICA without subsequent revascularization. The shaded areas indicate the 95% CIs.
Fig. 3
Fig. 3. The number of cardiac diagnostics performed as a second-line test within 2 years of the index CCTA scan (rate per 1,000 patients).
Subcategorized into noninvasive tests (cardiovascular MRI, cardiac CT, nuclear medicine (positron emission tomography and radionuclide imaging) and echocardiography (excluding transthoracic echocardiography)) and invasive tests (total ICA and intracoronary imaging (optical coherence tomography (OCT), intravascular ultrasound (IVUS) and invasive FFR (FFR))). The error bars indicate the 95% CIs.
Extended Data Fig. 1
Extended Data Fig. 1. English hospital site map.
A map of NHS England with the 25 different NHS Trusts plotted, their corresponding Integrated Care Board (ICB) and number of patients (n) contributed to the study.
Extended Data Fig. 2
Extended Data Fig. 2. Patient recruitment and site onboarding for the AI technology.
a Patient recruitment and drop out for 6 months, 12 months and 24 month time points: Categorized as pre (blue line) or post (red line) FFR-CT availability. All 27 sites provided patient data from April 2017 – April 2020 with 2 sites (UHD and BRI) providing data from April 2017-December 2020. b Site FFR-CT availability: Introduction of FFR-CT at a site level was used to define whether the CCTA was performed before or after FFR-CT was made available at their site. The bubbles represent the time that FFR-CT was made available for clinical use and the number of CCTA scans performed at each site over the study recruitment time period (April 2017-December 2020).
Extended Data Fig. 3
Extended Data Fig. 3. Event curves for myocardial infarction and percutaneous intervention at different time points.
a Myocardial Infarction (MI) events and B. Percutaneous Intervention (PCI) rates at 90 days, 1 year and 2 years. Cox proportional hazards univariate analysis (unadjusted) p values. The shaded areas indicate the 95% CIs.
Extended Data Fig. 4
Extended Data Fig. 4. Propensity Score Matching balancing.
Propensity Score Matching covariate balancing pre and post matching using a standard mean difference of <0.05.
Extended Data Fig. 5
Extended Data Fig. 5. Event curves for the primary outcomes of the Propensity Matched Scoring population.
a. All-cause death, b. Cardiovascular death, c. Myocardial infarction, d. ICA with no revascularization. Kaplan-Meier (KM) charts of the cumulative incidence of the individual primary objectives over 2 years post index CCTA on the Propensity Matched population (n = 30,665 in each group). Blue represents pre FFR-CT availability. Red line represents post FFR-CT availability. The shaded areas indicate the 95% CIs.
Extended Data Fig. 6
Extended Data Fig. 6. Referral to treatment time.
Time (in years) from CCTA date (Time 0) to the date of revascularisation (PCI or CABG) for the 6,784 patients who had coronary revascularisation within the 2-year follow-up. The mean wait was 0.41 years for both FFR-CT unavailable and FFR-CT available groups. The group who received FFR-CT had a insignificant shorter wait (0.4 years). The box represents the interquartile range with the median as the middle segment, the mean as the black dot and the whiskers as minimum and maximum waits.
Extended Data Fig. 7
Extended Data Fig. 7. Autoregressive Integrated Moving Average curve for the incidence of myocardial infarction over teh study time period.
Autoregressive Integrated Moving Average (ARIMA) method were performed. Weekly observed rates of all primary outcomes were assessed before and after FFR-CT introduction, then modelled for observed versus expected changes in outcomes post-health intervention over time. The dashed black line represents the time that FFR-CT was made available to the hospital sites.
Extended Data Fig. 8
Extended Data Fig. 8. FFR-CT report example.
A positive FFR-CT (centre panel). The LAD shows a gradual reduction from proximal to distal vessel with a stenosis specific value of 0.72 and distal vessel value of 0.65. The circumflex was ‘negative’ at 0.89 and the RCA was occluded. The scale on the left panel shows the degree of flow limitation and likelihood of functional significance as a continuum with the margins of error on the right panel to help the physician in their decision process.

References

    1. Gulati, M. et al. AHA/ACC/ASE/CHEST/SAEM/SCCT/SCMR guideline for the evaluation and diagnosis of chest pain: a report of the American College of Cardiology/American Heart Association Joint Committee on clinical practice guidelines. Circulation144, e368–e454 (2021). - PubMed
    1. Knuuti, J. et al. ESC guidelines for the diagnosis and management of chronic coronary syndromes. Eur. Heart J.41, 407–477 (2020). - PubMed
    1. Chest Pain of Recent Onset: Assessment and Diagnosis. NICE Guidelines (NICE, 2010).
    1. Inohara, T. et al. Appropriateness ratings of percutaneous coronary intervention in Japan and its association with the trend of noninvasive testing. JACC Cardiovasc. Inter.7, 1000–1009 (2014). - PubMed
    1. HeartFlow FFRCT for Estimating Fractional Flow Reserve from Coronary CT Angiography (MTG32) (National Institute for Health and Care Excellence, 2017); https://www.nice.org.uk/guidance/mtg32/resources

Publication types